Terpeast
-
Posts
6,687 -
Joined
-
Last visited
Content Type
Profiles
Blogs
Forums
American Weather
Media Demo
Store
Gallery
Everything posted by Terpeast
-
Yeah, I’m looking at front royal and winchester to see what’s coming next. I’m barely within the southern edge of the pivot but that may be enough
-
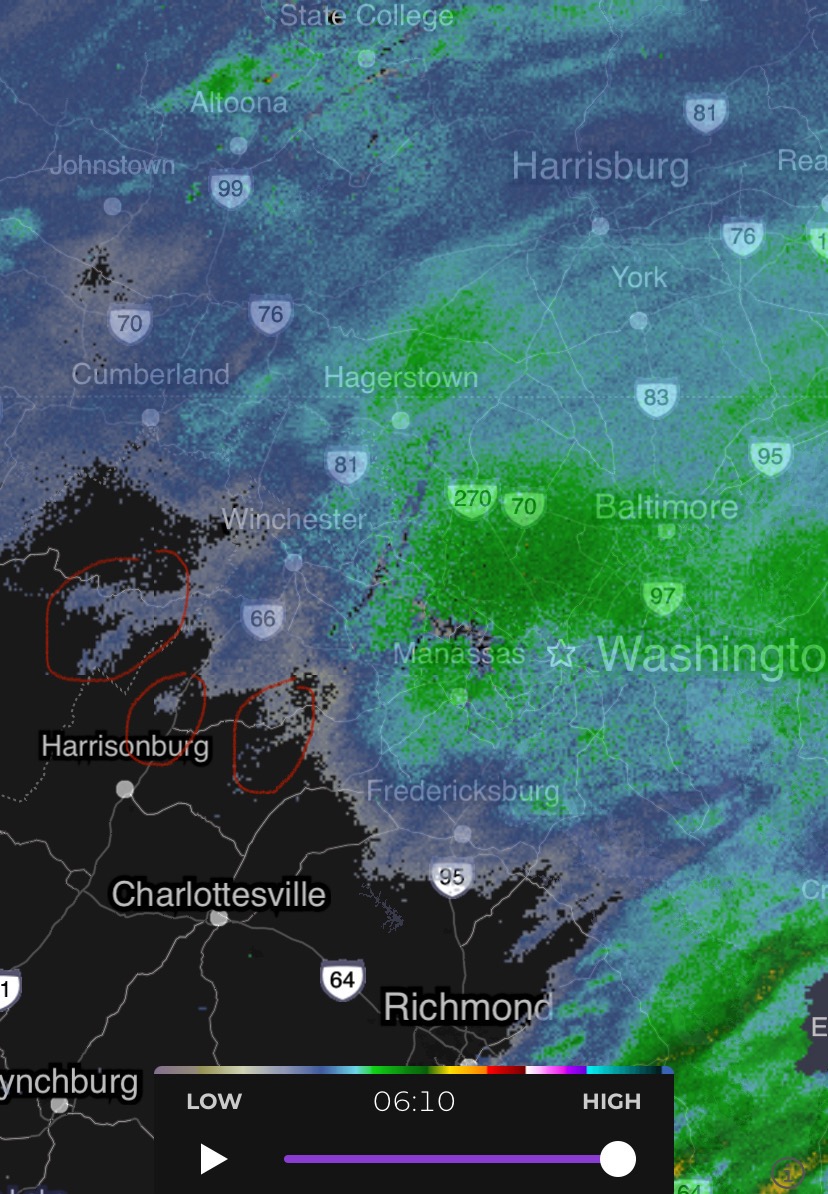
Pivot congealing into a band of steady mod snow from N VA through central/NE MD that will last a while
-
Bigger flakes now. Back into dendritic growth
-
Light snow ramping up again
-
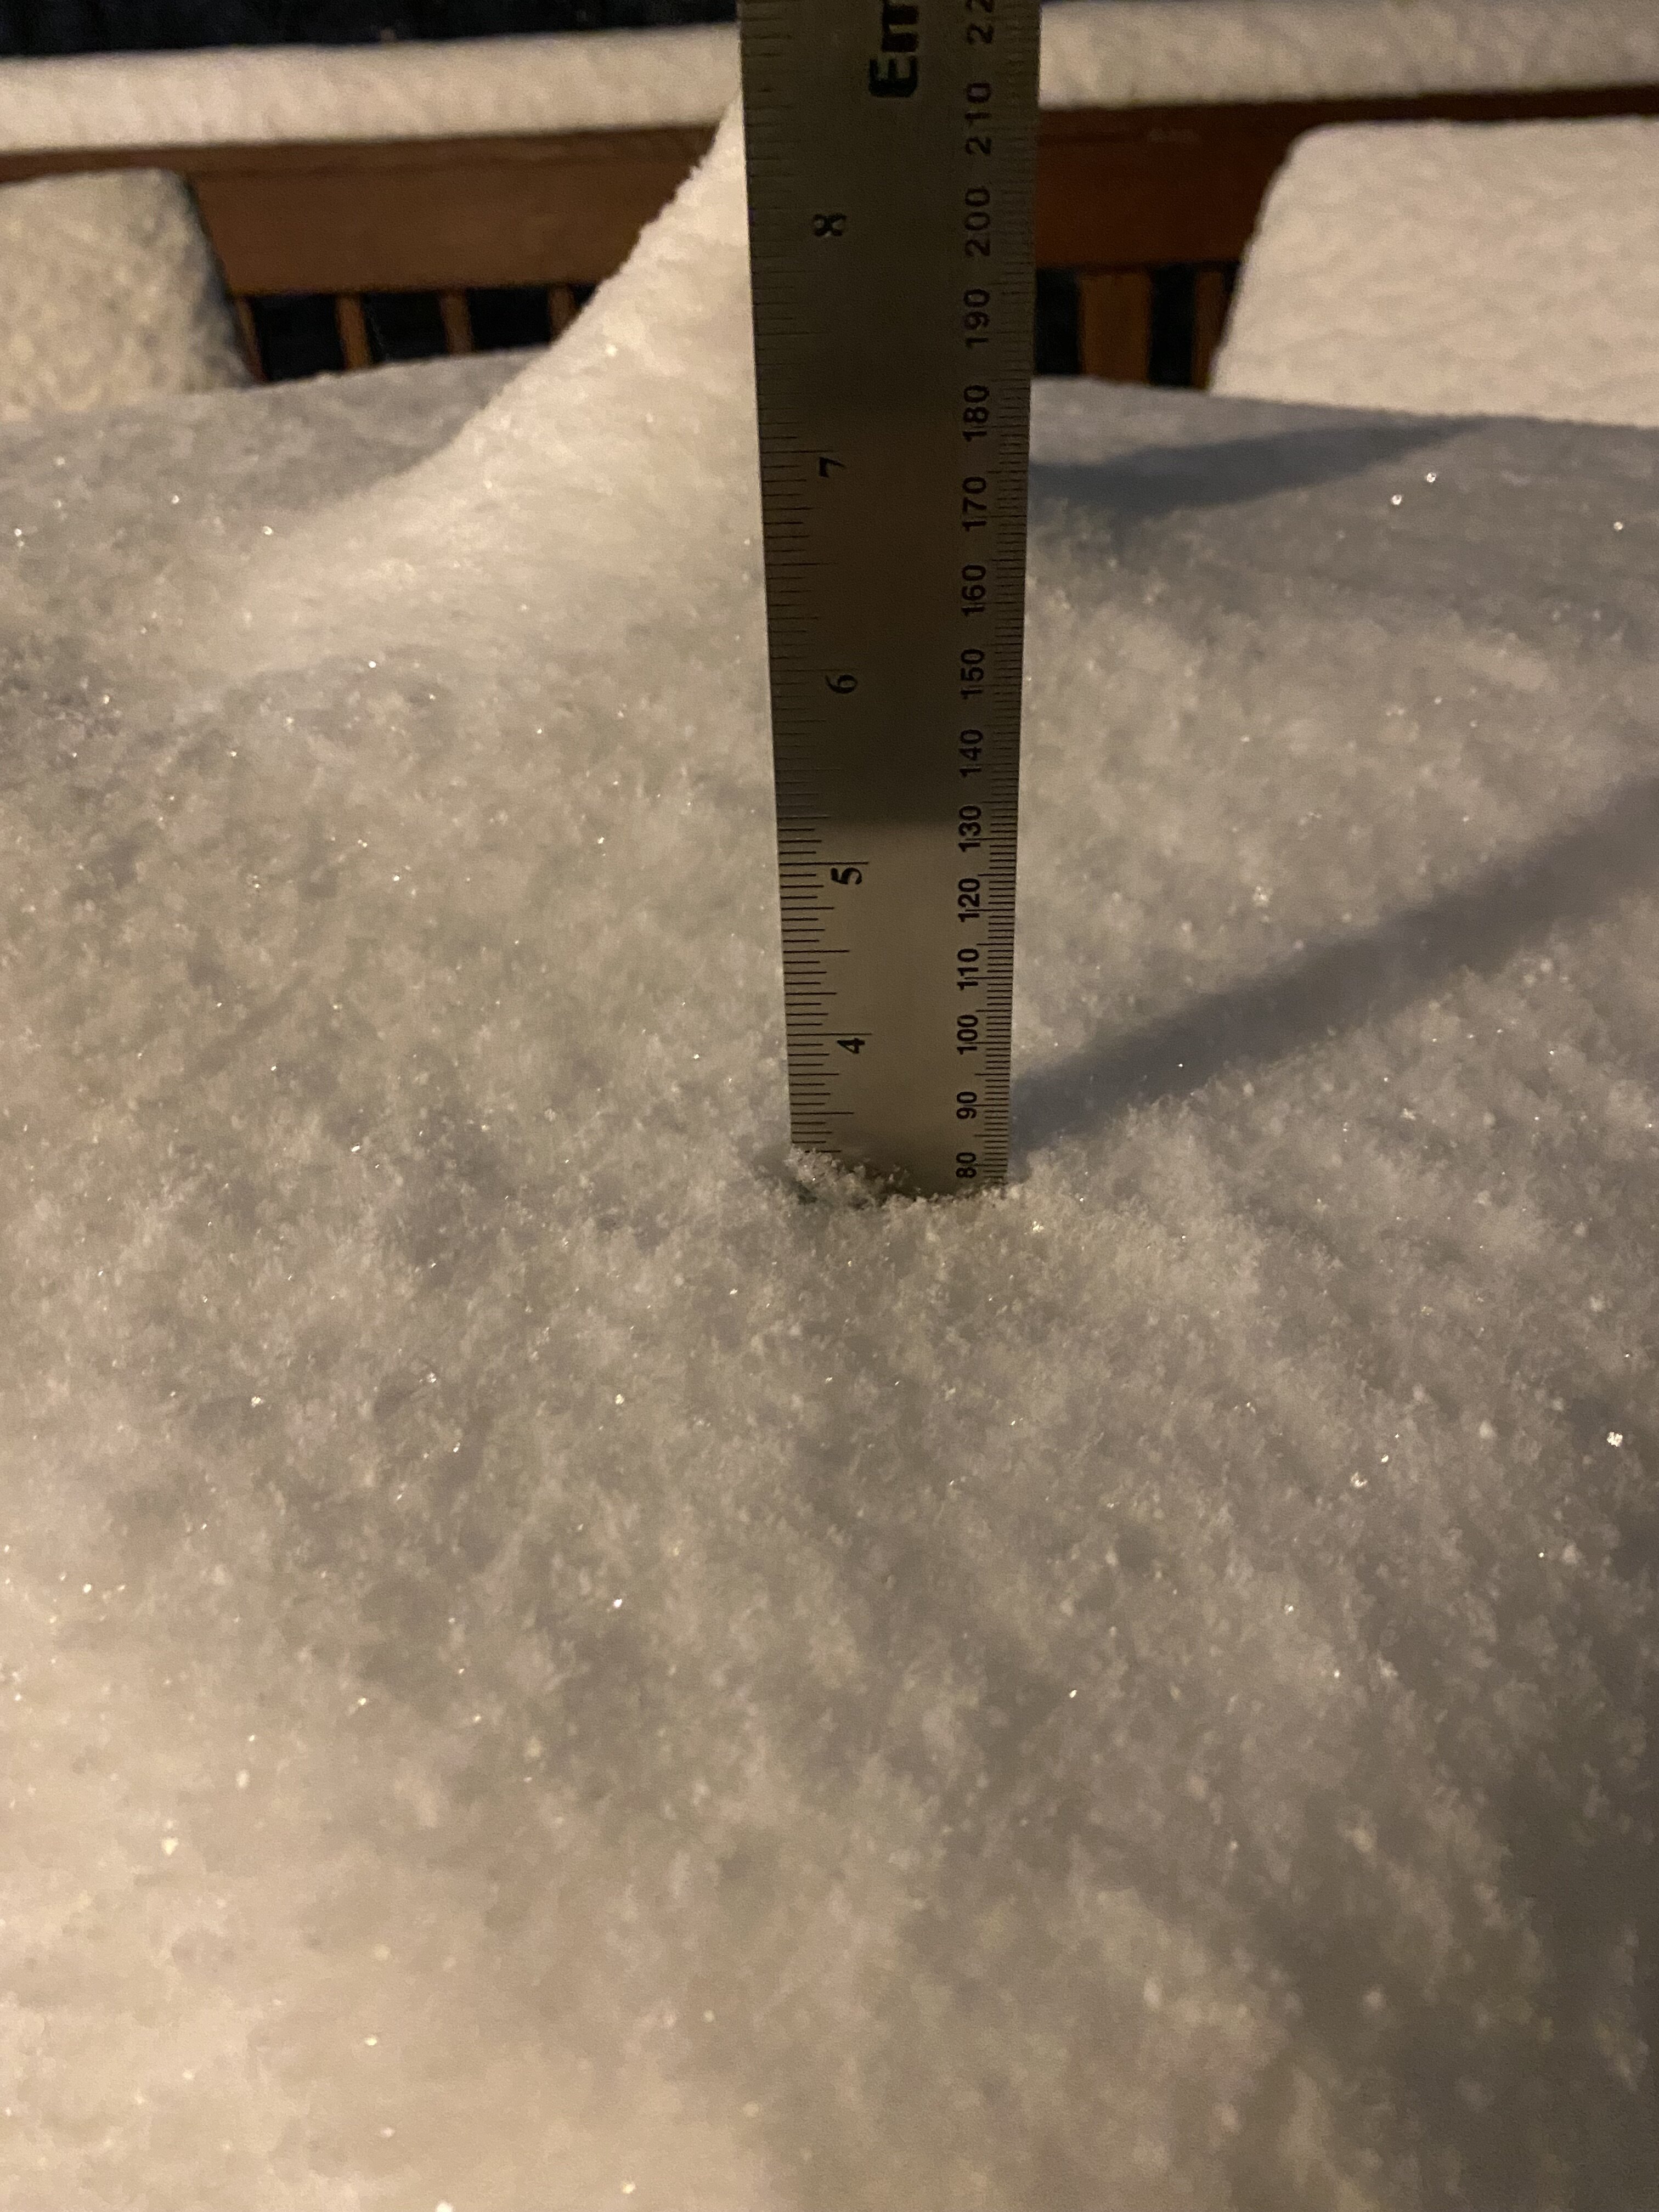
Lol i’m commenting on the aesthetics of it. Technically, yes that’s my total for this week. 4.8” + 3.3” is over 8” but more like 6” with compaction
-
Beautiful out there. Looks like it just snowed 8 inches
-
Light snow starting again
-
Just might. Looking at radar, i’d say 50/50
-
If this upper level energy is legit and the pivot stays south of 66, I might beat the first event. Wouldn’t that be quite the surprise considering earlier trends this week! But we will see. It’s a high bar to clear
-
I like that
-
Just went out to get an exact measurement and got at least 3.3” freezing drizzle mixed with pixie dust
-
Last I measured 3” but that was about half an hour ago
-
Light pixie dust under one of those subsidence areas
-
Stopped here, just a few light flakes for now. Think its temporary before things start up again
-
Radar over KY/WV looks juicy. Upper level stuff must be good
-
Checked that, definitely some back building along and just south of 66
-
Light snow, small flakes. Ratios probably high
-
Oh snap!
-
And seeing some light returns SW of front royal too
-
Yep. It’s going to be close for me though
-
Roads haven’t caved in Georgetown yet
-
Smaller flakes now, but coming down at a decent clip
-
Signs of back building

-
Saw that. I’d like that to be a bit further south so I can catch the pivot