Terpeast
-
Posts
6,687 -
Joined
-
Last visited
Content Type
Profiles
Blogs
Forums
American Weather
Media Demo
Store
Gallery
Everything posted by Terpeast
-
Jan/Early Feb Medium/Long Range Discussion Part 3
Terpeast replied to WinterWxLuvr's topic in Mid Atlantic
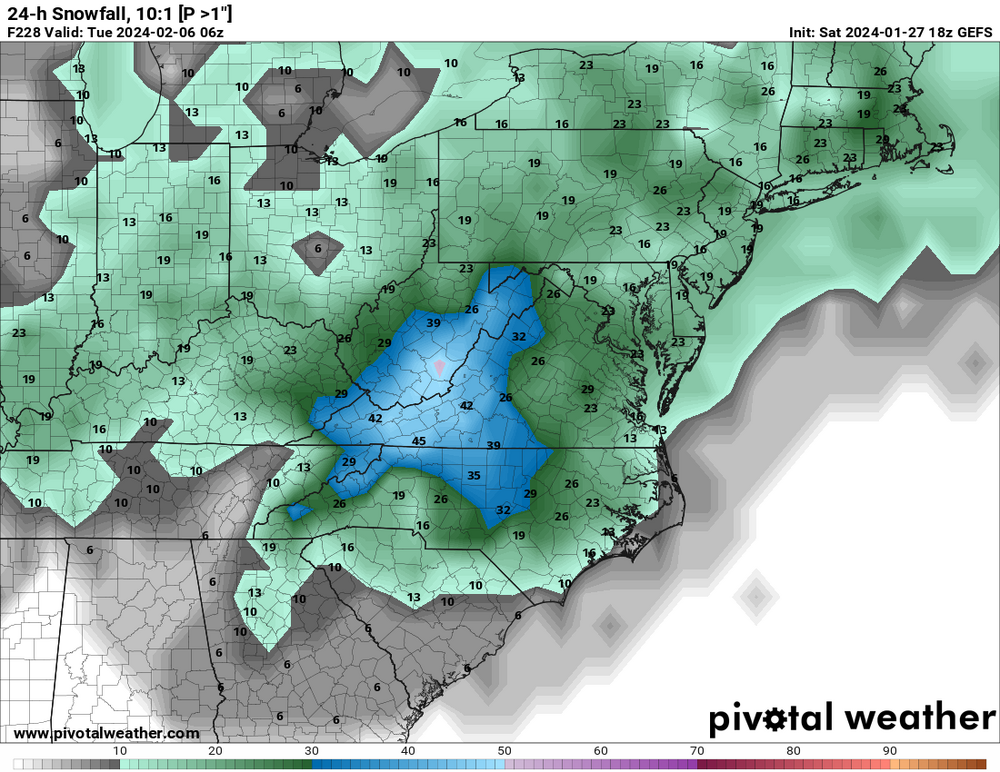
Good posts @Blizzard of 93 and we still have a chance on Feb 3-6 before the transient ridge, before the SW trough undercuts again -
Jan/Early Feb Medium/Long Range Discussion Part 3
Terpeast replied to WinterWxLuvr's topic in Mid Atlantic
Two weeks out. Relax. -
Jan/Early Feb Medium/Long Range Discussion Part 3
Terpeast replied to WinterWxLuvr's topic in Mid Atlantic
He was complaining about the torch 2 weeks ahead while it was snowing. All he had to do was look out the window? -
Jan/Early Feb Medium/Long Range Discussion Part 3
Terpeast replied to WinterWxLuvr's topic in Mid Atlantic
I had to do a double take to realize that this wasn’t Ji -
Jan/Early Feb Medium/Long Range Discussion Part 3
Terpeast replied to WinterWxLuvr's topic in Mid Atlantic
FYI
-
Jan/Early Feb Medium/Long Range Discussion Part 3
Terpeast replied to WinterWxLuvr's topic in Mid Atlantic
Oh that’s 9-10 days away. Pace yourself bro, we got a marathon coming up -
Jan/Early Feb Medium/Long Range Discussion Part 3
Terpeast replied to WinterWxLuvr's topic in Mid Atlantic
Which one are you tracking? -
Jan/Early Feb Medium/Long Range Discussion Part 3
Terpeast replied to WinterWxLuvr's topic in Mid Atlantic
Straight from the weenie handbook: “right where we want it at 10 days out”? -
Jan/Early Feb Medium/Long Range Discussion Part 3
Terpeast replied to WinterWxLuvr's topic in Mid Atlantic
I like that clustering off the NC coast -
Jan/Early Feb Medium/Long Range Discussion Part 3
Terpeast replied to WinterWxLuvr's topic in Mid Atlantic
Not much. You’ve been all over this for a week now. It’s something to track for now -
Jan/Early Feb Medium/Long Range Discussion Part 3
Terpeast replied to WinterWxLuvr's topic in Mid Atlantic
He’s got zero credibility at this point. Just like JB always calling for cold, and warminstas cherry-picking torch patterns. -
77.5 for the high. Took advantage by going out for a run
-
High of 78 imby, still time
-
Making a run for 80, wow this is insane. 75 now
-
Feel better. I just had a bout of covid but luckily it wasn't a hard hitter like my first time.
-
Jan/Early Feb Medium/Long Range Discussion Part 3
Terpeast replied to WinterWxLuvr's topic in Mid Atlantic
Both storms look weird. Straight down from north and then back up the coast. Not sure I've seen an evolution like that and it actually resulting in snow for us -
Jan/Early Feb Medium/Long Range Discussion Part 3
Terpeast replied to WinterWxLuvr's topic in Mid Atlantic
For what dates? -
Low of 55, now 65/64 Looks like 70 is in play
-
Jan/Early Feb Medium/Long Range Discussion Part 3
Terpeast replied to WinterWxLuvr's topic in Mid Atlantic
Phase 7 in ninos is when KUs start as a wave in the pacific. FWIW -
All because some woman was upset she missed her stop and attacked the driver. Initial reports indicated that the bus had swerved to avoid an oncoming vehicle; however, footage recovered from the bus shows that a female passenger had attacked the driver, who retaliated.[2] Local police have said the fight was the cause of the crash. Police said in a statement that the pair began arguing when the driver refused to let her off the bus after she missed her stop. The footage shows the pair gesturing at each other before the woman hits the driver in the face with her mobile phone.[1][3] https://en.wikipedia.org/wiki/2018_Chongqing_bus_crash Savage.
-
Jan/Early Feb Medium/Long Range Discussion Part 3
Terpeast replied to WinterWxLuvr's topic in Mid Atlantic
Yep, I was here visiting my mom for Jan 2016. But I didn't post much here because I was going through some personal stuff (a divorce) I did enjoy the storm, we got about 30" -
Jan/Early Feb Medium/Long Range Discussion Part 3
Terpeast replied to WinterWxLuvr's topic in Mid Atlantic
Agree. Droolworthy. If this H5 anomaly map verifies for a full month, and we don't get a HECS - or at minimum - a top 10 KU, I would be disappointed. Very disappointed. -
Jan/Early Feb Medium/Long Range Discussion Part 3
Terpeast replied to WinterWxLuvr's topic in Mid Atlantic
El Nino -
Jan/Early Feb Medium/Long Range Discussion Part 3
Terpeast replied to WinterWxLuvr's topic in Mid Atlantic
STJ going wild -
Jan/Early Feb Medium/Long Range Discussion Part 3
Terpeast replied to WinterWxLuvr's topic in Mid Atlantic
Agreed. That map Ji posted looks like 2022-23. I wasn’t joking about planning a trip out west.