Terpeast
-
Posts
6,687 -
Joined
-
Last visited
Content Type
Profiles
Blogs
Forums
American Weather
Media Demo
Store
Gallery
Everything posted by Terpeast
-
By red flag you mean too much of a good thing? I tried checking the 48hr 500mb trend on TT but it won’t show it
-
Maybe he’s right. But it’s always been showing a cutter, as is the Euro currently. We’ll see if gefs is out to lunch or is onto something here
- 2,509 replies
-
- 1
-

-
- weenie fest or weenie roast?
- weenies got roasted
- (and 2 more)
-
Have to say gefs has trended south for feb 14 the last several runs, so that is an interesting development. Not on board yet, but I am now watching this one instead of disregarding it as a cutter
- 2,509 replies
-
- 8
-
-
- weenie fest or weenie roast?
- weenies got roasted
- (and 2 more)
-
I think 2/13-14 was always going to be a cutter that brings about the pattern change, not one of the waves of interest AFTER the cold gets here
-
Low of 27 this morning. Wife heard the birds chirping outside. She said "winter's over", and I responded "I don't think it's over yet." I hope I'm right, so I can say "I told you so"
-
Yeah, this year is the best year to swing for the fences. But keep in mind we have had couple of near misses. One in Jan 7, which had temperature issues and a track too inland. Couple degrees colder, it would have been a warning-level SECS maybe a low-end MECS. I was pretty disappointed in that one, and led me to lower my expectations a smidge. Another one was when Nova Scotia got pounded recently. This wasn't a "synoptic miss" in the sense that the track was 200 miles too far south, or a "mesoscale miss" with best banding 50 miles too far north... this was a planetary wave miss of about 500 miles (which isn't much at that scale) as I mentioned earlier. Move that omega block 500 miles west, and get the NS wave to dig in the tennessee valley, and we'd have gotten that HECS.
-
It’s not just Nina, but the QBO will likely go back positive, and we might have maxed out on solar and start the descending cycle then. Purely based on these variables, I’m not optimistic except for a winter trip out to Whistler. Sure we can get lucky with one storm like Jan 2022. But that’s all a year way. Back to your regularly scheduled pattern change tracking.
-
Put this way. If it can snow significantly in March like 2014, 2015, 2017, 2018 and 2022 (and multiple years pre-2014 notwithstanding), then it almost certainly snow big enough to surpass climo by a big margin in late Feb through the first week of March.
- 2,509 replies
-
- 2
-
-
- weenie fest or weenie roast?
- weenies got roasted
- (and 2 more)
-
I’m not all that worried about BN precip, because if we’re on the north side and when its cold, we can still get a decent snowfall out of it without any mixing issues. HECS? Maybe not, but something that gets us to climo before we get another shot end of feb-early march. Still can have a wave miss us to the south, and if it does, it is what it is. There will be multiple shots.
- 2,509 replies
-
- 7
-
-
- weenie fest or weenie roast?
- weenies got roasted
- (and 2 more)
-
Surface temps only matter during precipitation events. I only look at 850mb temp anomalies at range, since those tell us where the anomalously warm and cold airmasses are or are going. Saying that surface temps are warmer than 850 temps as far as anomalies go is a bit misleading, though. This would hold true if it’s a bright sunny cloudless day, especially with no snowcover, when you could have cold 850mb temps but with dry adiabatic mixing you’ll probably reach average or even slightly above at the surface. But if it’s dry and sunny, who cares. Take the same 850mb temps during a precipitation event, you’re almost certainly getting snow. That’s when we’d check the sfc temps, or better, the soundings. The poster who said that may be a good researcher, but he conveniently left all of the above out.
- 2,509 replies
-
- 10
-
-

-
- weenie fest or weenie roast?
- weenies got roasted
- (and 2 more)
-
It was a Flop... February 2024 Disco. Thread
Terpeast replied to Prismshine Productions's topic in New England
And maybe we’ll get what Nova Scotia just got -
I don’t know if you guys realize this but we just had a close miss. This could have been us if the omega block was displaced 500 miles west. (It was that weird clipper that dived from the NW and it was DOA when it got here, but it went nuclear as soon as it went neg tilt before Nova) At least we have another shot later this month
- 2,509 replies
-
- 6
-
-
- weenie fest or weenie roast?
- weenies got roasted
- (and 2 more)
-
Nova Scotia crushed. 5 feet and more on the way https://x.com/ChuckWrathall/status/1754248252810047560?s=20 Had that Big Omega block been placed 500-600 miles west, this could have been us (DC to Boston) 500 miles is a very close miss in the global scheme of things…..
-
Good theory, which may well be tested next winter. But I don't think a super nina will help with the west pacific warm pool. The trades will just concentrate all those warm waters and push down the thermocline even deeper. Then it'd be hard for even cloudiness and convection to cool those waters, even if it sustains itself long term.
-
Yeah, I don't think he deserves any credit. He was saying 2.3 for so long, and there's always the "broken clock is right twice a day" thing. Just like I was off on the ONI prediction and my call for an early peak. It peaked much later, and I was about 0.2 too low. But I based my outlook on the MEI, which last I checked was 1.1. I still don't know if the MEI is a good seasonal forecasting tool though, maybe RONI is better.
-
Yeah, that's a stronger MJO 8 signal. Normally, I want it weaker and inside COD. But in this case, we don't want it to collapse into COD and then reemerge into the warm phases. So for this year, we want it to stay stronger as we circle through the cold phases. It may not contribute to giving us deep arctic air, but we don't need it to get that cold even in late February.
- 2,509 replies
-
- 1
-
-
- weenie fest or weenie roast?
- weenies got roasted
- (and 2 more)
-
At this point I’m wondering if the Feb 19-20 system is just the appetizer for the next one. We might get something from it, or at least reinforce the cold air from that point on
- 2,509 replies
-
- 3
-
-
- weenie fest or weenie roast?
- weenies got roasted
- (and 2 more)
-
The only way we stay dry is suppression, and suppression will only happen if the waves passing by are weak/sheared, or if we have a record breaking block over central/south Canada as is the case for feb 5-6. I don’t buy it with the eps look brooklyn posted
- 2,509 replies
-
- 4
-
-
- weenie fest or weenie roast?
- weenies got roasted
- (and 2 more)
-
Either it means the eps is right and we stay dry, or it just hasn’t picked up on the signal that gefs/geps already has. I’m thinking the latter is more likely.
-
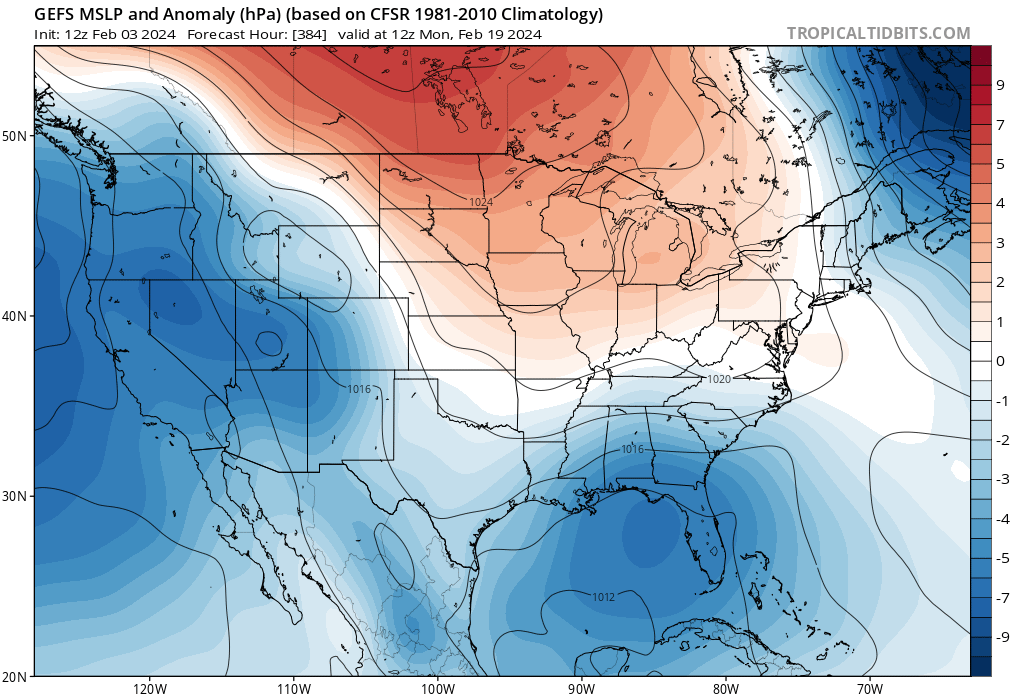
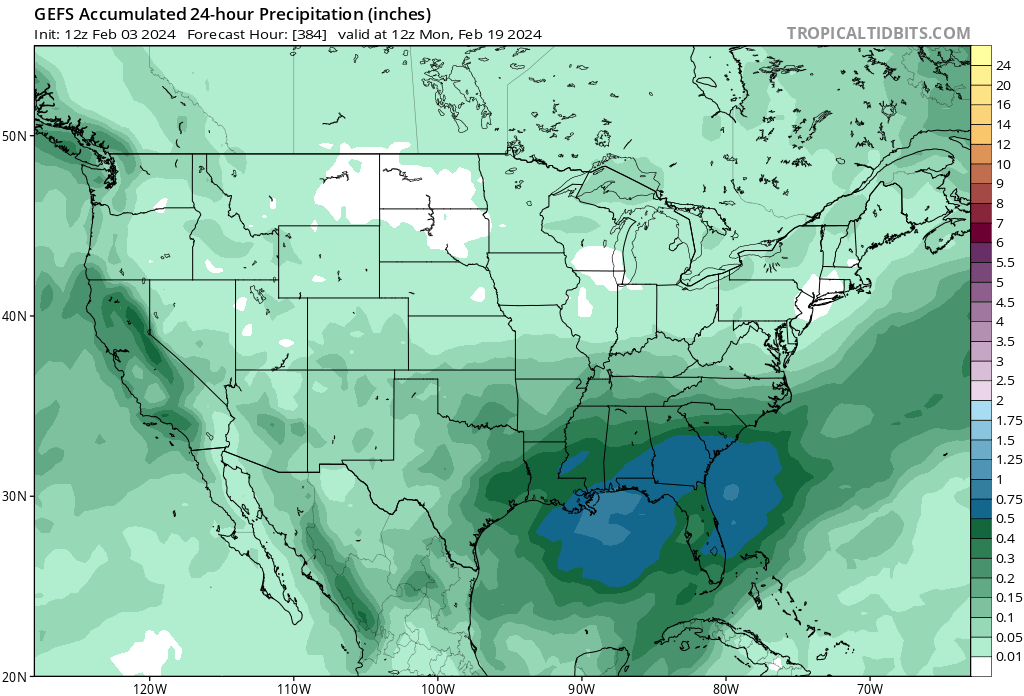
MSLP anomaly plots show a signal feb 19-20 per 12z gefs. GOM low forming. Geps also shows this, but more muted
- 2,509 replies
-
- 3
-
-
- weenie fest or weenie roast?
- weenies got roasted
- (and 2 more)
-
Not worried about suppression for now. Storm tracks almost always shift further north as they get closer (as long as there isn’t an omega block right over us). Sure someone may get hit in NC or even northern SC in one of those threats, but the primary storm track won’t set up that far south.
- 2,509 replies
-
- 4
-
-
-
- weenie fest or weenie roast?
- weenies got roasted
- (and 2 more)
-
Case in point, take away that 80 degree day would lower our Jan average by at least a full degree. We’d have been closer to average
- 2,509 replies
-
- 5
-
-
- weenie fest or weenie roast?
- weenies got roasted
- (and 2 more)
-
Yeah, like I said I’d be disappointed but happy about that mid-Jan wintry week. Both my phone and laptop has 100s of photos and reels to carry me through next winter, which at the moment I consider cancelled.
- 2,509 replies
-
- 5
-

-
- weenie fest or weenie roast?
- weenies got roasted
- (and 2 more)