
Holston_River_Rambler
-
Posts
5,560 -
Joined
-
Last visited
Content Type
Profiles
Blogs
Forums
American Weather
Media Demo
Store
Gallery
Everything posted by Holston_River_Rambler
-

TN valley heavy rain/flooding week of whenever
Holston_River_Rambler replied to janetjanet998's topic in Tennessee Valley
Big blocks being advertised by the Euro to develop across the N. Hemisphere. Hopefully if that happens they can effect some change in the pattern. But, as with all things this winter, 8 - 10 days. Looks like it might be snowy in N. Africa though. -
TN valley heavy rain/flooding week of whenever
Holston_River_Rambler replied to janetjanet998's topic in Tennessee Valley
Yeah the bad part about this is that out current forecast period ends when a pattern like this is starting to become climatologically (at least in my experience) favored for this area. -
TN valley heavy rain/flooding week of whenever
Holston_River_Rambler replied to janetjanet998's topic in Tennessee Valley
0z Euro still with widespread 6 - 7.5" through TN and Ohio watersheds. Some areas 8+. WPC basically sums it up. And that discussion above as well. Just amazing how wide the 7 - 10 inch field is. Weathertree I think janetjanet mentioned that a run of the GFS yesterday broke the pattern down, but (janetjanet can correct me if wrong) I took that as just a hopeful mention of what that model depicted as a way out of this awful pattern. 6z GFS is back to this; Basically GFS think we are one of the most soaked places on earth over the next 15 days. Good news is that it's just one run of the GFS. That being said, the 0z Euro really flattens the jet after day 7-8 and that would help a lot. Maybe not totally shut off precip, but at least stop this training mess. The Euro control (Euro itself run at slightly lower resolution), keeps it coming though, but with a slightly more suppressed flow. -
TN valley heavy rain/flooding week of whenever
Holston_River_Rambler replied to janetjanet998's topic in Tennessee Valley
EPS with aims the highest QPF mean into N. Alabama as of 12z today. 8-9 inch mean into N. Alabama and 7 - 8 inch mean into N. GA. -
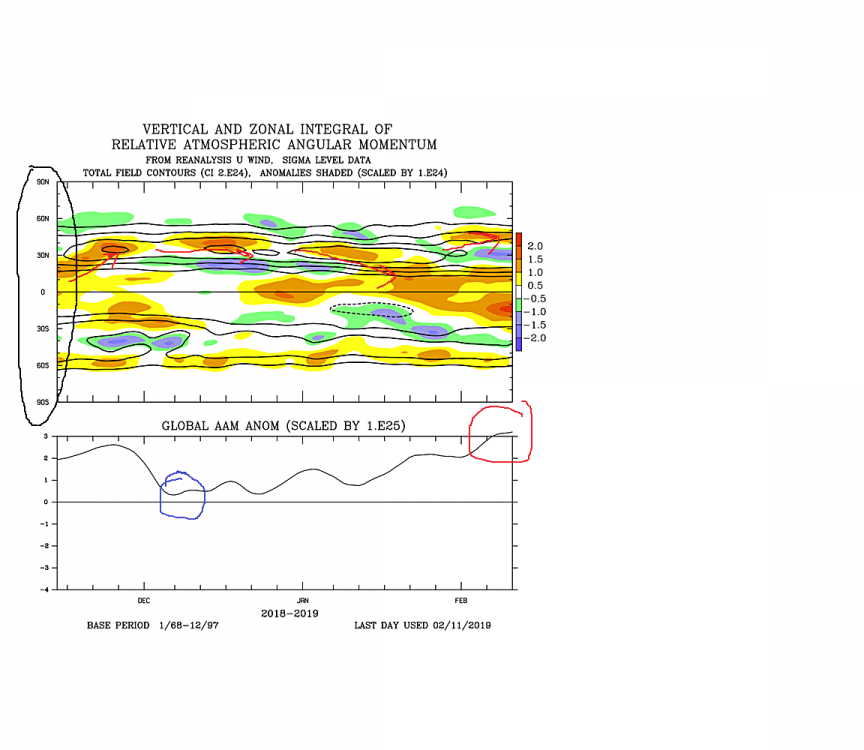
@AMZ8990 Sorry for taking a while to get back to you. I'm putting this response in here because I'm still trying to learn about this stuff too and welcome any thoughts. As I understand it, AAM (Atmospheric angular momentum) is a measure of the momentum of the atmosphere across the globe at all latitudes at a given time. Sort of like where the most umph is and where it is aimed in latitude and whether or not it is westerly (+), or easterly (-) (yellows and oranges/ blues and greens respectively in the image attached). The earth is a solid object, surrounded by a fluid (atmosphere). That fluid rotates with the earth, but the sloping surfaces and mountains and just plain old fluxes and ebbs embedded in it can change over time and impact the state of flow in the atmosphere (its momentum) and importantly for us, high latitude blocking. For example. this year, from Dec - Feb the + momentum was aimed from the equator toward the pole in the N. hemisphere (orange arrows in the image, latitude markers circled in black on the left). More momentum aimed that way, at least as I think I understand it, would lead to less chances to block things up at high latitudes. It looked like that was changing, but it is now back. There are also two ways to measure it: relative and total. Notice the total in this image is currently off the charts. Also notice that total was relatively low back when we got our Dec storm. I don't understand it much more than that and used it in my speculation earlier only in the sense that it was aimed back toward the equator at that time. Its certainly just on piece of the puzzle and I really don't understand how to use it right now more than to say "oh look, it's changing and "X" expert said that's good" so still a ways to go for me. Here is a nice .pdf I found, but the mathematical side is currently over my head. But then again I've never seen anyone show their work, so to speak, when using AAM charts to make a pattern point, so I suspect there is just more meteorological depth to using these charts than I currently understand. https://uol.de/fileadmin/user_upload/icbm/ag/physoz/download/cl_dyn/ang_mom.pdf
-
always wondered what these were called:
-
- 292 replies
-
- 2
-

-
- garden
- vegetables
- (and 4 more)
-
Alright severe people, I'm coming over to play for a week or two. I have access to all these fancy maps and nothing to use them on for now. What would you like to see? I really don't know what to look for in terms of severe weather, so let me know. But if I'm going to post Kuchera snow maps for winter folks, may as well most CAPE/ shear/ K index (whatever that is, but think has something to do with severe) maps too. Euro Surface CAPE: Euro Deep Layer Shear: Euro K Index: Here are other Euro products I have access to, but don't know what half of them mean:
-
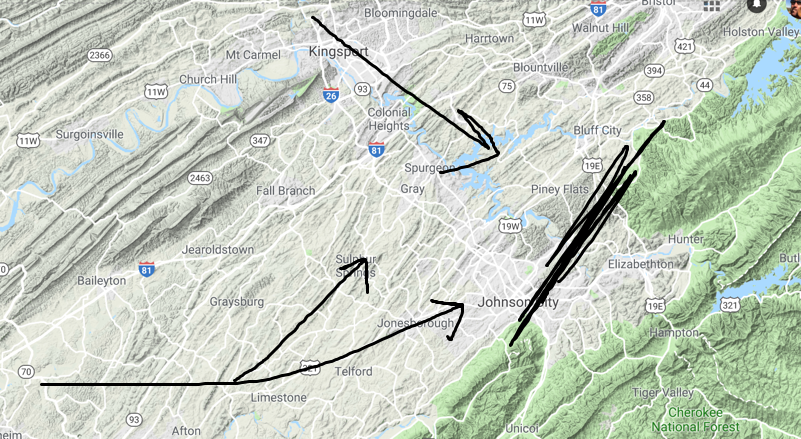
The following image is from the paper “Wind Regimes in Complex Terrain of The Great Valley of East Tennessee“(Birdwell). The research used surface wind data from several locations to examine how the area’s complex terrain alters the regional wind flow. The graphic labels a convergence zone resulting from the features you identified earlier today. Near surface winds through the gap (during WNW-NW flow) have more of a westerly component, while winds around the northern part of the barrier have a more northwesterly direction. This convergence on the lee side of the mountain range triggers vertical motion in the valley and could have aided in the formation of the snow band from earlier today. As you also mentioned, this band is likely enhanced east of Knoxville due to lift from the WNW flow interacting with the terrain in the eastern part of the valley I've noticed that band several times over the years. It's nice to have a plausible explanation for it. That's an awesome dissertation. Thank you for that. I didn't realize someone had put so much time into the wind regimes of the Great Valley. Based on what you said above, I think I have a speculative explanation for the Bays Mountain band. Forced low level flow funneled between the Smokies and Bays Mt/ Chimney top in Greene county (you can see that on the satellite image), meets NW flow less inhibited coming around the NE flank of Bays Mt. Lift provided by the up valley flow, convergence, and overall trajectory of everything towards the higher mountains to the SE. You might also be able to argue some of that flow continues on to Boone, through relative gaps between Buffalo and Holston Mountains, the NE flank of Roan, and ends up aimed at the ski resort areas there and Boone.
-
Yes, I have summoned you! But in all honesty, would it be any worse than Flora or Heath or Jimbly-bob, or whatever the Weather Channel goes with? Maybe Old Gregg?
-
#Grumpycat
-
Have a buddy in Wetumpka, AL. Tornado hit 3 blocks from his house.
-
Potential Vorticity and water vapor imagery http://rammb.cira.colostate.edu/wmovl/vrl/tutorials/satmanu-eumetsat/SatManu/Basic/Parameters/PV.htm
-
Found a nice discussion of AAM (Atmospheric Angular Momentum, a teleconnection you sometimes see mentioned) and what we want to see: https://www.33andrain.com/topic/868-teleconnections-a-more-technical-discussion/?page=29&tab=comments#comment-115404 Maybe not the best description of exactly what constitutes AAM, but if you've ever looked at one of those AAM diagrams and wondered what we want to see for more amplification, this will help.
-
Been looking for an example of this for a while: Mostly using this for an example of what a Rossby wave train/ break is, but the conversation at the link has some interesting discussion of its implications for the SPV if interested.
-
Finally found the site that has all the neat stratosphere prog maps I've been seeing in different places. https://stratobserve.com/tht_pvstr_maps
-
A collection of realtime charts, some hard to find like AAM and GWO: http://atlas.niu.edu/ I'm not sure how to read some of this yet, but thought some might find it useful.
-
Found a new toy for past MJO( some of you may already have this) : http://www.bom.gov.au/climate/mjo/graphics/rmm.74toRealtime.txt
-
Found a really nice interactive website with lessons from NWS that breaks down how to read charts from the surface, up to 200mb. It even explains the cryptic Omega in a pretty easy to understand way. https://www.weather.gov/jetstream/constant_intro The same site has several other categories if you click on the drop down "Topics" menu.
-
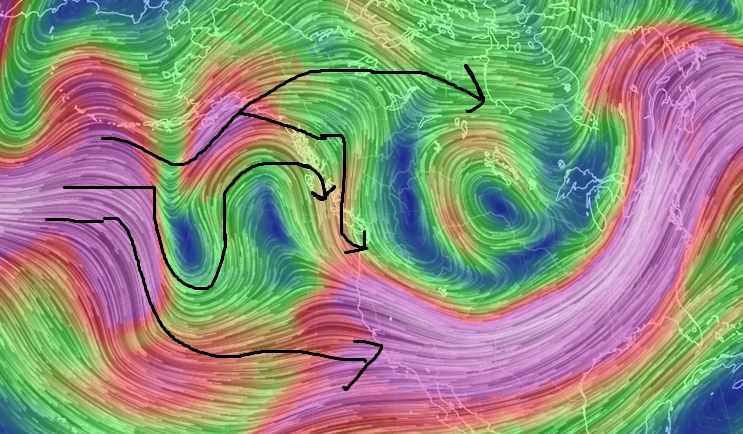
There's definitely a split there, but I've found when most people reference the split flow, they are talking about the jet (250-300mb winds) over the Pacific. I have tried to show it on this image. (I may be wrong too, but thought I'd take a stab at it). Usually when it is depicted it is shown with very definite, long, and connected flows (split in the mid Pacific and one half going over a big ridge and the other undercutting it), but I think the jet is more variable than that as seen in my image. there are wind maxes, buckles, etc...
-
Found a nice website for N. Hemisphere info: https://yannickpeings.wixsite.com/nhatmosphere/copy-of-october-november-1
-
So... is the Modoki off the table @jaxjagman? Basin-wide moderate, or are things still in flux? Source of my question: Does Modoki vs. normal El Nino make that much difference for TN valley in the long run in terms of Winter pattern? Just heard so much about Modoki over the past years (not necessarily on here) and had my hopes up for something unusual this winter.
-
Found an interesting site from the University of Wisconsin with some non operation GOES 17 imagery: http://realearth.ssec.wisc.edu/?products=G17-ABI-FD-BAND01 Also, thanks to all for the good conversation lately (esp. Fall-Winter spec.), have been wanting to participate more, but swamped with work at this time. Although just catching up it looks like boring heat is the optimal word for now.
-
Looks like it's all trying to consolidate into a line now over the upper Cumberland plateau. Hopefully that puts and end to most of the tornado threat for those folks. No disrespect meant to any chasers in any way.
-
Cell in Monroe county, KY looks to be developing a hook. https://imgur.com/jomk03r


