eduggs
-
Posts
5,950 -
Joined
-
Last visited
Content Type
Profiles
Blogs
Forums
American Weather
Media Demo
Store
Gallery
Everything posted by eduggs
-
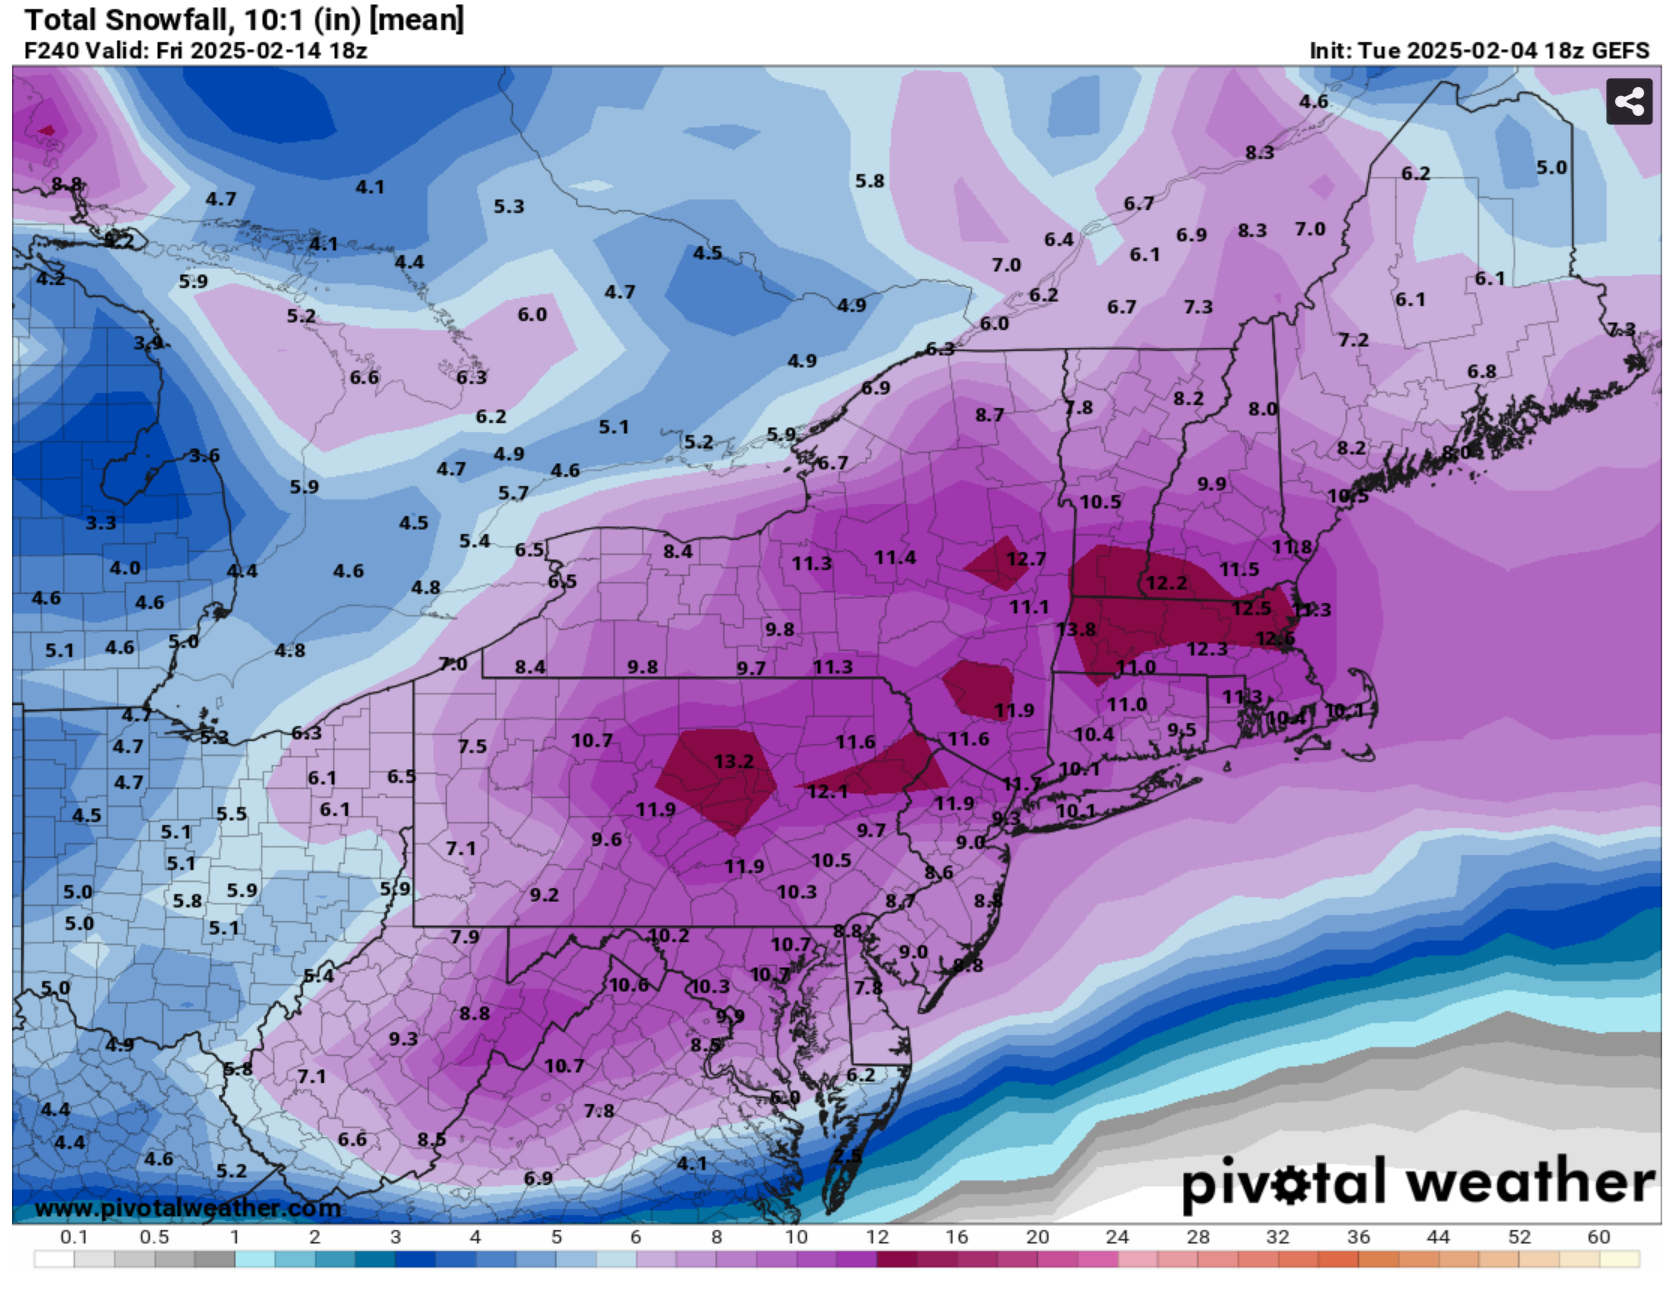
I expect the 0z GEFS to look snowy out to 10 days judging from the early panels. It's 2+ waves spaced out from Tue to Fri (plus a little bit Wed night and Sat night).
-
The prolonged moist SW flow on the CMC is a thing of beauty. A stronger shortwave trof would raise heights along the coast and bring warmth (and a stronger SLP). Weak waves with a shallow trof angle is perfect here. Simple overrunning with waves Gulf moisture is sufficient for big snow. The finale at the end of the CMC is too far out to mean much, but man I'm really liking that run. GFS and ICON are different as expected for days 5-9... but they're not completely at odds either.
-
I really like the 0z CMC evolution for next week. Not saying it's right - just that it shows how we could get big snow numbers. Ride the boundary from Tuesday all the way through Friday. We're almost perfectly on the edge of the steady moisture plume and just enough cold air the whole period. No intense SLP, but it's not needed. The run didn't show the huge snow numbers, but QPF could easy be underdone with that depiction.
-
The StormVistaWx maps have a glitch in the algorithm that tabulates snow. It's showing values about twice the actual data. This has been a problem forever. Why are they still being used/shown?
-
Well the full-run mean is about 9 or 10" so depending on the spread of members, 25% for 12" sounds about right. And the mean includes potentially multiple waves. The definition of HECS could be argued forever, but to me there is clearly a "signal" for a significant/major snowstorm next week. Nothing about it screams historic to me as this kind of output would be expected at this range maybe once or twice per winter on average. Since ensembles are run every 6 hours, only a fraction of the major storm "signals" are ultimately verified as major snow events... even fewer as historic.
-
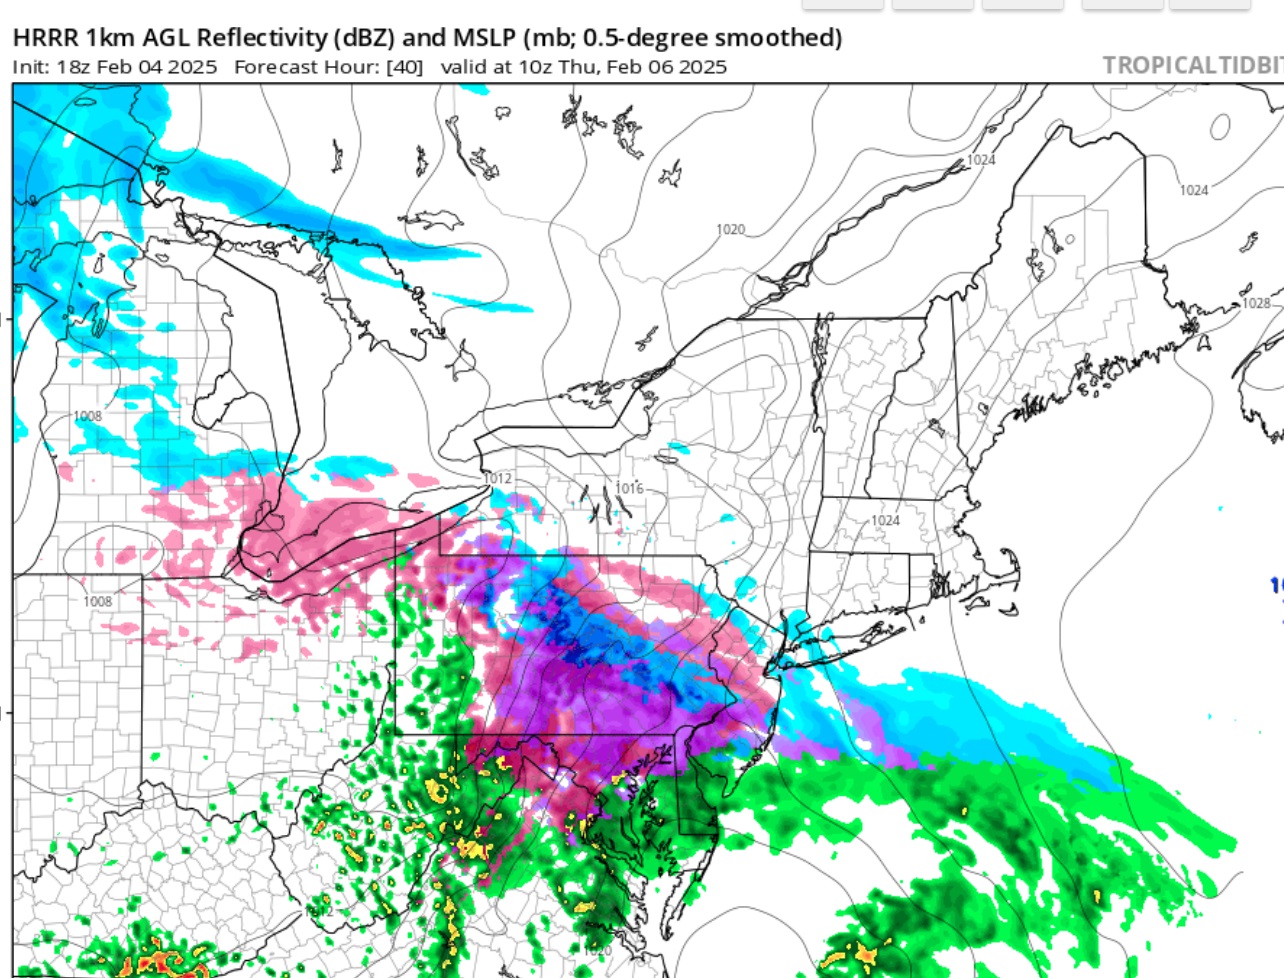
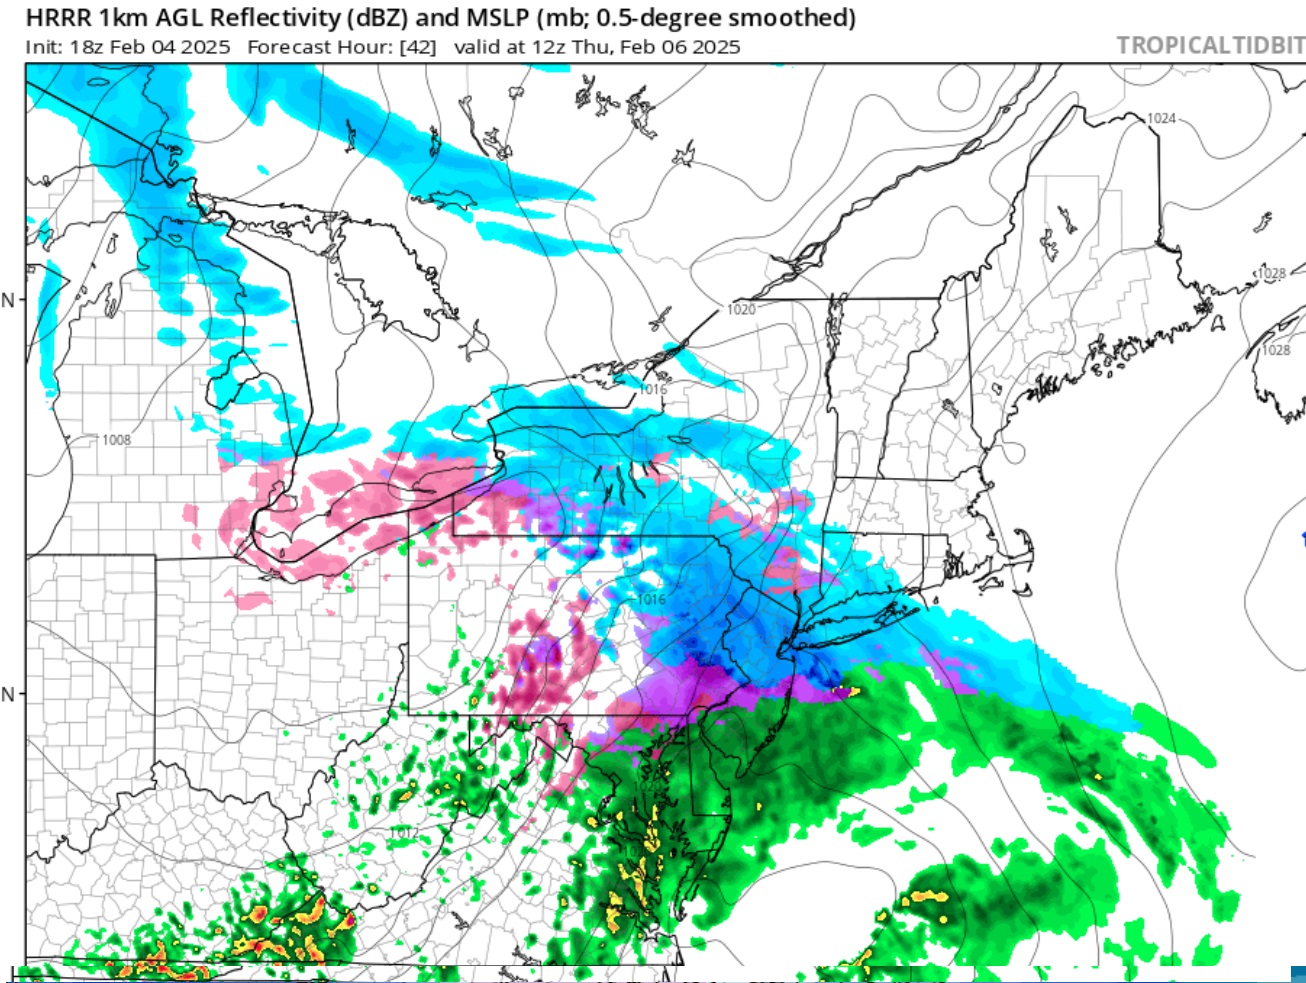
The 18z HRRR looks like classic dynamic cooling. The column initially warms enough for partial melting and sleet with possible mixed ZR. Then as precipitation intensity increases towards dawn, increased melting pulls heat energy from the air, resulting in cooling and a change back to snow. The 18z HRRR depiction would be great. Light snow moves in tomorrow evening with a 2-3 hour burst of mixed snow/sleet overnight and tapers off mid-morning as drizzle or freezing drizzle. General 1-3" from CNJ through NYC metro, LHV, and all of CT. Most areas outside of LI and the immediate shoreline never go to rain. Fingers crossed but I'm hedging lower on snow.
-
Do you really think you can correlate a continental-scale numerical index with a sequence of storms on the east coast of the US?
-
The 1.5" we got over a few hours Sunday night felt like a big deal. That's how far the bar's fallen in recent years.
-
It's funny how relative perception can be. I was away for the 3 days of cold and moderate snowstorm in January and my feeling about winter is that I keep waiting for autumn to end and winter to start. My missing the core of winter clearly colors my perception. I'm looking out my window at bare ground. The direct sun feels warm. Anytime the sun comes out the daily high temperature seems to reach at least 40. Some lakes and rivers are only partly frozen. I know statistically it's been a slightly colder than (recent) average winter, but from my little bubble it just hasn't felt like a real winter.
-
We don't know what's coming, particularly beyond day 10. Models could be far off with the longwave "pattern" and evolution they are advertising. The EC has one distinct snow threat out at the end of the mid-range. It also has a few minor snow threats before then. GFS and ensembles are similar but with timing differences. Depending on how shortwaves eject from the southwest US and interact with the longwave jet structure, there could be more than one "wave" of precipitation next week. I'm assuming next week will be our best shot of a big snowstorm this winter. I obviously don't know that for sure, but we can't count of anything past 10 days. Getting a good hit inside 7 days on multiple ensemble means is worth a lot more than mega blocking and fantasy storms 2+ weeks from now.
-
SWFE usually refer to cases with a surface high northeast of New England and an 850mb low passing to our northwest. In these cases, Cape Cod often stays frozen longer than our northern suburbs due to CAD or simply a warm front taking on a NW to SE orientation. If the 850mb passes to our south, it wouldn't typically be referred to as a SWFE. But I don't like the term, and again, it does not have a precise, scientific definition.
-
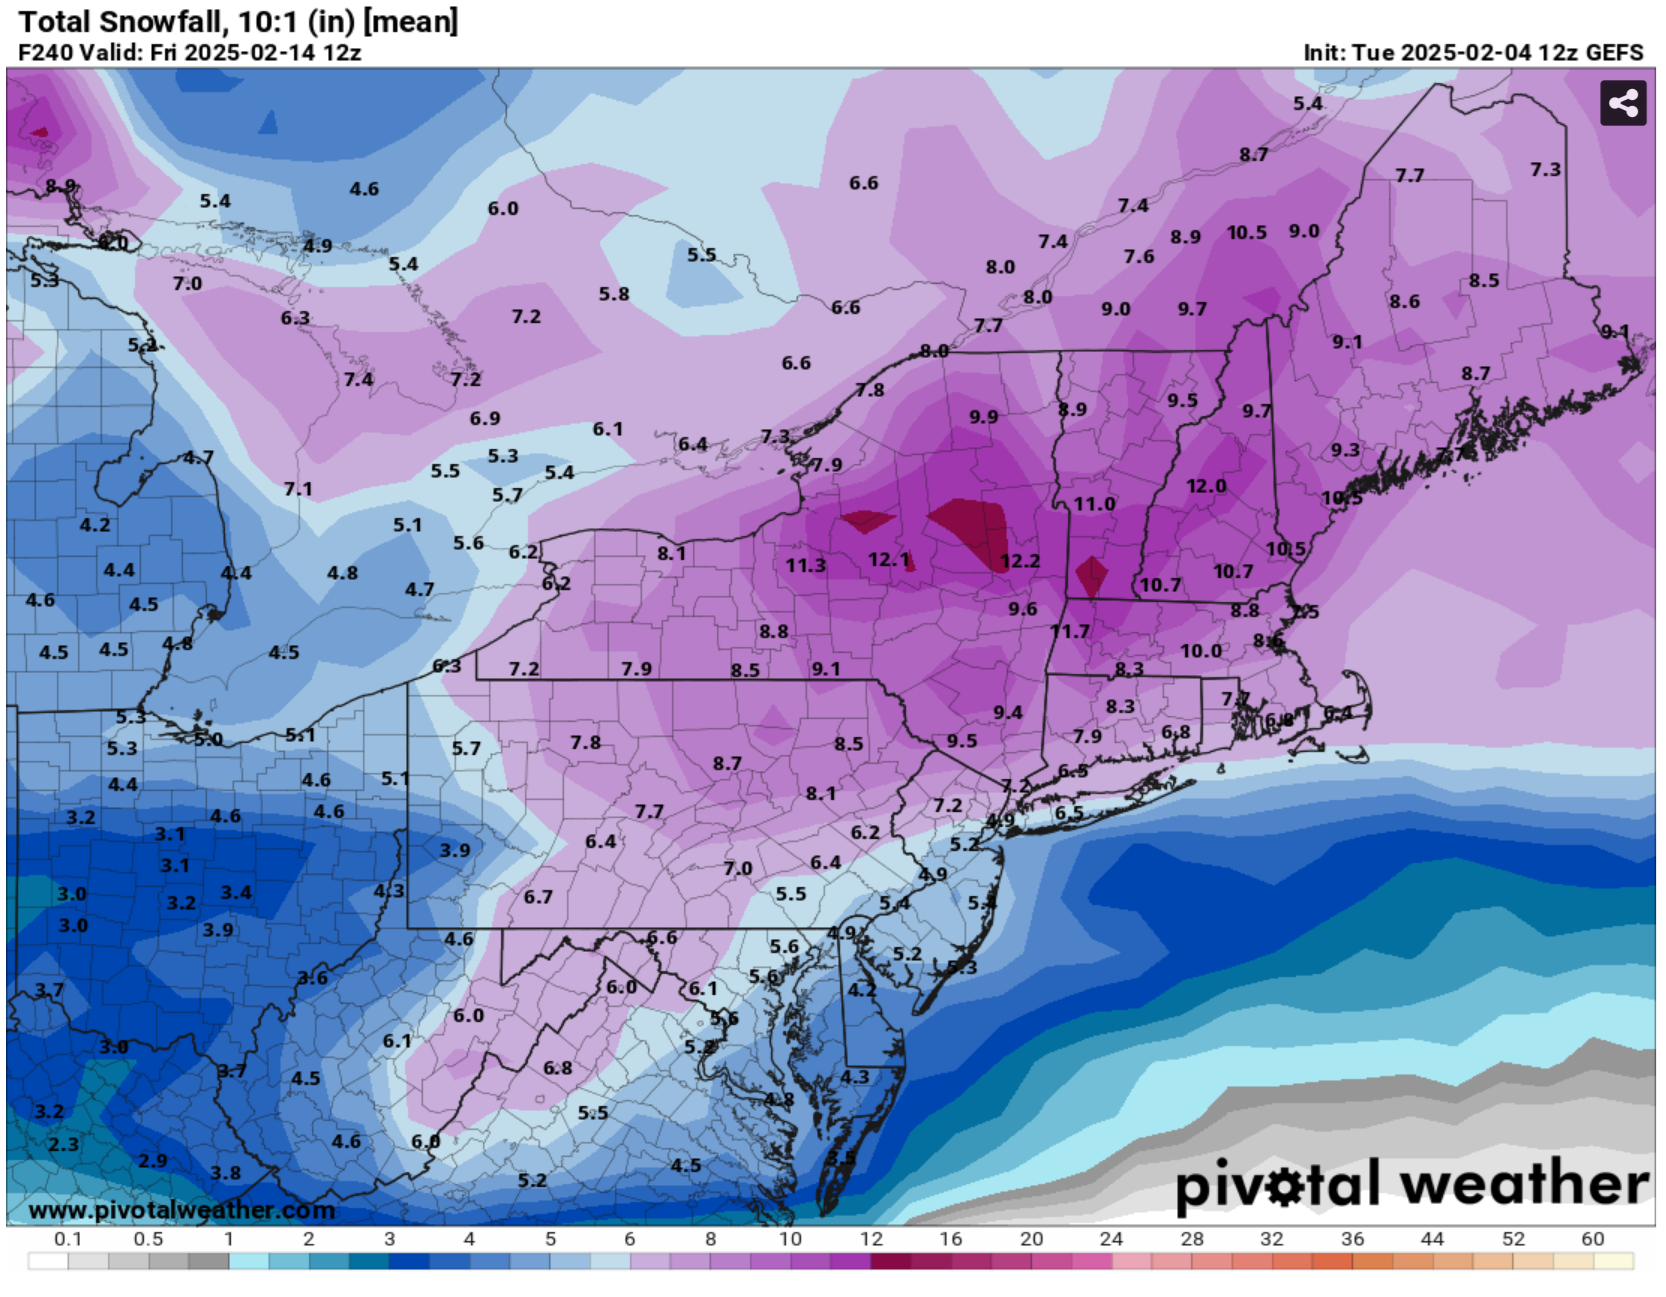
The 06z GEFS showed non-trivial precipitation for 7+ days starting Tue next week. But we shouldn't expect precipitation every day. Timing differences and multiple waves are spread out across an entire week of ensemble averaging. It will be very interesting to see how this evolves in the models... will be eagerly looking for continuity.
-
We're still seeing significant run to run changes in the long-wave jet structure for next week. I don't think we are anywhere close to pinning down even a basic overlay of next week's weather.
-
There's a pathway to a long duration wintry event next week. It's a fun look at this moment. But since it's still a week away I'm assuming reality will be something a little more common.
-
Ptype and dynamics of snow falling through a melting layer are more complicated that you would think: https://journals.ametsoc.org/view/journals/atsc/78/6/JAS-D-20-0353.1.xml Snowflakes don't instantaneously melt if the temperature is above freezing and the melting process cools the air, making it self-inhibiting. The NAM used to model these processes better than other guidance including the GFS. I assume it still does. But ptype involves meso- or micro-scale dynamics that aren't always accurately modeled at current model grid sizes.
-
Most of our wintry precipitation events exhibit southwest mid-level flow - particularly upper mid-levels (500mb). Actually our prevailing flow is SW. Only when there is a well defined mid/ULL will the flow wrap around to the NE. SWFE generally refer to the lower mid-levels or high lower levels - 700mb-850mb level plus/minus reflecting e.g., the 850mb low going west of us. SNE typically has more buffer to hold off the encroaching warm layers since 850mb lows cutting into WNY/PA tend to redevelop south of LI due to the land-ocean boundary and frictional effects.
-
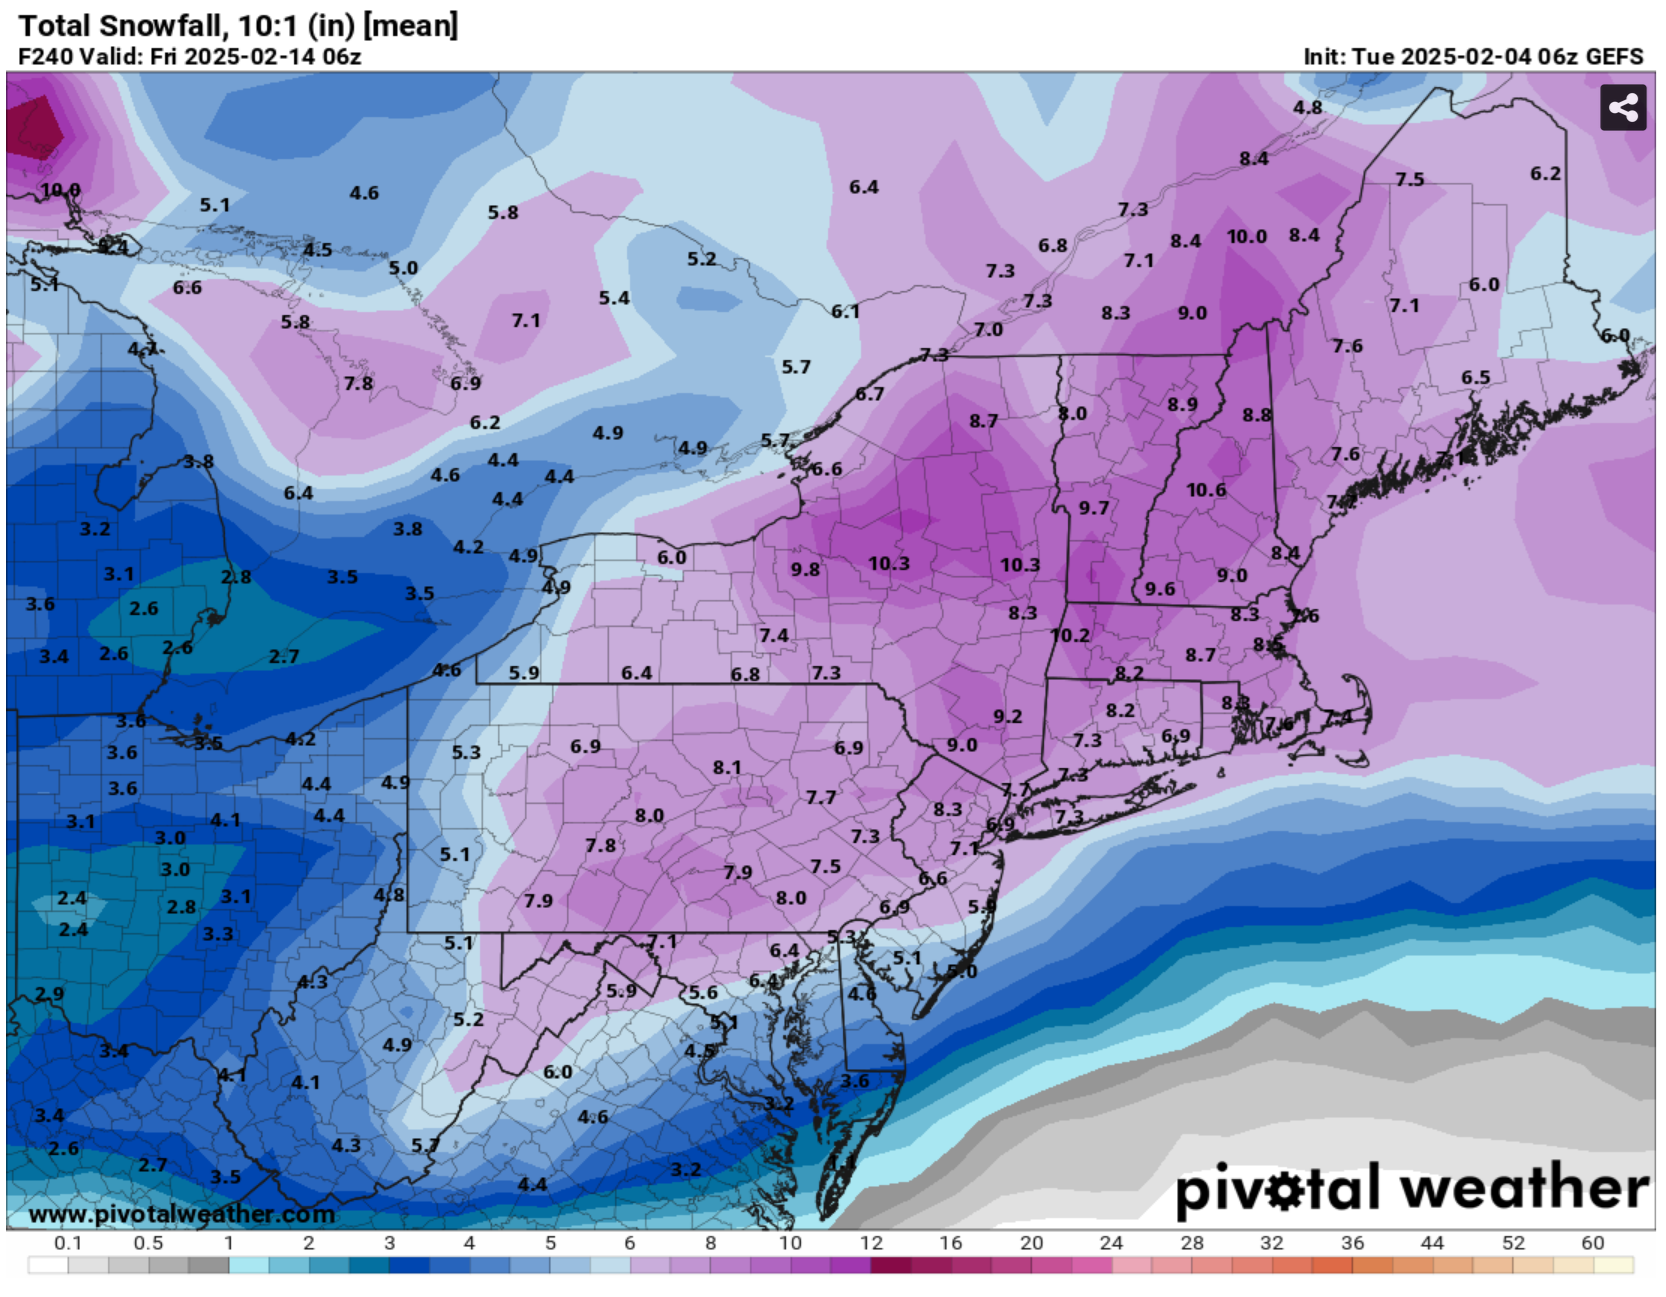
The 10 day total includes ~0.5" for Wed night, 1-2" for Sat, and 5-6" spread out over 3 days reflecting multiple potential waves and timing differences between ensemble members.