

eduggs
-
Posts
5,950 -
Joined
-
Last visited
Content Type
Profiles
Blogs
Forums
American Weather
Media Demo
Store
Gallery
Everything posted by eduggs
-
December hasn't been snowy either. But even the occasional times it has snowed in March, the sun comes out that afternoon or the next day and the temp spikes to 55F and everything melts. Spring.
-
1. The MJO often does not progress as modeled 3 weeks out. 2. The connection between MJO phase and local snowfall is relatively weak. 3. Over the past 10 years, the end of February tends to get spring like regardless of MJO phase.
-
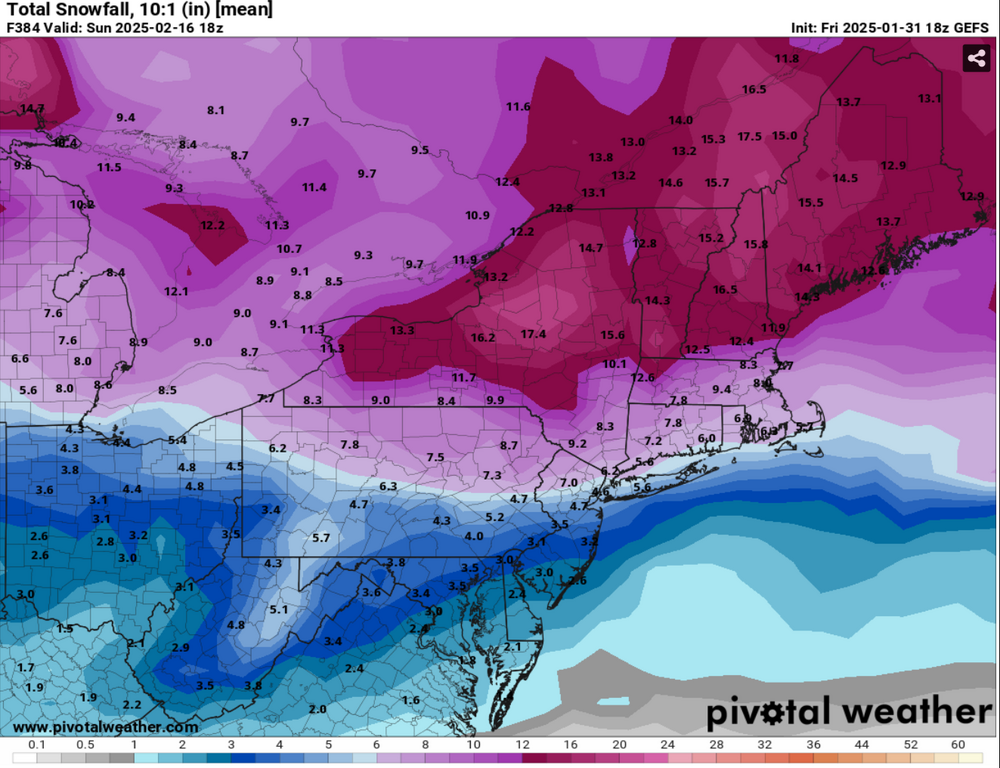
You're right. 1-2" is snow depth mean at 240hr.
-
Almost no utility outside of 240 hrs. Snow mean in that range is 1-2" across the metro from south to north.
-
I think that's a bit of a myth. Sure the immediate shoreline doesn't get a ton of ZR, but most of the coastal plane is susceptible. Particularly W, N, and NE suburbs of NYC.
-
LR is always a crap shoot regardless of how good guidance looks. I don't even like to look beyond 14 days. It almost always leads to a cycle of excitement and heartbreak or just outright depression.
-
EPS is not snowy outside of NNE. I would advise caution at this juncture unless you don't mind bitter disappointment. The 300mb jet is pretty far north over this period. We are only briefly and periodically tickling the cold. Everything could break right. Overrunning often overperforms locally. We don't need high amplitude waves and they come every 2-3 days. But from memory at our latitude ZR to rain is more likely than snow or snow to IP. Still... I'll be begging for and dreaming of snow.
-
ECM doesn't seem to show much snow locally during that period. Or even through 10 days. Why do I think it will probably be right? And then a full pattern breakdown into an early spring. GFS and even CMC look decent with several wintry chances. Going to ride the edge at our latitude. Right now I'm thinking rain and ZR mostly.
-
-
I guess Feb 9th plus/minus is the best window right now according to ensembles for a possible snow threat. Maybe another low chance threat around the 6th? With the jet stream configuration, anything for the next 2 weeks feels like a long shot.
-
This next two weeks smells like a cold/dry - warm/rain period with maybe a little ZR mixed in for a wintry appeal. A few model cycles might tease us with front end overrunning snow, but I suspect whichever model shows the least snow will verify best. Hopefully my impression turns out completely wrong or at least things change for the better mid month. Unfortunately over the past 10 years, by mid-Feb it starts to feel like spring.
-
Better than GFS. But still beyond day 10. H5 looks like a NNE special. But we can always get lucky I guess, especially in mid Feb.
-
LR guidance looking like dog shit again. Snow threat tracking sure has been painful these past few winters.
-
Guidance has slightly delayed dampening the wave in recent cycles such that a discernible SLP forms on some guidance - notably the Canadian. Maybe there could even be a few flakes at the tail end for far NW areas. Maybe at the start too. That and a little bit of ZR is what we are reduced to groveling for.
-
We actually have a hybrid gradient-overrunning pattern forecasted to set up over the next week or so. Unfortunately, modeling has shifted the gradient northward in time over the past several days leading to repeated bouts of wintry precipitation heading into northern NY and NE. That will likely continue to be the risk moving forward.
-
You are indirectly supporting a point that I have been trying to make for years that long-range averaged anomaly charts are poor tool for identifying regional snow threats and likelihoods. They work OK for 10-14 day regional temperature forecasting. In northern Japan and Hokkaido, you can often see snowy periods coming 2 weeks in advance. But for us, snow is primarily correlated to 500mb features that are not identifiable at a time and space scale resolvable at 2 week lead times. This leads to a hype and disappointment cycle based on pretty looking anomaly charts.
-
Yup. But this is true of most climate indices and telecons, especially during peak winter climo. The nuances of the 500mb evolution and configuration are key. Each combination is unique, and a minor feature can occasionally lead to local snow (particularly as you gain latitude and elevation) regardless of longwave pattern and telecon state.
-
Cold relative to last winter, sure. Even compared to the 10-yr average. I guess the statistics say compared to the recent 20 or 30 year average, the metro area has been slightly below normal cumalatively (using simplistic max plus min divided by two for daily departure). But compared to any longer term reference this has not been a cold winter. And I think there's a good chance we end up above normal when all is said and done. Take Newark as a local example. There was a 2-3 day cold stretch in January and 1 day in December. All other days this winter have been near or above freezing.
-
Yup. Medium to early-long-range longwave pattern recognition using ensembles is pretty good for airmass forecasting, okay for anticipating general regional storminess, and poor for local snowstorm forecasting. The averaging effect of ensembles especially towards the end of the usable range masks the critical shortwave details that drive sensible weather outcomes. And superimposed model error further compounds the difficulty.
-
Yeah Sapporo snow is crazy. If you look at the same number of days it took Boston to get 110", Sapporo probably has 15-20 or so such periods since record keeping began in 1953. And the really crazy thing is there are places very close to Sapporo that get 2 or 3 times as much snow. Sapporo City is not in a heavy snow zone.
-
Boston does not feel like a big city. But yes, EMA has a large and dense population. Sapporo City on the other hand feels bigger - with a city center that feels more like Manhattan than Los Angeles.
-
Sapporo City gets very cold and frequently frigid. But the city itself is warmed by the Sea of Japan on NW winds, so it's a bit warmer than inland/mountainous areas. Overall, Hokkaido is colder than SNE.
-
FWIW, Sapporo is a bigger city than Boston. Obviously metro sizes depend on where you draw the borders, but Sapporo also feels significantly bigger than Boston. And although it isn't particularly snowy compared to the immediate surrounding area, it has received significantly more snow during many months than BOS did that winter. But Japan is kind of in a category of its own.
-
Yeah it really does hurt. The storm looks like a sure bet down in the Gulf. That's why I mostly look at 500mb and sometimes 250/300mb. The surface is just a response to the upper levels. It's easier to anticipate things falling apart when you look at the upper level charts.
- 993 replies
-
- 1
-

-
- metsfan vs snowman
- bomb
- (and 2 more)
-
Yup. And it's usually a bad forecast. I'm okay with forecasts of 1-2" or 2-3". Winter QPF is generally forecastable with a higher precision than 0.1 - 0.3". The cases where a 1-3" range occurs locally is usually with high liquid to snow ratios where the fluff factor in isolated bands can significantly increase the local snowfall variability. Regardless, I think it's bad practice to forecast a snowfall range that spans the gap between nuisance and solidly plowable. Sorry for the off-topic...
- 993 replies
-
- 1
-
-
- metsfan vs snowman
- bomb
- (and 2 more)


