Chinook
-
Posts
10,674 -
Joined
-
Last visited
Content Type
Profiles
Blogs
Forums
American Weather
Media Demo
Store
Gallery
Everything posted by Chinook
-

2023 Short/Medium Range Severe Weather Discussion
Chinook replied to Chicago Storm's topic in Lakes/Ohio Valley
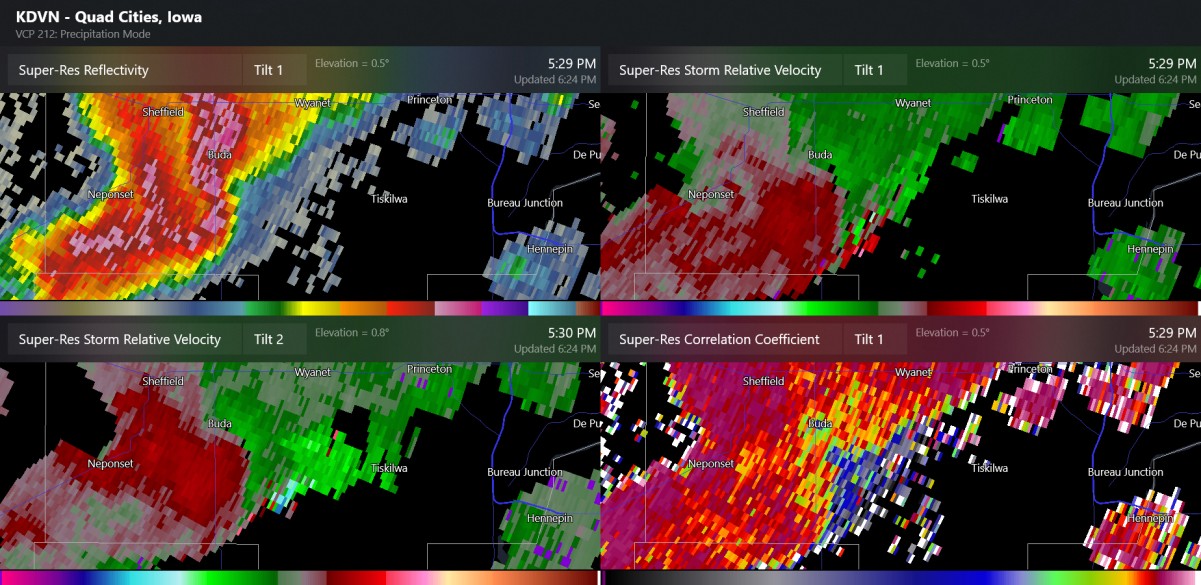
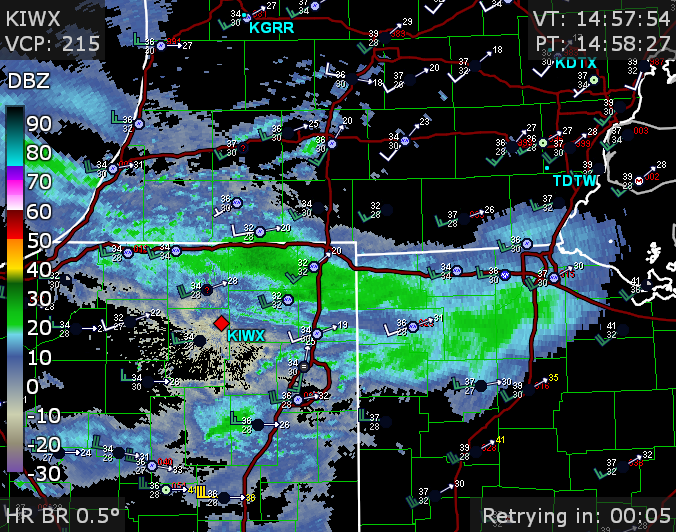
I believe this was the radar for the confirmed tornado near Princeton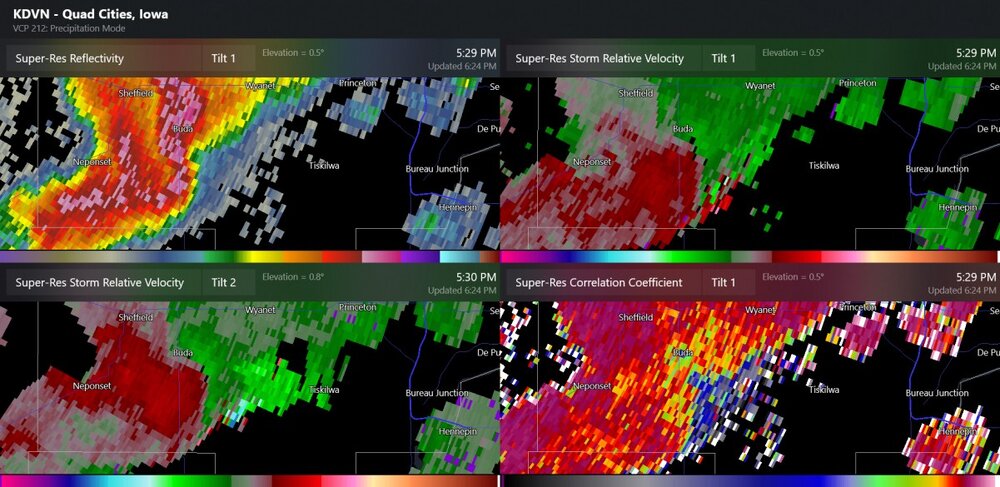
-
2023 Short/Medium Range Severe Weather Discussion
Chinook replied to Chicago Storm's topic in Lakes/Ohio Valley
Here's a storm with a recent history of hail northwest of St. Louis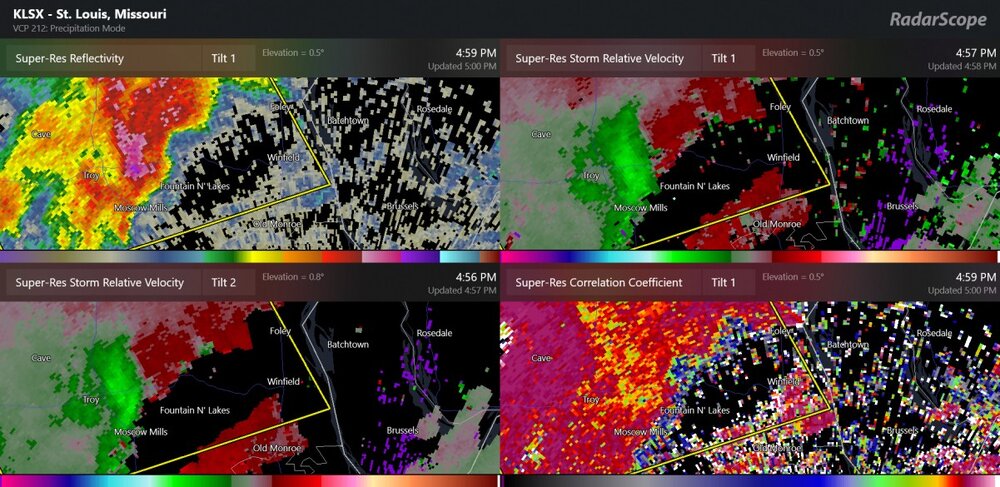
-
2023 Short/Medium Range Severe Weather Discussion
Chinook replied to Chicago Storm's topic in Lakes/Ohio Valley
two tornado warnings, west Illinois -
Severe Weather 4-19-23 through 4-21-23
Chinook replied to cheese007's topic in Central/Western States
Etowah OK, confirmed tornado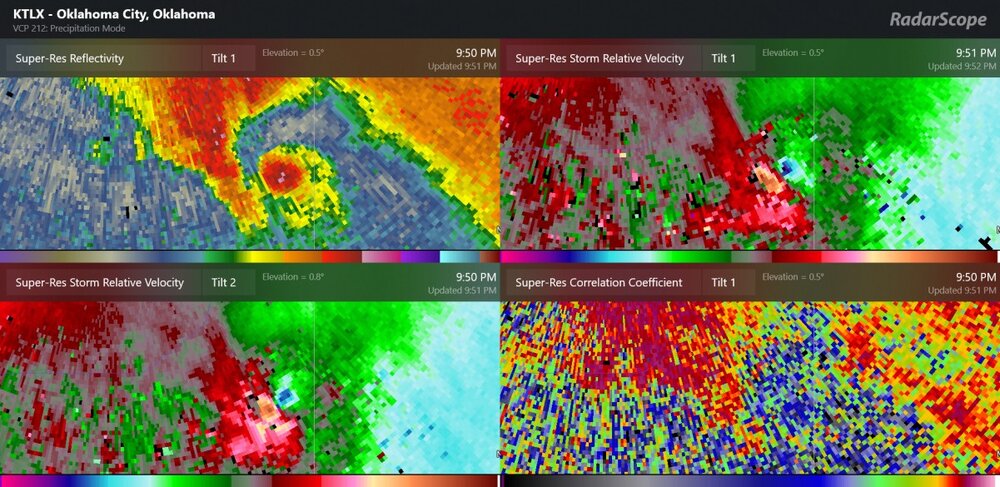
-
Severe Weather 4-19-23 through 4-21-23
Chinook replied to cheese007's topic in Central/Western States
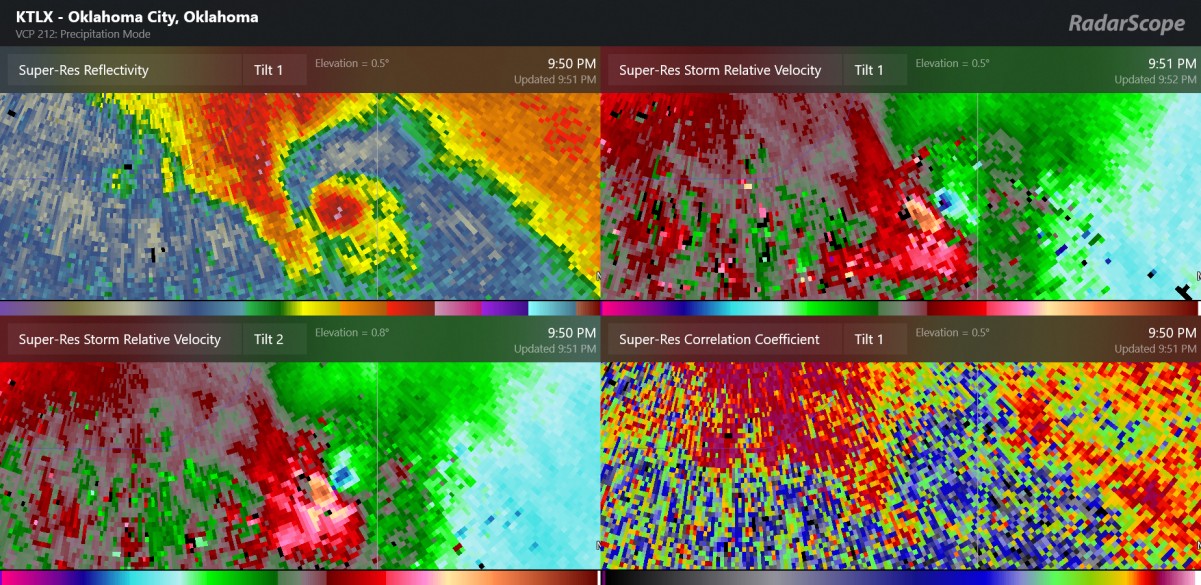
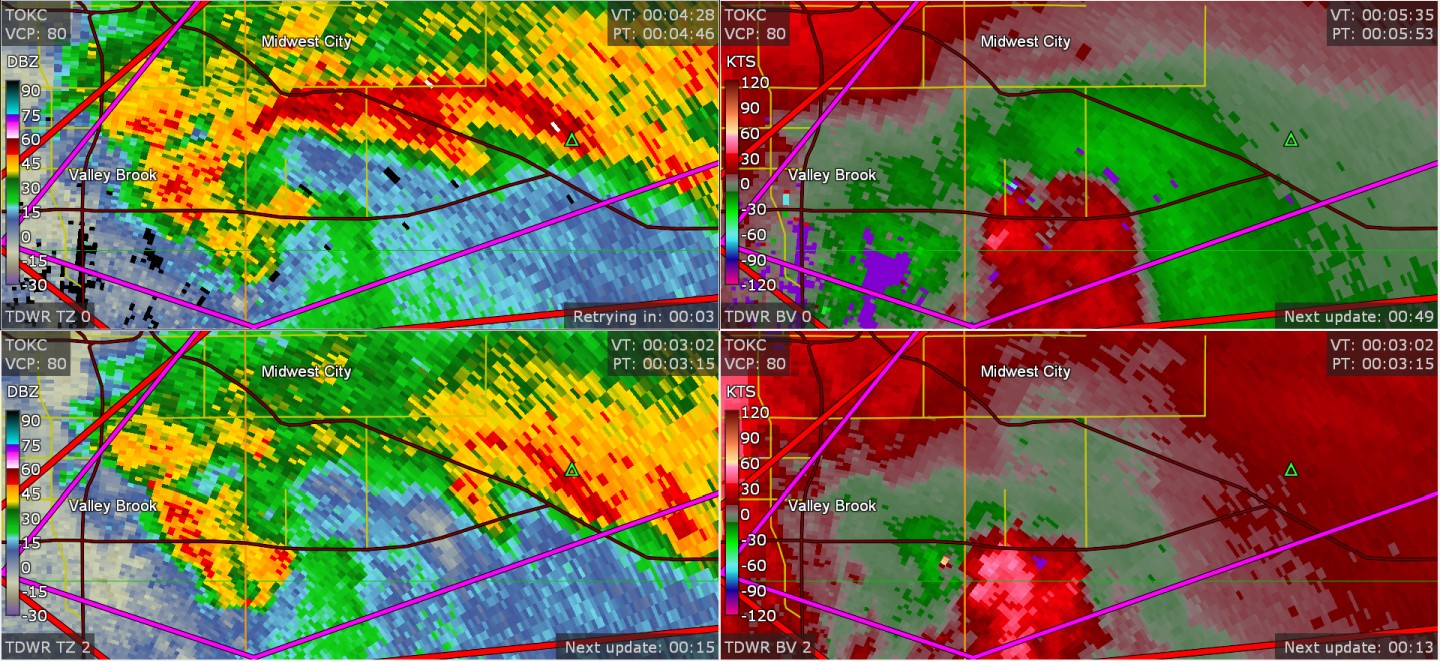
tornado confirmed near I-240 at about 7:00 central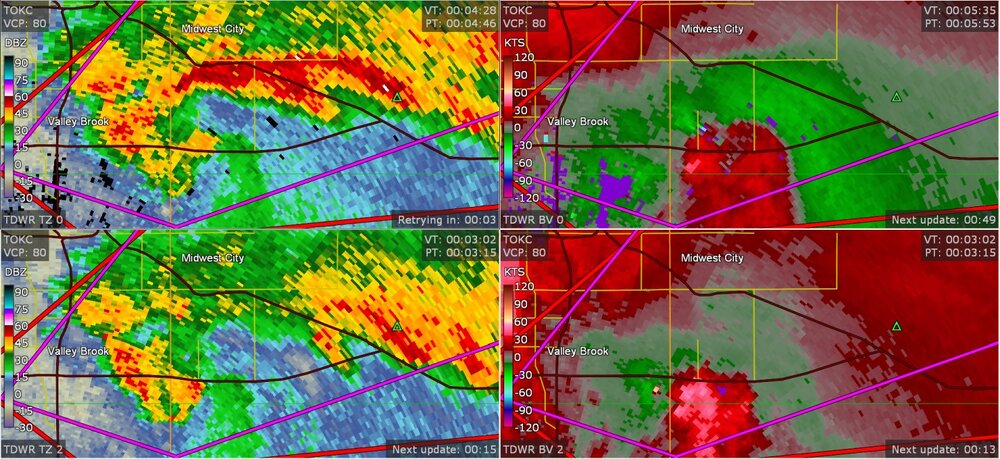
-
Severe Weather 4-19-23 through 4-21-23
Chinook replied to cheese007's topic in Central/Western States
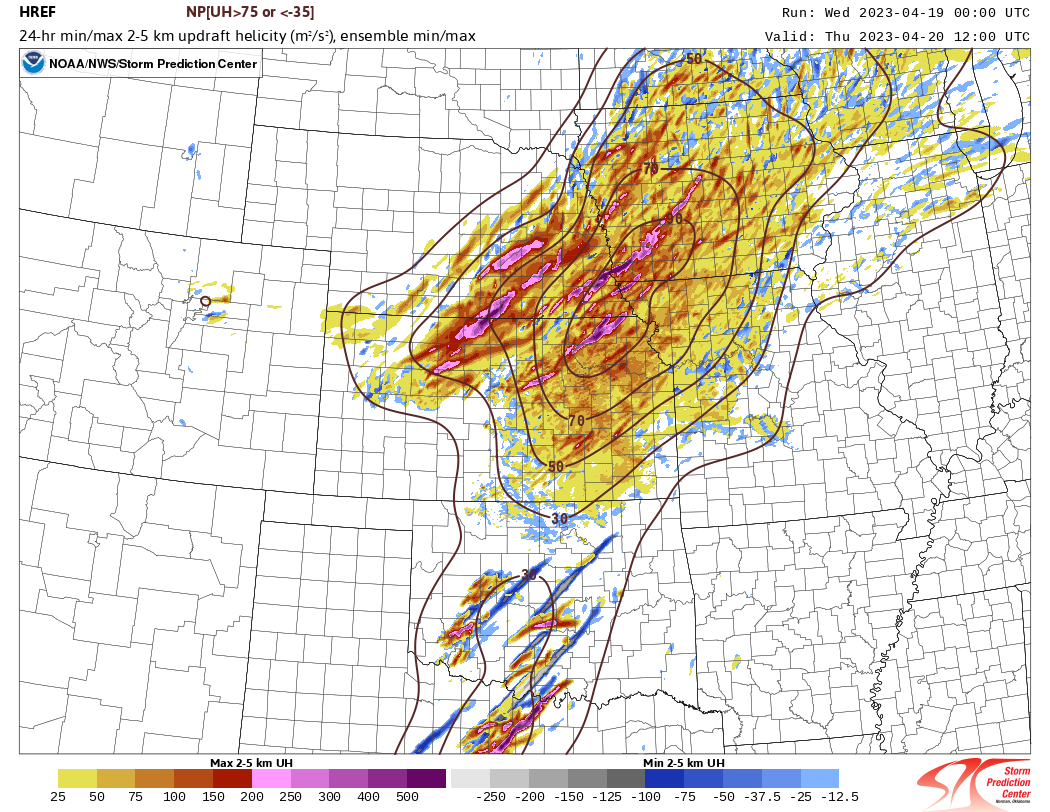
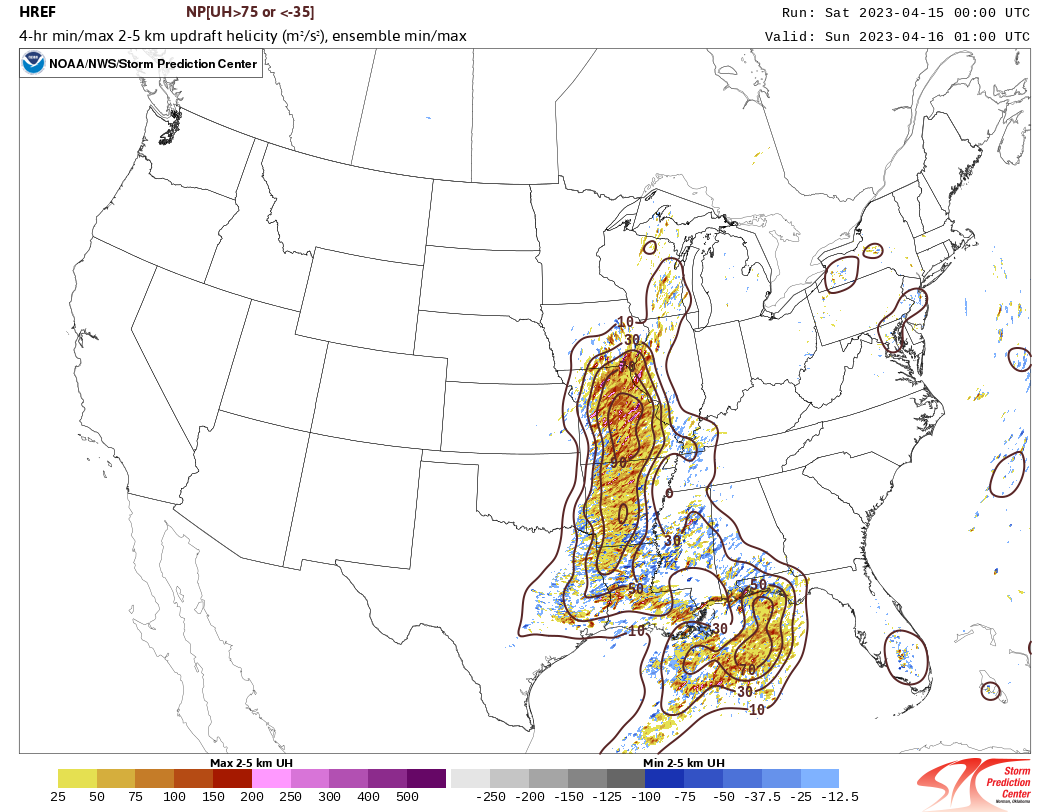
Honestly I still have no idea if there will be a lot of severe weather reports, but the pattern seems right for several storms, and the CAMs have varying solutions, with some storms that might be elevated, but still capable of large hail.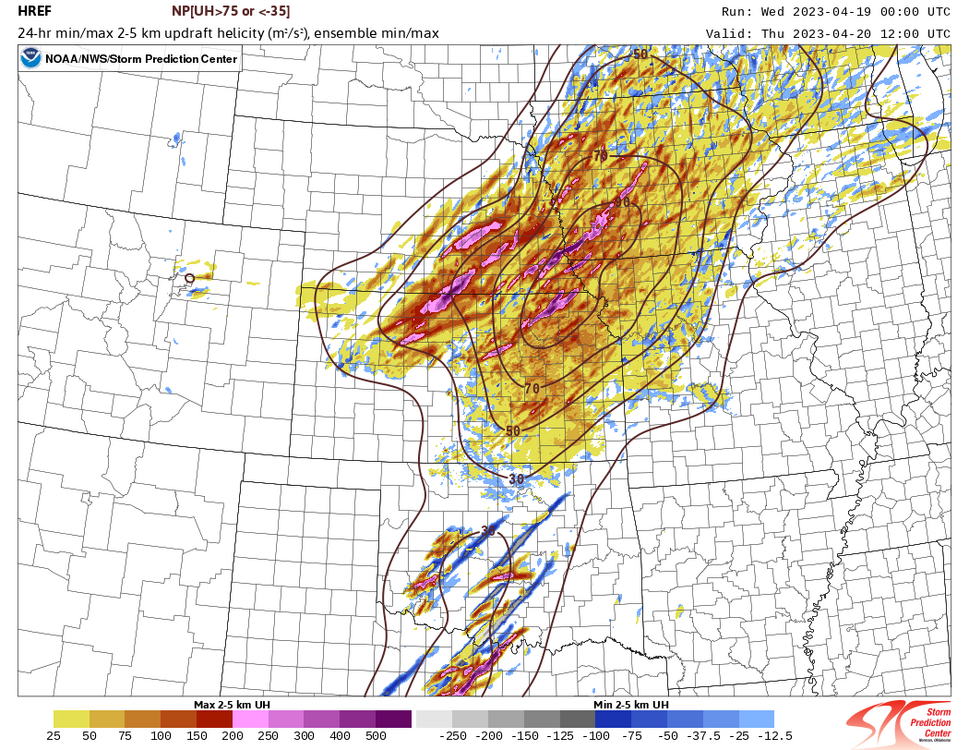
-
Severe Weather 4-19-23 through 4-21-23
Chinook replied to cheese007's topic in Central/Western States
NAM has the moisture farther west than the previous runs. I think the CAMs are more aggressive with firing storms near the front, or even on the cold side of the front. There's not a lot of agreement between the HRRR and the other ones.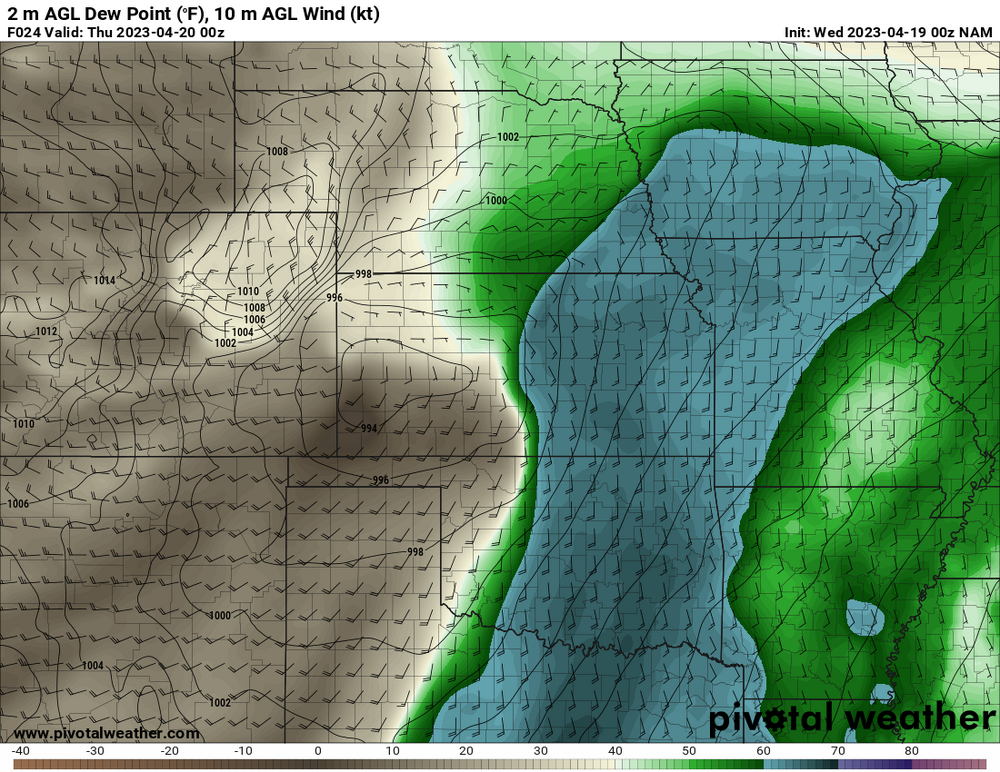
-
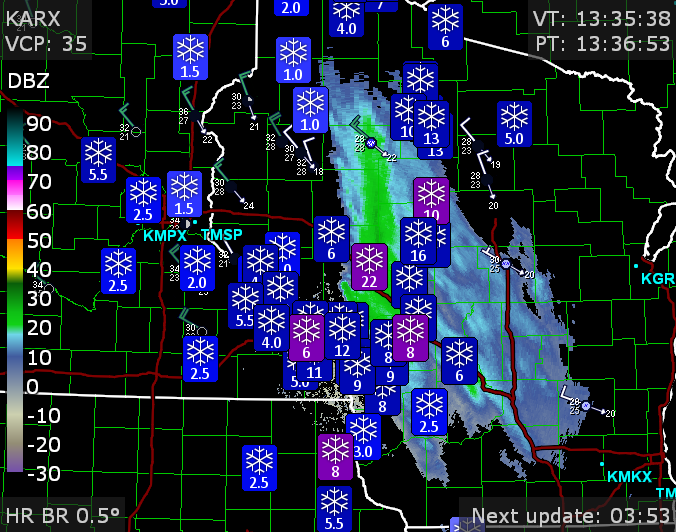
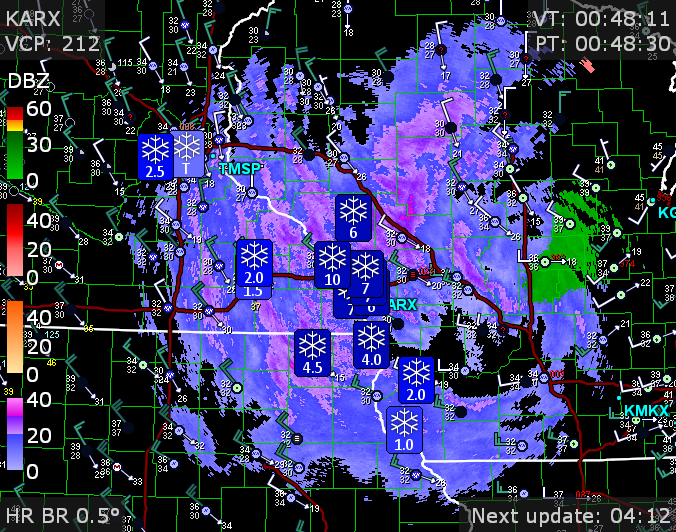
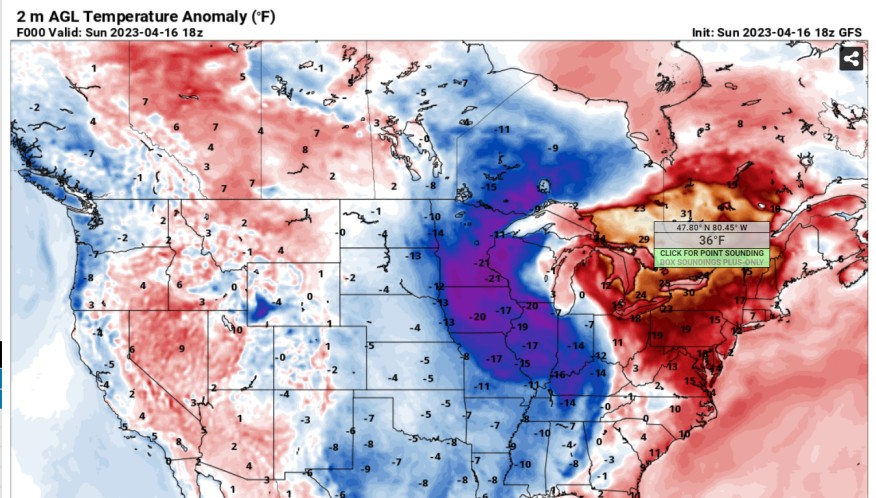
This band of snow has formed on the south side of the low. Because it has to be 50 degrees colder than Saturday, of course. and oh, by the way, the LaCrosse WI area got 9-22" (looks like 9"-13" in the city area)
-
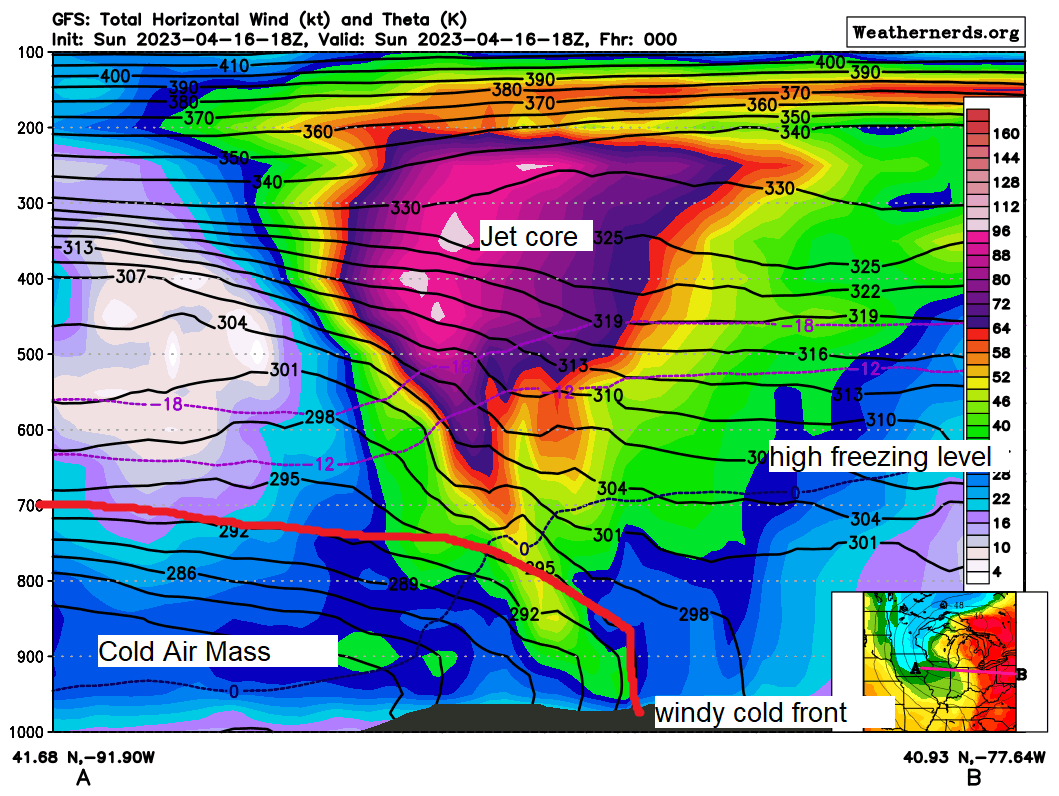
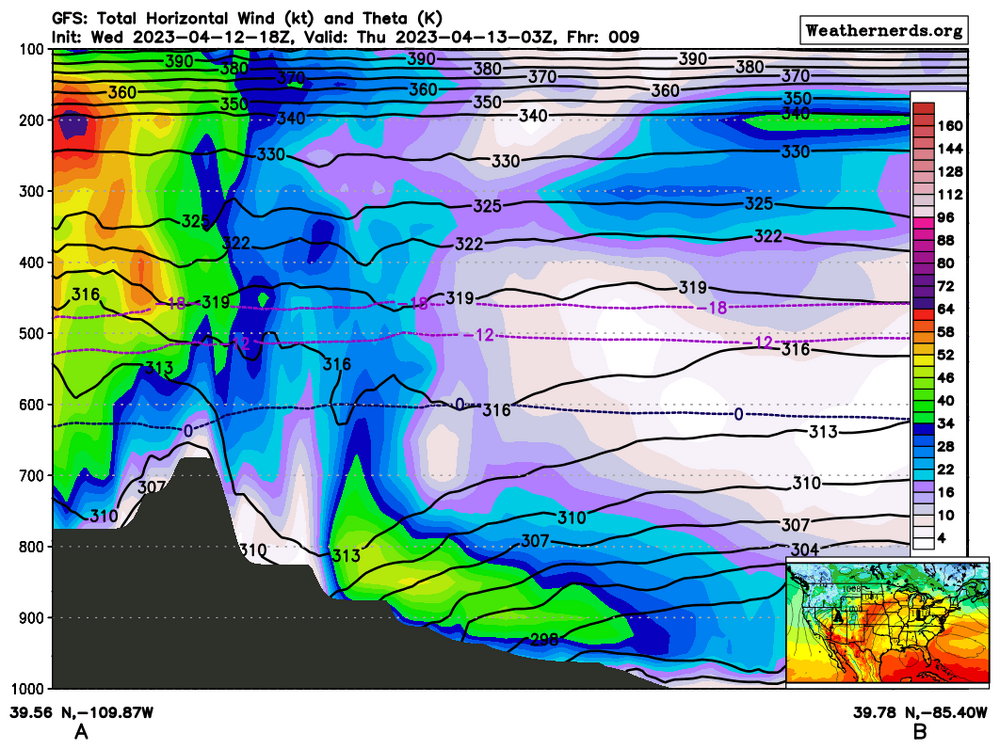
Here is a cross-section of our cold front today, and the section is across the I-80 corridor. You can see the quick dropoff of the 0 degree C isotherm from over 700mb (east, Ohio, Pennsylvania) to around 950mb (west, Iowa). The polar jet stream is directly over the main section of cooling temperatures at the low levels.

-
1-10" of snow
-
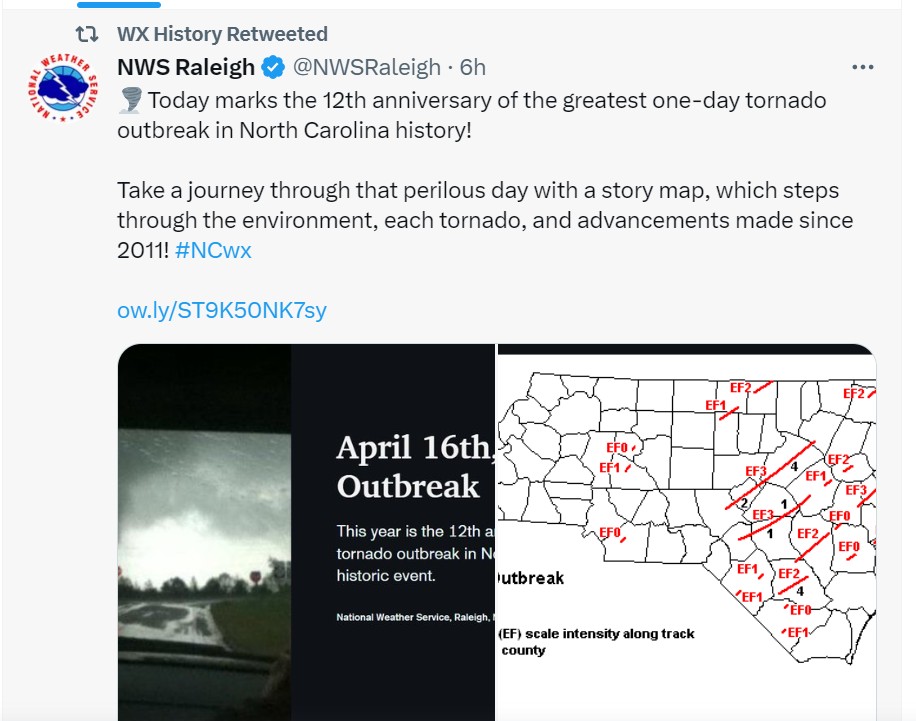
Remembering some nasty history!
-
"nice weather shock" for part of Quebec?
-
CoCoRAHS, invented in Fort Collins, after the 1997 flood.
-
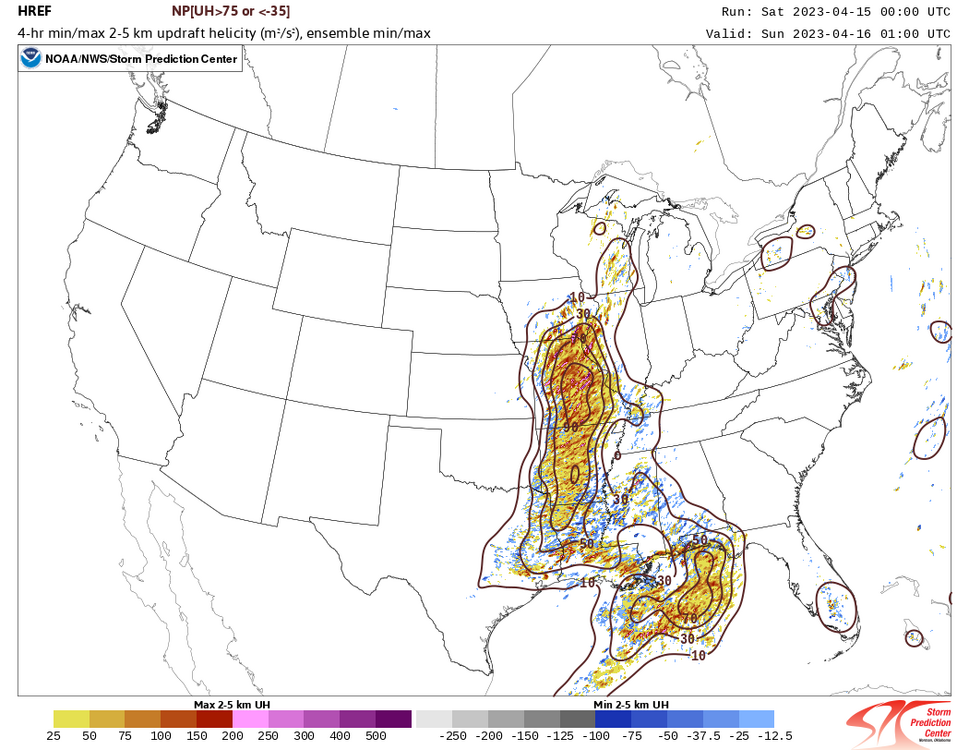
MO/AR/IL should have quite a few severe storms in the form of mostly squall lines. Models agree on SBCAPE values around 3000 J/kg and 0-6km shear values of 30-40 kt east of the developing storms in Missouri.
-
The SPC web page has max/min/average climatology for basic upper air observed values, like 700mb dew point. The extremes at DTX of 700mb dew points are -45C and even lower for several days of the month of April.
-
Desert, you say? how about 2% relative humidity aloft, measured in Michigan. It's like 2% milk. 700mb dew points should still be -20C to -30C in Michigan right now.
-
Snowing at APA (Centennial Airport) and raining in the rest of Denver
-
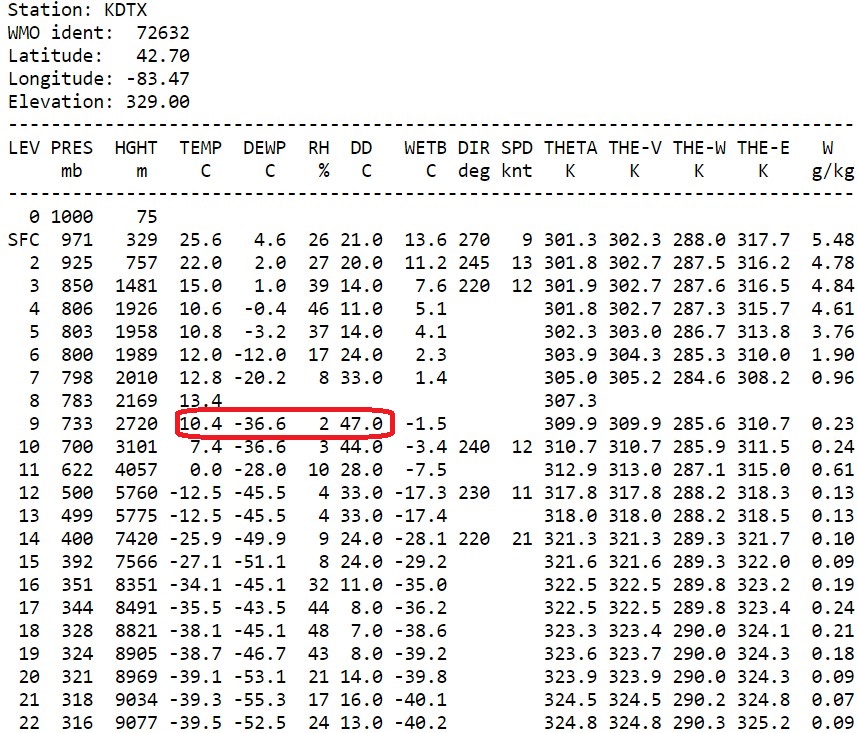
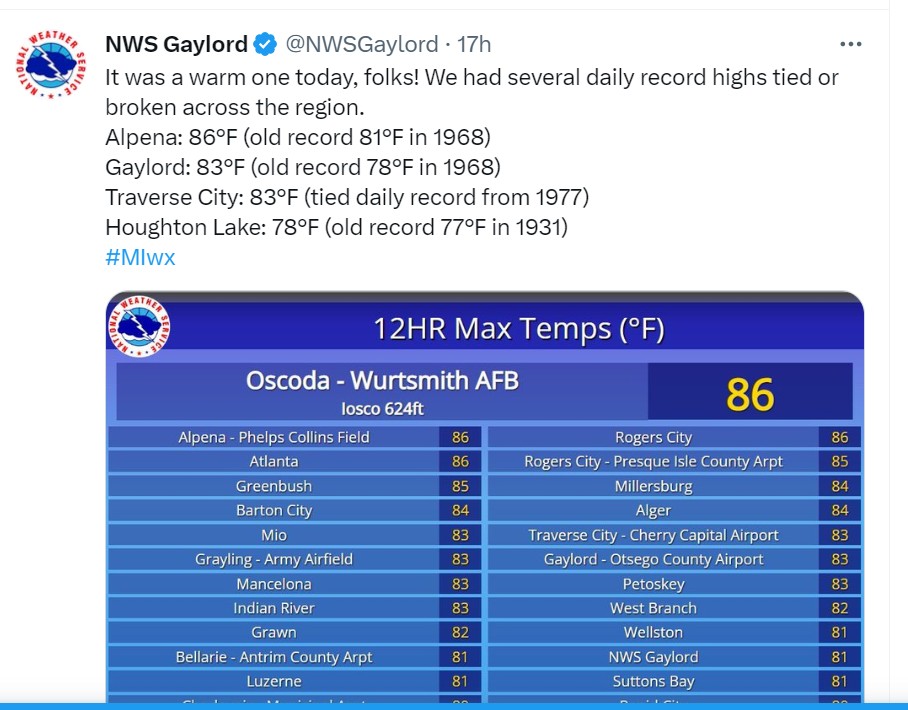
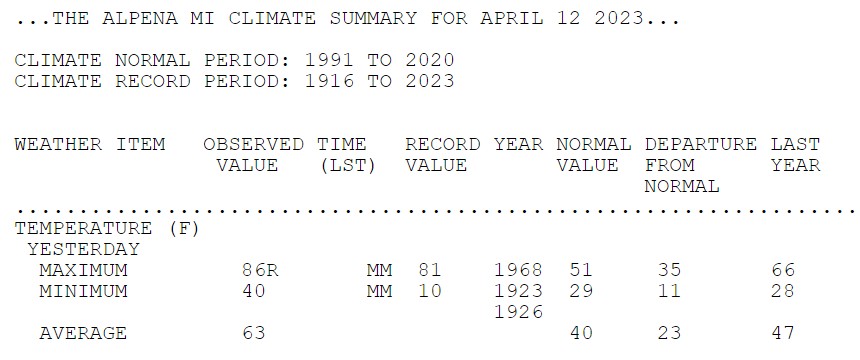
These are above the July average temps for some or all of the northern Michigan region. Alpena was 35 deg F above average yesterday, for the high of the day. The 850mb temperature was up to 15 deg C, and as you can see, the surface temperature was an even 30 deg C, I guess that's perfect mixing, if you assume 10 deg C/km and give 1500 meters from the 850mb level to the ground, both of which are not exact.
-
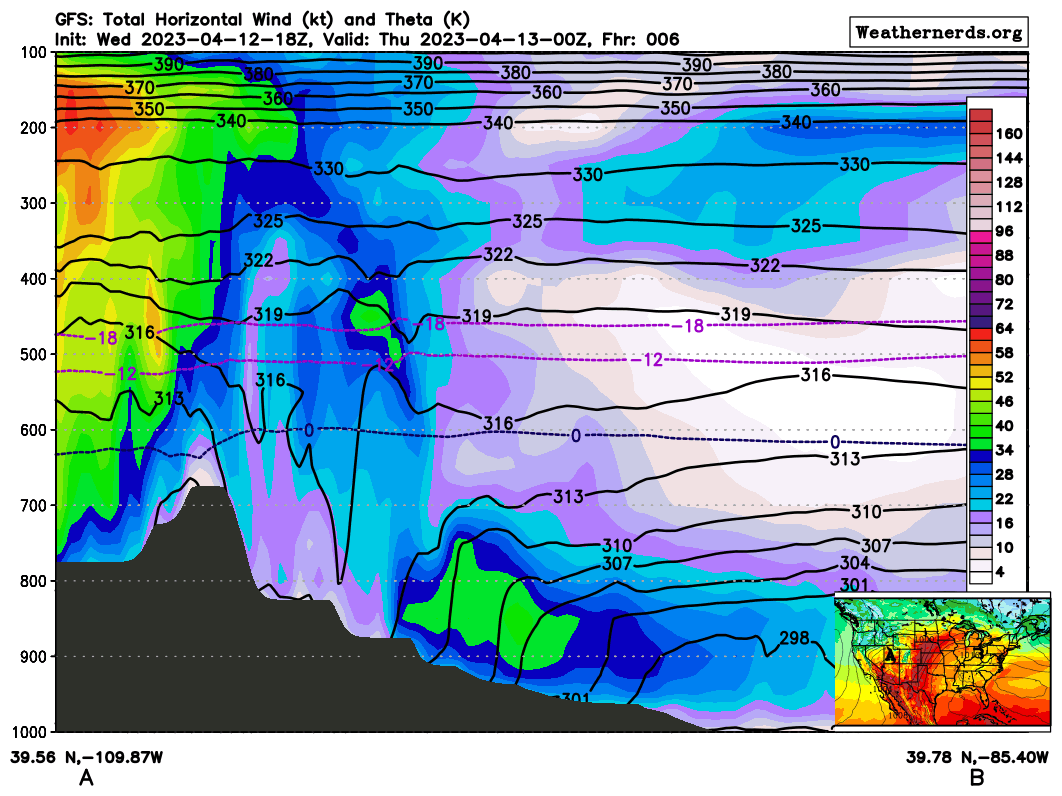
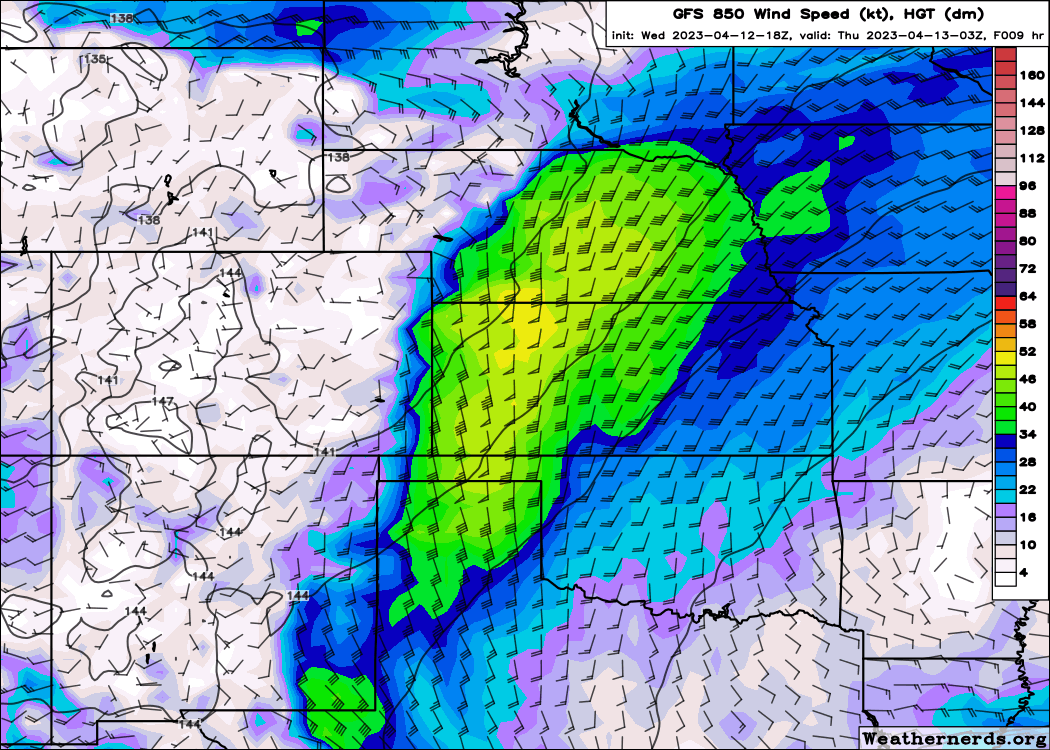
An 2-d cross section across Colorado and Kansas. The development of the nighttime low-level jet goes from the 20's knots range (3-hour forecast, not shown), to 34 knots (first picture) to 46-48 knots (second picture) tonight. There are not thunderstorms expected, so this is showing that the low-level jet is a common feature, whether the moisture is there or not. It has this way of speeding up to the east of the Rockies that's probably unlike a lot of other places in the world. GFS 6-hr forecast GFS 9-hour forecast normal view


-
It took me perhaps a very long time to figure out that the degree of 0-6 km shear (and layers above 0-6km) directly related to the amount of stretching out of the FFD and also the extent to which the anvil or cirrus material is carried away from the storm. And along with that, the storms with greater 0-3km storm relative helicity but less impressive 0-6km shear, such as 30 kt or 35 kt, turned out to be high precip. as the higher level winds did not remove material. I'm saying this because sometimes you just have to do something for years to learn it. Or you could have "Convective Chronicles" say it in a pretty easy way to understand.
-
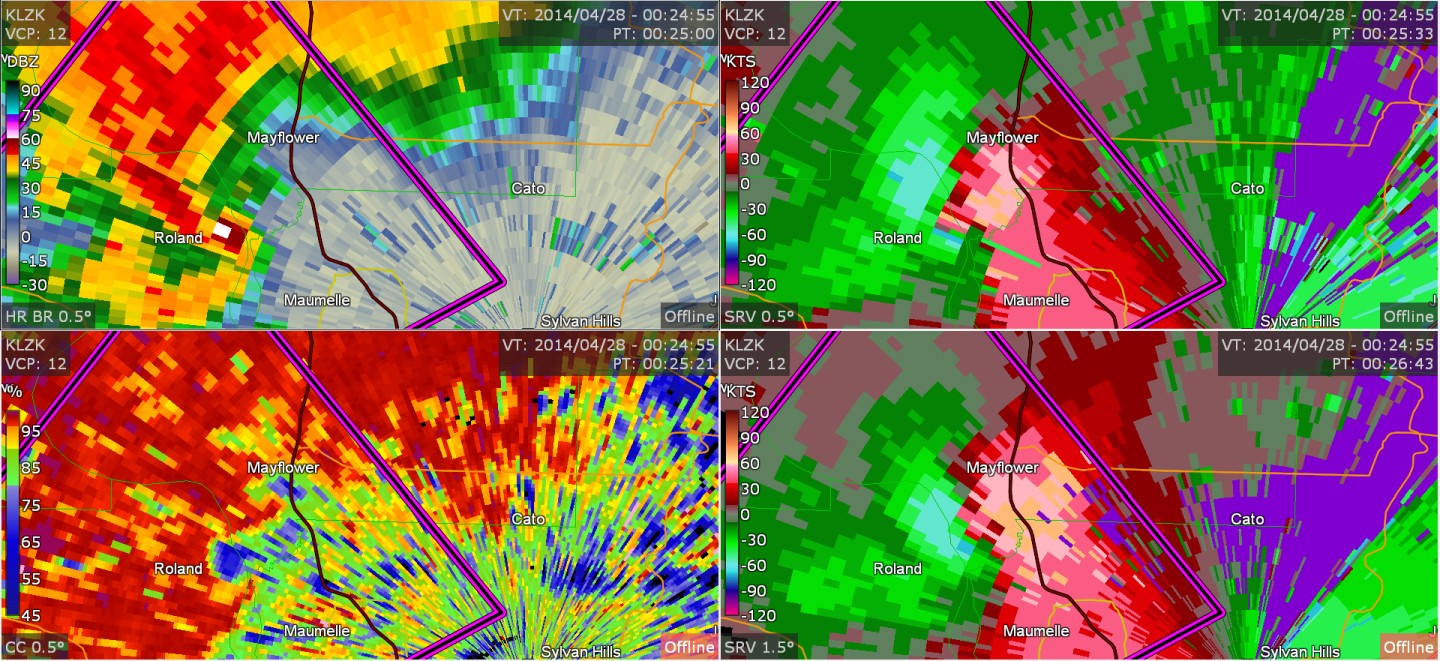
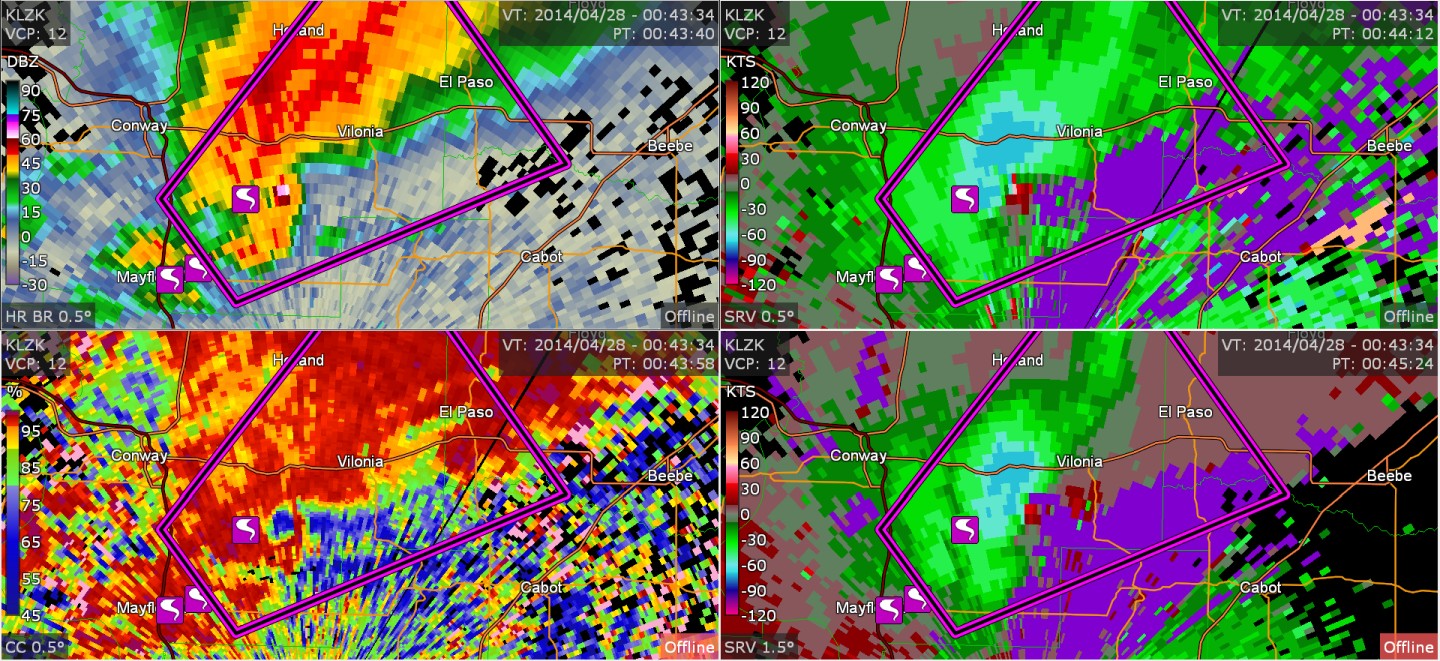
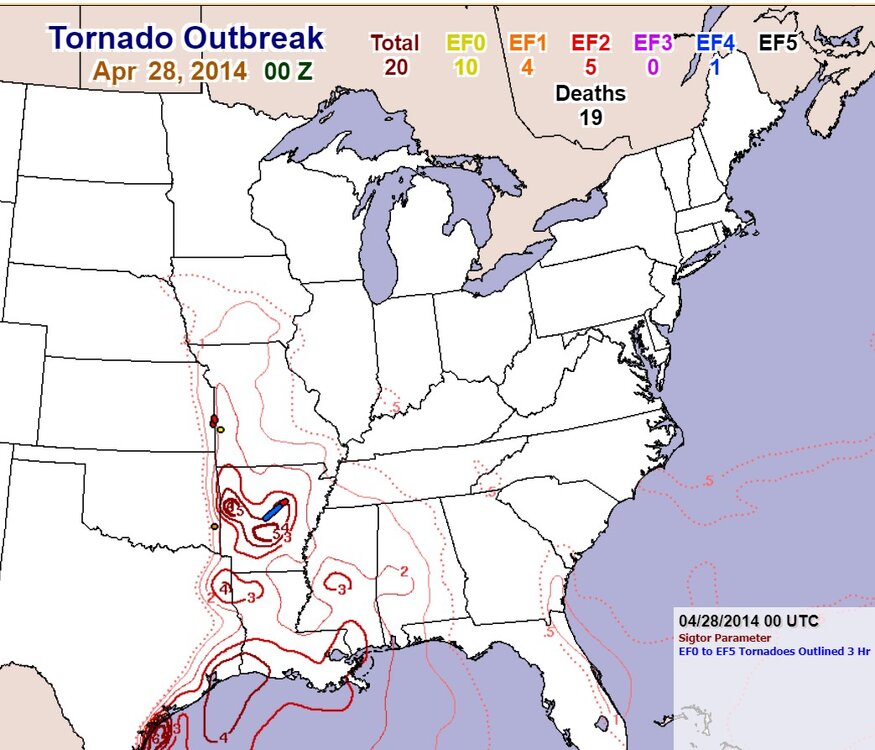
I pulled up the archived Level-3 radar data a couple of days ago, so that's what you see here. Somehow, my vast amount of saved data didn't contain this, although I remember looking at this radar data as it happened. It probably because I had some data lost when I had two laptop crashes between 2013-2015, but thankfully a lot of my data is backed up in various formats (like CDROMS from the old days).
-
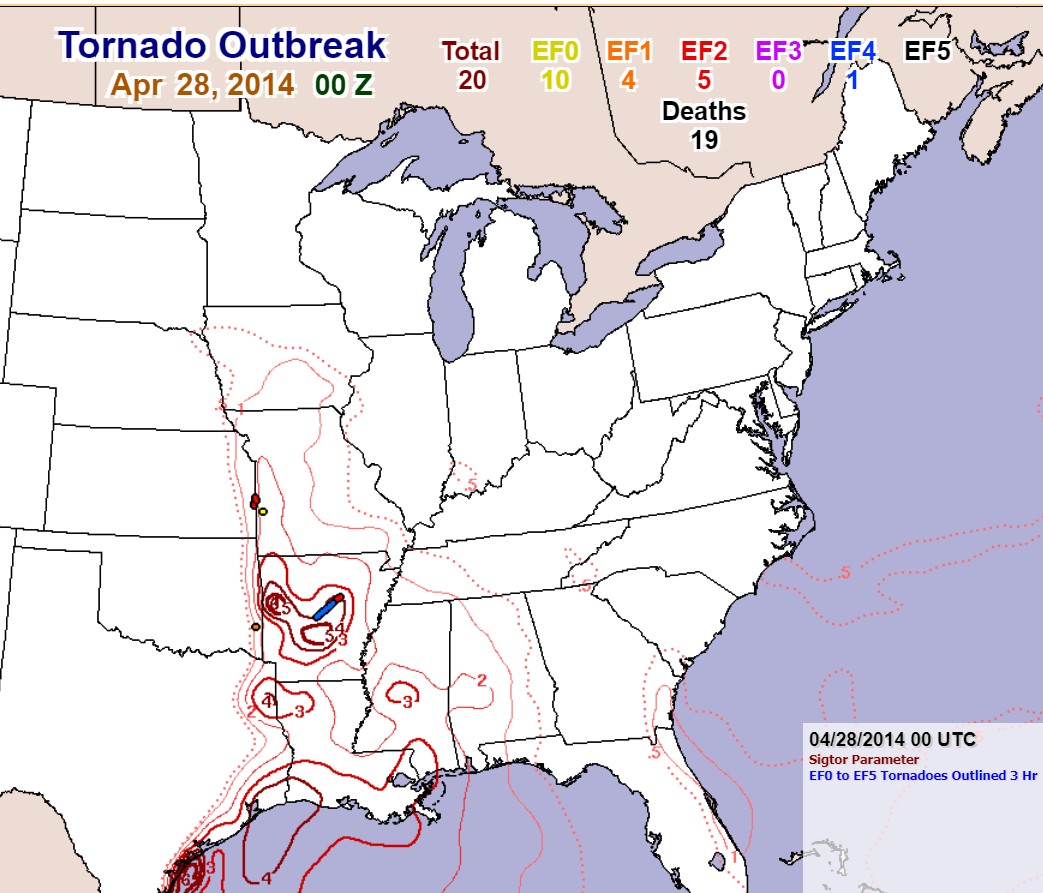
The SPC research page only says EF-4. I wonder why that is wrong. It's not like it happened yesterday. Other information that I didn't post. I discovered that the supercell must have started close to the stationary front and tracked to the cool side of it. The cell must have been using the most unstable layer (MUCAPE) to power up the huge updrafts. As you can see, the mesoanalysis surface-based CAPE was close to zero with the colder air, and apparently this didn't stop the system from creating a huge tornado.
-
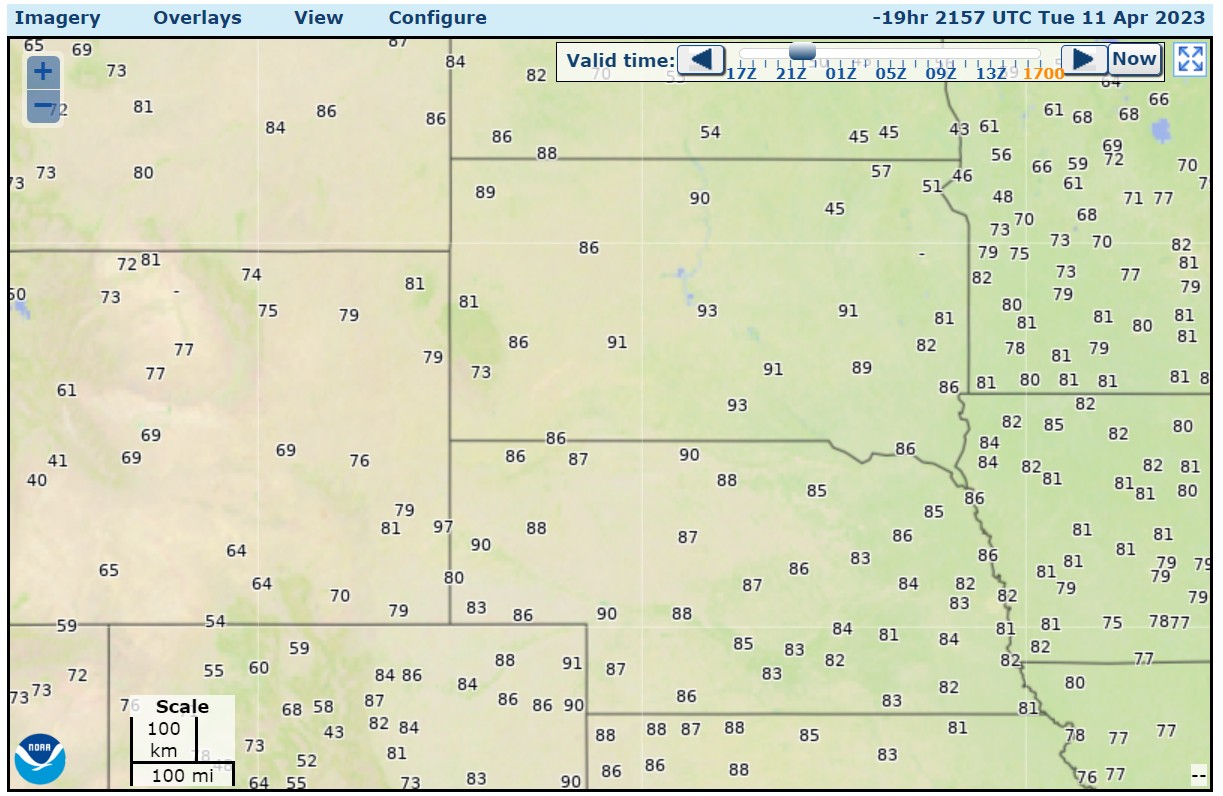
It was up to 93 at the lower elevations of South Dakota yesterday, up to 80 degrees at Cheyenne (6100 ft). That would be like a million degrees at sea level. (well, maybe not.)

-
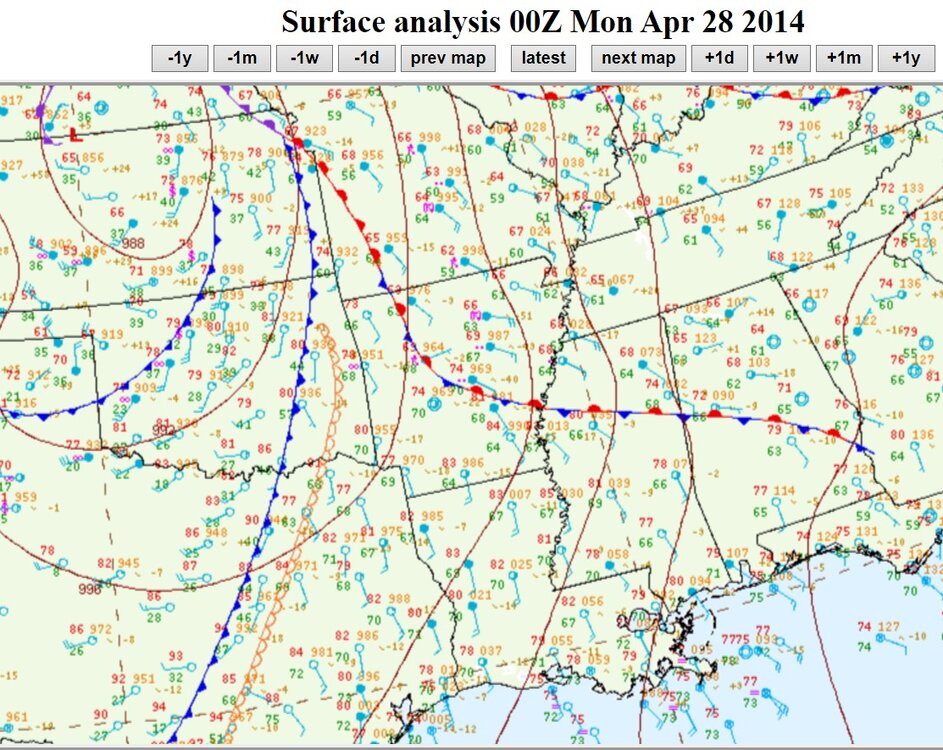
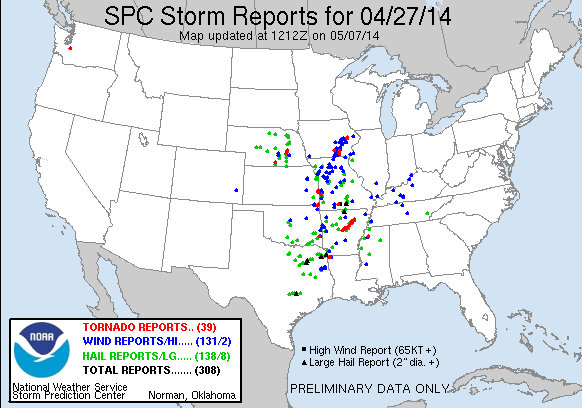
I've been looking at some various case studies of tornadoes/outbreaks on Youtube. I just took a quick search of Youtube and also the internet in general, and not a whole lot has been said about the devastating Mayflower-Vilonia tornado (9 years ago). The Mayflower-Vilonia tornado was 41 miles long and started near 0000z and continued for about 1 hour. It was the only tornado in Arkansas on April 27, 2014. Storm reports and tornadoes were widely spread out within the Moderate risk segment in Arkansas and Missouri. (note: HIGH RISK issued at 20z in Arkansas) On April 28, there were dozens of tornadoes in that day's Moderate risk segment. back to April 27th: There was CAPE up to 3000 J/kg in southern Arkansas with a stationary front near Little Rock. With the easterly winds north of Little Rock, 0-3km SRH maxed out at a large value of 600 m2/s2. (Also supported by Little Rock special sounding at 21z, 612 m2/s2)


-
First day in the upper 60's without some sort of crazy wind machine, chance for rain, that sort of thing.