All Activity
- Past hour
-
Gfs east of Bermuda. Keep tracking!
-
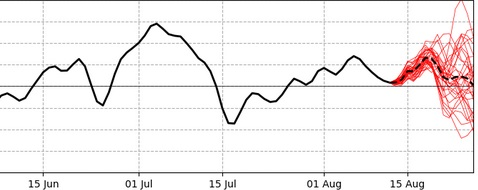
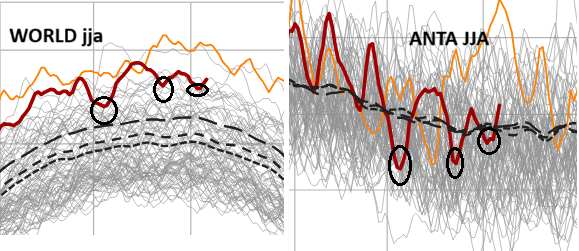
Not attempting any acclaim to shame vs fame, either way, but using the Climate Reanalyzer, there appears to be a correlation between the Antarctic vs the rest of the Globe. There were significant downward spikes spanning some 3 to 5 days in the ongoing registry of the Antarctic daily temperatures, ~ July 5 and again July 25, then very recently ( see blw). Then looking over the curve of the entire planet during those same periods gives a coherent impression that the two curves are moving together in time. I think the Antarctic, having unique geologic circumstance that effectively closes it off from the rest of the world ... particularly during the +annular modes whence the PV is > median strength, ... it draws me to question using that to "weight" the world down. The Antarctic can circumstantially "protect" it's cold during +AAOs, which we can see here ... we've spent the ballast of the last 2.5 months in that circulation mode, My 'numerical suspicion' is that this is more of an artifact that looks like global cooling, holding the entirety of world averages down. The problem with that is geophysical. The Antarctics uniqueness tends to isolate it during these stronger positive excursions; I think that should be considered when assessing a whole planet that does not share in the unique geophysical capacity the Antarctic has for lesser homogeny with the surrounding world, during episodic circulation seclusion. I'm saying - in part - that a cooler 2025 ...mm I'm not sure that's really what's going on, when we're merely dealing in aberrant positive annular modes of the AAO. When/if the AAO goes negative, we may find that the total global temperature rebounds.
-
KFIT tD still in the 50s Nearby PWS is at 62 87F
-
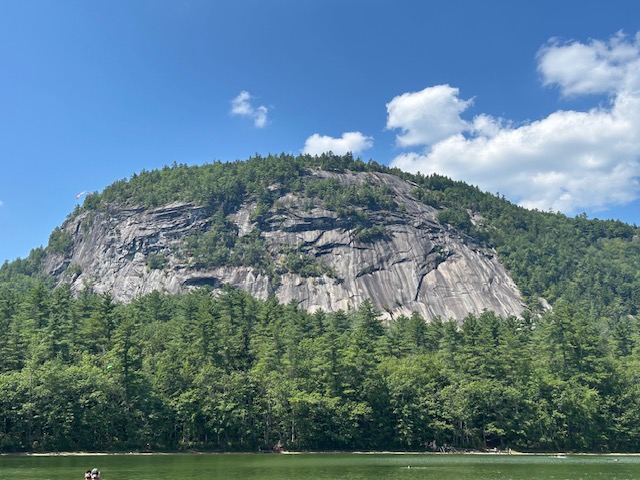
93/61 at Echo Lake State Park. It’s quite comfortable in the shade.
-
I guess sea-breeze boundary is something to watch for tomorrow. The HRRR has been dreadful this summer in terms of convection but I think it is onto something.
-
My dews have gone above 70 three days running
-
 JFK has had nearly as many record and near record highs as Newark in the fall during recent years even though it’s a much cooler location. JFK had record heat into early November last year with the developing drought. So fall record heat has been a constant in recent years. JFK September and October numerous near and record highs since 2015 9/1 92 in 2012 92 in 2010 91 in 1969+ 9/2 93 in 1973 93 in 1961 93 in 1953 9/3 93 in 2015 93 in 1993 92 in 1957 9/4 93 in 2018 93 in 1985 92 in 1961 9/5 94 in 1961 93 in 2023 92 in 1985+ 9/6 93 in 2023 92 in 1985 90 in 1998+ 9/7 93 in 1983 92 in 2023 92 in 1978 9/8 92 in 2010 91 in 2015 87 in 2013+ 9/9 93 in 1959 91 in 2016 88 in 1964 9/10 98 in 1983 92 in 1989 90 in 1961 9/11 96 in 1983 91 in 1989 89 in 1961 9/12 91 in 1981 90 in 2005 90 in 1952 9/13 94 in 1952 89 in 1994 89 in 1957 9/14 89 in 1995 89 in 1972 88 in 1981+ 9/15 85 in 2008 82 in 2009 82 in 1997+ 9/16 89 in 1991 88 in 1998 88 in 1970 9/17 90 in 1991 84 in 2015 84 in 1969 9/18 90 in 1965 86 in 2021 86 in 1964+ 9/19 90 in 1983 87 in 2024 85 in 2022+ 9/20 85 in 1997 85 in 1983 84 in 2024 9/21 85 in 2016 83 in 2004 83 in 1989 9/22 91 in 1980 87 in 1961 86 in 1970 9/23 90 in 1970 89 in 1961 88 in 2017+ 9/24 92 in 2017 88 in 1970 86 in 1961 9/25 87 in 2010 85 in 2017 83 in 2011 9/26 87 in 1970 85 in 1958 82 in 1968 9/27 89 in 1998 87 in 2017 84 in 2014+ 9/28 82 in 1948 81 in 1961 81 in 1959+ 9/29 82 in 1948 81 in 2019 81 in 1959 9/30 84 in 1986 82 in 1959 80 in 1971+ 10/1 85 in 1986 84 in 1954 84 in 1950 10/2 95 in 2019 85 in 2013 82 in 2002+ 10/3 84 in 2002 82 in 2000 81 in 1969 10/4 84 in 1967 83 in 1959 83 in 1954 10/5 84 in 1967 83 in 2017 83 in 2002+ 10/6 88 in 1997 85 in 1995 83 in 1959 10/7 83 in 2007 83 in 1961 82 in 1997 10/8 90 in 2007 78 in 1959 77 in 2021 10/9 87 in 2011 82 in 1961 82 in 1959 10/10 86 in 1997 84 in 2017 84 in 2011 10/11 80 in 1960 77 in 2017 77 in 1969+ 10/12 83 in 1969 81 in 1962 79 in 1995+ 10/13 79 in 1995 78 in 2008 77 in 1989 10/14 82 in 1990 82 in 1975 80 in 2021 10/15 82 in 1975 79 in 2000 78 in 1990 10/16 79 in 2008 77 in 1964 76 in 1963 10/17 82 in 1963 76 in 1996 75 in 2016+ 10/18 77 in 1964 75 in 2016 75 in 2006 10/19 86 in 2016 75 in 1965 74 in 1998+ 10/20 81 in 1969 79 in 2021 79 in 1984 10/21 81 in 1963 80 in 1949 78 in 2024 10/22 80 in 2024 77 in 1984 77 in 1975 10/23 77 in 1978 74 in 2007 73 in 2017 10/24 74 in 2017 73 in 2001 72 in 2024+ 10/25 77 in 2001 73 in 2022 73 in 2021+ 10/26 78 in 1971 75 in 1989 75 in 1963 10/27 78 in 1963 75 in 1989 73 in 1964 10/28 81 in 2023 76 in 2010 75 in 1989+ 10/29 80 in 1971 74 in 2015 74 in 2014+ 10/30 79 in 1961 77 in 1950 73 in 2024+ 10/31 78 in 2024 75 in 1950 74 in 2004+ 11/1 82 in 2024 80 in 1950 77 in 1982
 -
Old Davis still ticking. 1.41" yesterday, high of 89.9. 7.65" for the month, passing July's total of 7.24".
-
 90F here as of noon.
 -
 I just looked through these and even for Newark that 99 in September 1983 hasn't been matched. Didn't they exceed 100 like Central Park did in September 1953?
 -
12Z UKMET: dips down to 16.4N vs 17.0N on 0Z; recurves at 68.7W vs 66.5W on 0Z; so still a safe recurve for Conus: TROPICAL STORM ERIN ANALYSED POSITION : 17.3N 35.4W ATCF IDENTIFIER : AL052025 LEAD CENTRAL MAXIMUM WIND VERIFYING TIME TIME POSITION PRESSURE (MB) SPEED (KNOTS) -------------- ---- -------- ------------- ------------- 1200UTC 12.08.2025 0 17.3N 35.4W 1008 31 0000UTC 13.08.2025 12 16.7N 39.3W 1008 29 1200UTC 13.08.2025 24 16.4N 42.2W 1008 27 0000UTC 14.08.2025 36 16.7N 45.0W 1007 29 1200UTC 14.08.2025 48 17.6N 48.5W 1008 31 0000UTC 15.08.2025 60 18.6N 51.8W 1008 31 1200UTC 15.08.2025 72 19.8N 55.4W 1006 31 0000UTC 16.08.2025 84 20.7N 58.6W 1005 32 1200UTC 16.08.2025 96 21.6N 61.6W 1001 37 0000UTC 17.08.2025 108 22.3N 64.2W 998 44 1200UTC 17.08.2025 120 23.3N 66.3W 998 48 0000UTC 18.08.2025 132 24.8N 67.7W 996 42 1200UTC 18.08.2025 144 26.9N 68.6W 992 52 0000UTC 19.08.2025 156 28.8N 68.7W 988 48 1200UTC 19.08.2025 168 30.7N 68.0W 980 58
-
Yeah but a place like Newark is ALWAYS hot lol. I'm talking about the rest of the area, 7 90 degree days in September peaking at 99 in September 1983 is a record that's never been touched....unless you go back to 1953 when it was 100+ in September.
-
Gorgeous day! Nearly perfect summer
-
That’s exactly what a TC would look like in a stable airmass lol.
-
That HCCA trend is interesting
-
The warm spots like Newark have had plenty of September and October record heat in recent years. Just notice all the records and near records since 2015. This is why the tropical system tracks are going to be so important as we head into the fall. Since parts of the area have had their driest summer on record so far. We will need an assist from the tropics in either lowering heights or providing rainfall. If one or both of these factors fail to materialize, then there is nothing stopping more heat and ridging into the fall with an expansion of drought. Newark September and October record and near record highs since 2015 9/4 95 in 2018 95 in 1973 95 in 1964 9/5 95 in 2023 94 in 1985 94 in 1961 9/6 98 in 2018 97 in 2023 97 in 1983 9/7 96 in 2023 95 in 2015 93 in 2010 9/8 98 in 2015 94 in 1939 93 in 2010+ 9/9 94 in 1964 93 in 2016 92 in 1971+ 9/10 98 in 1983 97 in 1989 95 in 1931 9/11 99 in 1983 96 in 2013 96 in 1964+ 9/12 95 in 1961 93 in 2005 90 in 1952+ 9/13 94 in 2005 94 in 1952 93 in 1957+ 9/14 94 in 2016 92 in 2008 92 in 1931 9/15 94 in 1993 91 in 2021 91 in 1942 9/16 95 in 1991 92 in 1970 91 in 1958+ 9/17 95 in 1991 93 in 1972 91 in 1994 9/18 90 in 1992 90 in 1948 89 in 1965 9/19 93 in 1983 89 in 1946 88 in 2022+ 9/20 92 in 1983 88 in 1946 87 in 1985 9/21 90 in 1940 88 in 1998 88 in 1980 9/22 94 in 1970 93 in 1931 92 in 1980 9/23 94 in 1970 93 in 2019 93 in 1959 9/24 92 in 2017 92 in 1959 89 in 1970 9/25 91 in 1970 90 in 2017 90 in 2010+ 9/26 90 in 2007 90 in 1958 88 in 1970 9/27 91 in 1998 89 in 1933 88 in 2017 9/28 87 in 2014 86 in 2019 85 in 1954+ 9/29 89 in 1945 83 in 1959 82 in 2015+ 9/30 89 in 1986 85 in 1954 82 in 1960+ 10/1 85 in 1986 85 in 1950 84 in 2019+ 10/2 96 in 2019 86 in 2013 86 in 2002+ 10/3 85 in 2023 85 in 1950 84 in 2021+ 10/4 89 in 2013 87 in 2007 87 in 1959 10/5 93 in 1941 87 in 1967 86 in 2017 10/6 91 in 1959 90 in 1941 88 in 1997+ 10/7 88 in 1944 87 in 1946 85 in 1990 10/8 89 in 2007 85 in 1931 84 in 1990 10/9 88 in 2011 87 in 1990 86 in 1959+ 10/10 92 in 1949 90 in 1939 86 in 1958 10/11 88 in 1949 85 in 1954 83 in 1955 10/12 88 in 1954 86 in 1962 85 in 1949 10/13 89 in 1954 85 in 1995 83 in 1978 10/14 85 in 1975 83 in 1990 82 in 2021 10/15 86 in 1956 85 in 1960 84 in 2021+ 10/16 84 in 1958 83 in 1992 83 in 1963 10/17 90 in 1938 83 in 2016 82 in 1963 10/18 85 in 2016 80 in 1964 79 in 2007+ 10/19 87 in 2016 82 in 1945 81 in 1963 10/20 80 in 2021 80 in 1969 80 in 1947 10/21 84 in 2024 84 in 1947 81 in 2017 10/22 86 in 1979 83 in 2024 79 in 1984+ 10/23 87 in 1947 82 in 2024 82 in 1978 10/24 83 in 2001 78 in 1946 77 in 2017+ 10/25 79 in 2001 79 in 1963 78 in 2021 10/26 82 in 2023 79 in 1964 79 in 1963 10/27 81 in 1963 80 in 1947 78 in 2023+ 10/28 84 in 2023 82 in 1984 78 in 1989+ 10/29 78 in 1971 78 in 1946 76 in 1989 10/30 82 in 1946 80 in 1961 80 in 1950 10/31 83 in 2024 82 in 1946 79 in 1950
-
If anything the best chance for stuff is like late tomorrow afternoon/evening and overnight. 12z HRRR is pretty active late afternoon/early evening (looks like RRFS will be too). Regardless though should be a rapid weakening of activity with east extent.
-

Occasional Thoughts on Climate Change
Typhoon Tip replied to donsutherland1's topic in Climate Change
https://phys.org/news/2025-08-europe-millions.html -
-
translation: the weaker she stays, the further west and south she drifts
-
12Z Icon 168 hr 150 miles NNE of that ominous 0Z Icon 180 hr map. Has less ridging and is moving NW to NNW instead of NW to WNW.
-
Shine on you weenie diamond.
-
SAL baby