All Activity
- Past hour
-
Yeah, the only 12Z op with this as a TCG is the GFS though a few of its ensembles also have a TC (more noisy than earlier runs). Thus, I’m taking the GFS with a huge grain.
-
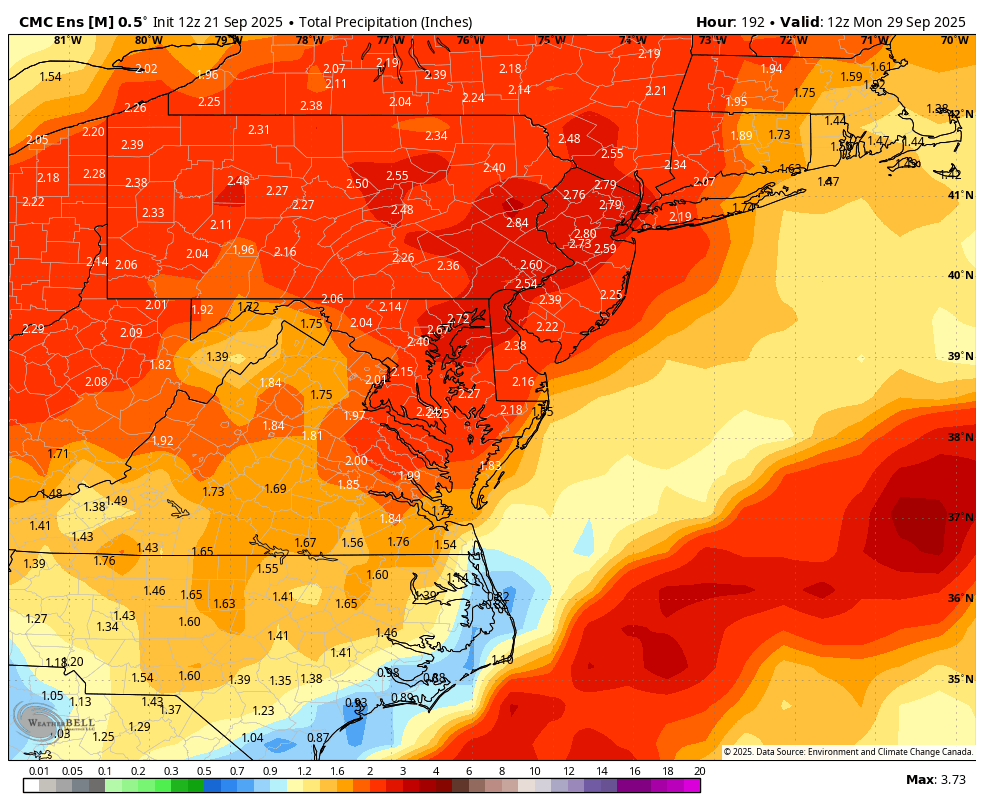
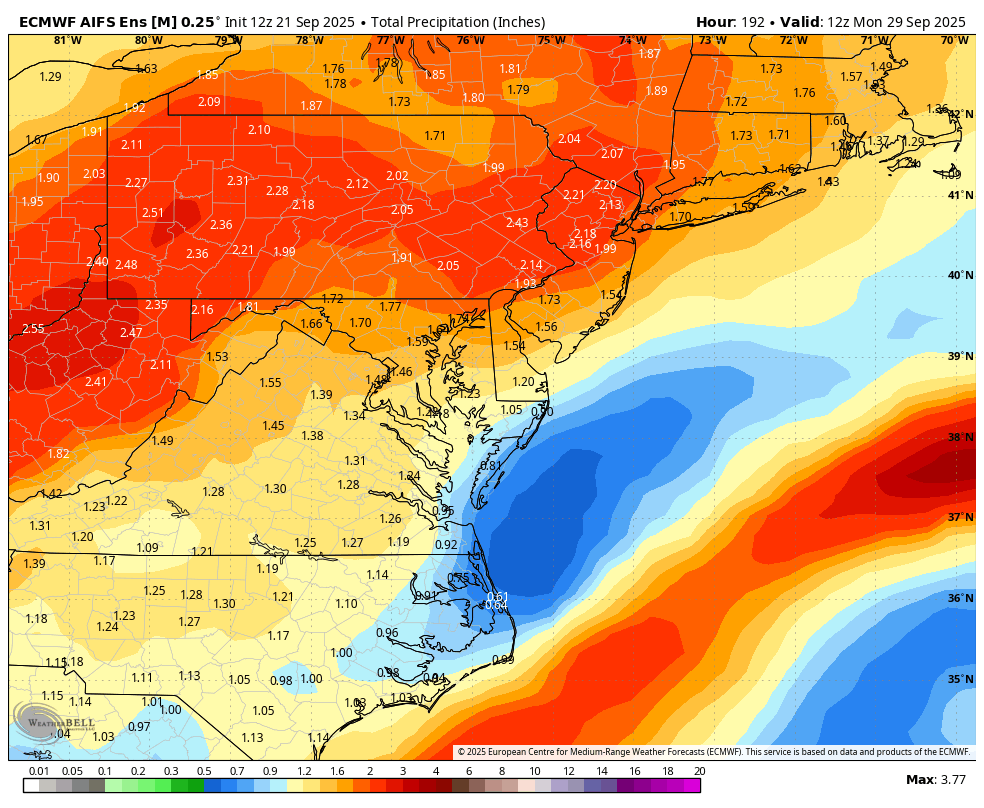
Should see some rain here. Euro looked wet.
-
Let's hope, my new lawn needs rain
-
I continue to fear what late seasons are capable of producing based especially on the recent past. Having 3 of the 7 most active Oct-Dec periods ACEwise (70+) during just the last 9 seasons is not comforting at all. Moreover, 3 of the last 6 (50%) La Niña seasons (2024 per RONI counts as La Niña) were in these top 7! The one somewhat comforting thing, however, is the relative slowness of 2025 so far and how that affects the chances for a highly active Oct-Dec. There appears to be some correlation between how active a season is prior to Oct and how active is a season Oct-Dec, which means that having a relatively slow season through Sep does appear to reduce the chance for a very active Oct-Dec (50+ ACE) somewhat vs that chance when pre-Oct isn’t slow: Seasons with 50+ ACE during Oct-Dec: Year/pre-Oct ACE/Oct+ ACE 2024: 78/84 2020: 106/75 2016: 59/80 2005: 171/75 1969: 93/57 1963: 49/63 1961: 134/55 1950: 157/54 1932: 87/82 1894: 59/76 1893: 159/73 1887: 123/59 1878: 84/97 Per this list based on each era’s normal ACE, the pre-Oct ACE for these 13 very active Oct-Dec was as follows: - 6 MA normal (2005, 1961, 1950, 1893, 1887, 1878) - 3 AN (2020, 1969, 1932) - 1 NN (1894) - 3 BN (2024, 2016, 1963) So, 50+ Oct-Dec years have been heavily biased toward pre-Octs that were active. Where is 2025 headed for pre-Oct? Through Gabrielle, the prog is for ~~55. Then there’s the current MDR orange. The consensus has this as TS Humberto by 9/26-7 and a H soon after. That would have a realistic potential of 10-15 ACE 9/26-30. So, that would get total 2025 pre-Oct ACE to as much as ~65-70. That compares to 94 for the 1991-2020 pre-Oct avg, which means 2025 pre-Oct will end up solidly BN just about regardless of what Gabrielle and Humberto do. What does this tell me? With 2025 almost definitely headed for BN pre-Oct, the chance for a 50+ Oct-Dec is <50%. However, 2024, 2016, and 1963 as well as 3 of the most active 7 Oct-Dec on record having occurred just within the last 6 La Niña seasons also say don’t bet the farm on <50 for Oct-Dec at least as of yet.
-
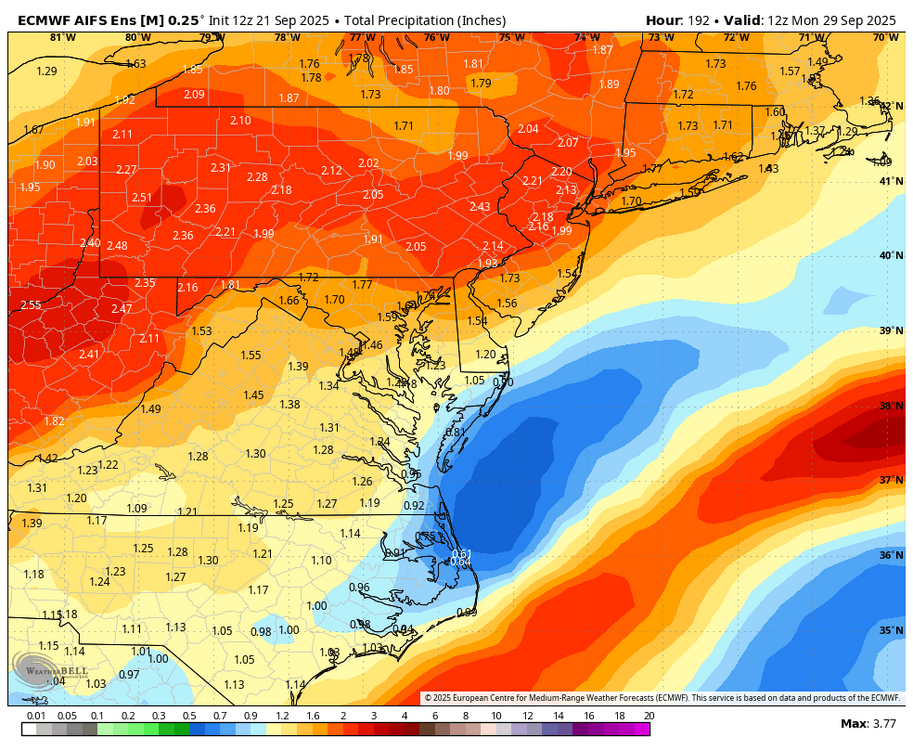
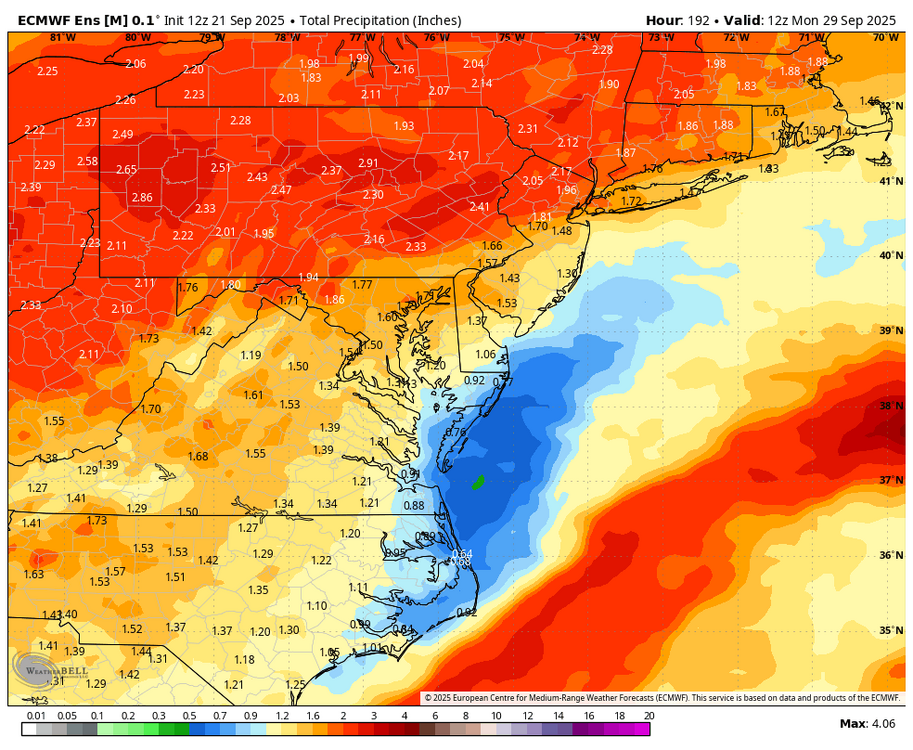
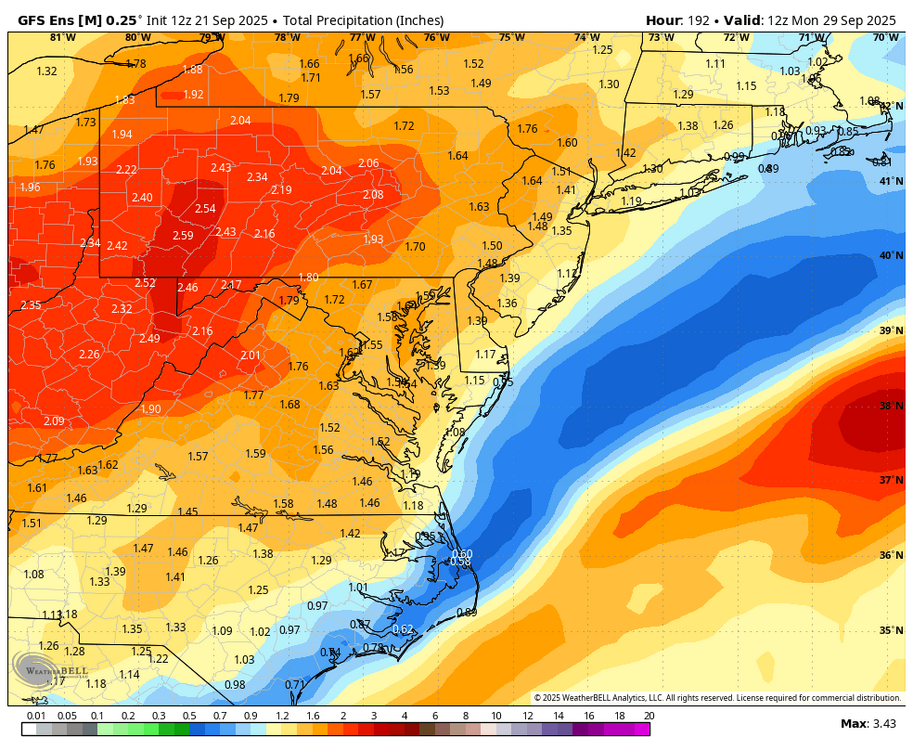
WB 12Z ensembles thru Day 8. Welcome rain still on the map!

-
Wagons north finally . Or good luck is over
-

September 2025 OBS-Discussion centered NYC subforum
bluewave replied to wdrag's topic in New York City Metro
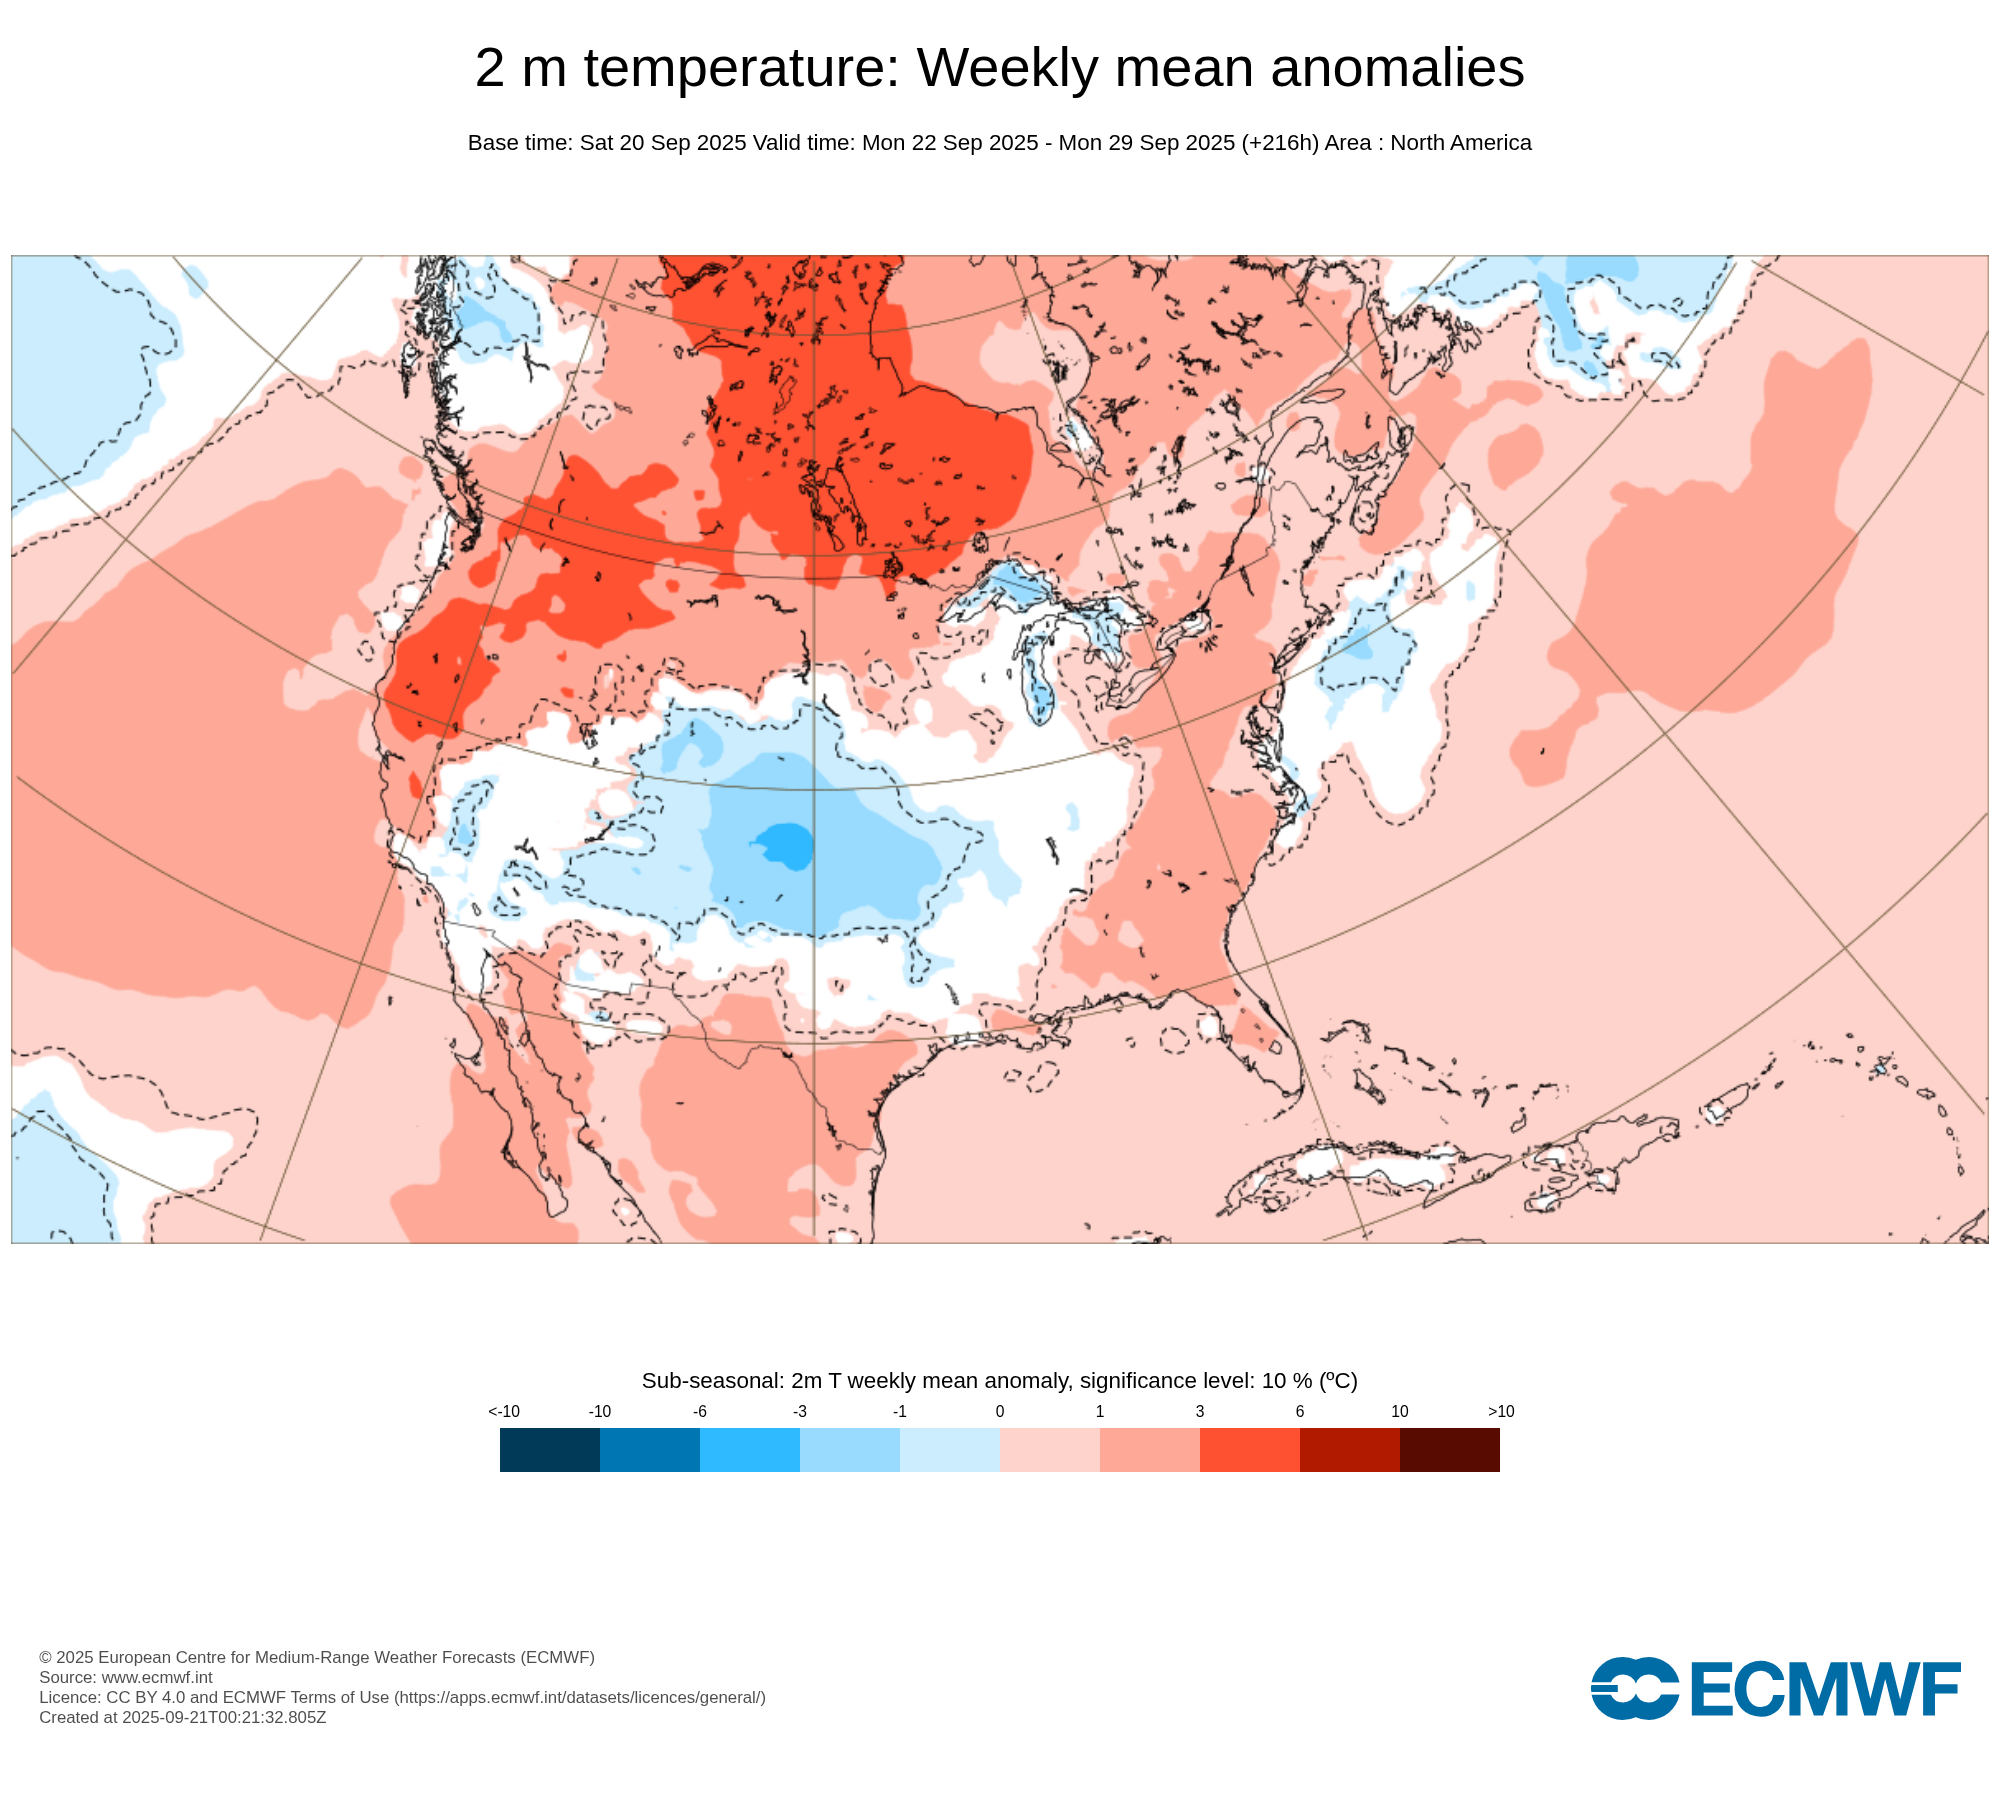
We’ll see if a piece of the over the top warm up in Canada near the end of September can build down into the Northeast in October.
-

2025 Atlantic Hurricane Season
WxWatcher007 replied to BarryStantonGBP's topic in Tropical Headquarters
NHC has now designated that lead wave as a lemon. The GFS and AI ensembles have been more bullish on development odds while the Euro has basically nothing until the 12z run. -
That area is now a lemon. The GFS goes wild with it but the Euro is far more lukewarm.
-

September 2025 OBS-Discussion centered NYC subforum
LibertyBell replied to wdrag's topic in New York City Metro
Are we more sensitive to drought now than we were in the 1980s? I feel like the kind of rainfall we are experiencing right now is similar to what we had back then but it's being taken more seriously now? -
September 2025 OBS-Discussion centered NYC subforum
LibertyBell replied to wdrag's topic in New York City Metro
But yesterday was cool too, under 80 is good, below 70 not so much. Today is at or above 70 so it's okay but not as pristine as yesterday was. -

September 2025 OBS-Discussion centered NYC subforum
Sundog replied to wdrag's topic in New York City Metro
Great for walking and being outside. And I prefer the cooler temps. -
I continue to fear what late seasons are capable of producing based especially on the recent past. Having 3 of the 7 most active Oct-Dec periods ACEwise (70+) during just the last 9 seasons is not comforting at all. Moreover, 3 of the last 6 (50%) La Niña seasons (2024 per RONI counts as La Niña) were in these top 7! The one somewhat comforting thing, however, is the relative slowness of 2025 so far and how that affects the chances for a highly active Oct-Dec. There appears to be some correlation between how active a season is prior to Oct and how active is a season Oct-Dec, which means that having a relatively slow season through Sep does appear to reduce the chance for a very active Oct-Dec (50+ ACE) somewhat vs that chance when pre-Oct isn’t slow: Seasons with 50+ ACE during Oct-Dec: Year/pre-Oct ACE/Oct+ ACE 2024: 78/84 2020: 106/75 2016: 59/80 2005: 171/75 1969: 93/57 1963: 49/63 1961: 134/55 1950: 157/54 1932: 87/82 1894: 59/76 1893: 159/73 1887: 123/59 1878: 84/97 Per this list based on each era’s normal ACE, the pre-Oct ACE for these 13 very active Oct-Dec was as follows: - 6 MA normal (2005, 1961, 1950, 1893, 1887, 1878) - 3 AN (2020, 1969, 1932) - 1 NN (1894) - 3 BN (2024, 2016, 1963) So, 50+ Oct-Dec years have been heavily biased toward pre-Octs that were active. Where is 2025 headed for pre-Oct? Through Gabrielle, the prog is for ~~55. Then there’s the current MDR orange. The consensus has this as TS Humberto by 9/26-7 and a H soon after. That would have a realistic potential of 10-15 ACE 9/26-30. So, that would get total 2025 pre-Oct ACE to as much as ~65-70. That compares to 94 for the 1991-2020 pre-Oct avg, which means 2025 pre-Oct will end up solidly BN just about regardless of what Gabrielle and Humberto do. What does this tell me? With 2025 almost definitely headed for BN pre-Oct, the chance for a 50+ Oct-Dec is <50%. However, 2024, 2016, and 1963 as well as 3 of the most active 7 Oct-Dec on record having occurred just within the last 6 La Niña seasons also say don’t bet the farm on <50 for Oct-Dec at least as of yet.
-
September 2025 OBS-Discussion centered NYC subforum
bluewave replied to wdrag's topic in New York City Metro
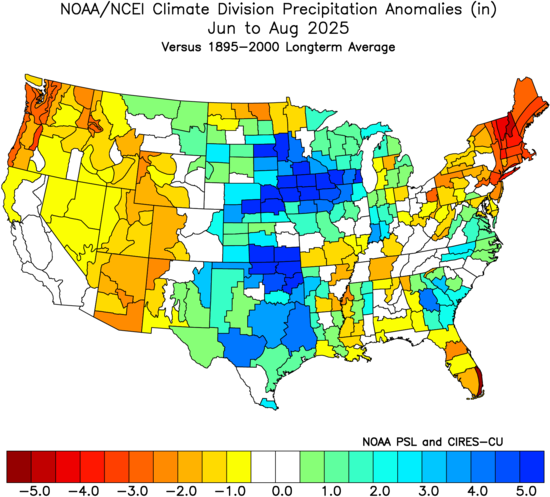
This summer was much drier in New England than 2010 was leading to the record low streamflows that some areas are experiencing.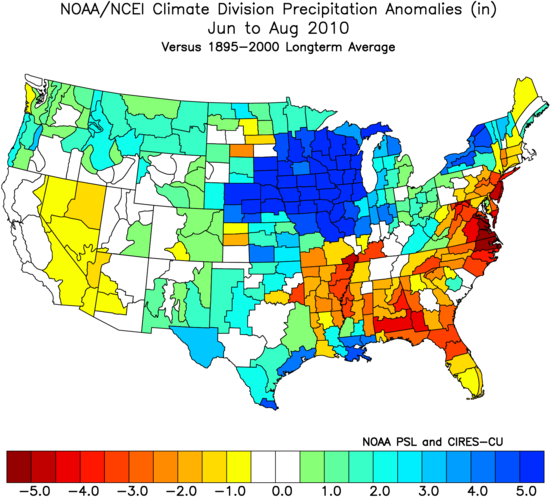
-
September 2025 OBS-Discussion centered NYC subforum
LibertyBell replied to wdrag's topic in New York City Metro
Too cloudy, yesterday was much better. -
Models are pretty wet up here midweek…maybe Friday too.
- Today
-
September 2025 OBS-Discussion centered NYC subforum
Sundog replied to wdrag's topic in New York City Metro
What a day today! -
This is 24% of normal thru 9-21.
-
Justice Hill has -7 yards rushing for the season. Henry was completely shut down last week against the Browns. Bold prediction: Harbaugh will once again decide to make the dynamic Keaton Mitchell inactive on Monday night.
-

September 2025 OBS-Discussion centered NYC subforum
Stormlover74 replied to wdrag's topic in New York City Metro
2000 was a cool summer -
.16" last night makes .77" total rain for Sept.
-
September 2025 OBS-Discussion centered NYC subforum
LibertyBell replied to wdrag's topic in New York City Metro
wild I don't remember 2000 being so dry (or hot for that matter) -
September 2025 OBS-Discussion centered NYC subforum
LibertyBell replied to wdrag's topic in New York City Metro
1999 and 2002 were two of my favorite summers, I don't mind yellow or brown grass, it feels nice and crunchy How does this summer compare for dryness to 2010 where you are Chris?? -
Occasional Thoughts on Climate Change
LibertyBell replied to donsutherland1's topic in Climate Change
I'm glad to see we are going back to a drier pattern on the east coast, some of those high rainfall flooding years were truly unbearable -
Occasional Thoughts on Climate Change
LibertyBell replied to donsutherland1's topic in Climate Change
For our area specifically though, while the number of heatwaves might be getting higher, their average length is much shorter than it used to be. So we are getting 3-4 heatwaves of 3-4 days each in length in our hottest summers vs 2 heatwaves of 7+ days in length like we used to in some of our hottest summers (1944, 1949, 1953, 1955, 1966, 1980, 1983, 1988, 1993, 1999, 2002). The last of the type of summers that had multiple 7+ day heatwaves was 2002 here.