All Activity
- Past hour
-
39.9. Wind stayed up
-

Fall 2026 Med/Long range discussion
BeastFromTheEast replied to Brian D's topic in Lakes/Ohio Valley
Morch-like -
Very wet fall so far for the Southwest. Second wettest October on record for Flagstaff, with another significant storm likely this coming weekend.
-
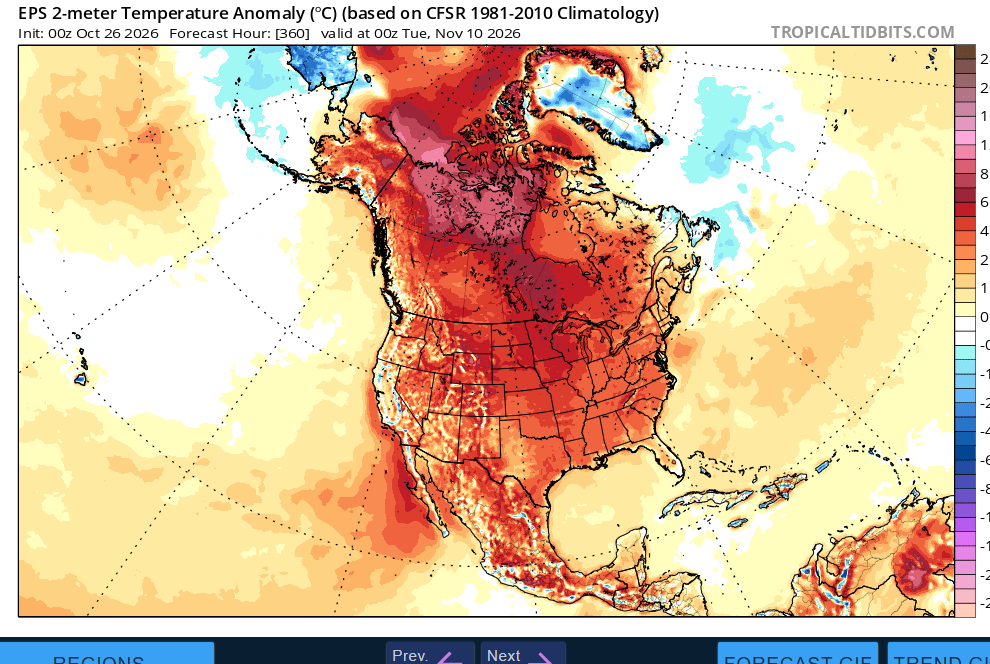
not often you see ensembles in such agreement on hemisphere wide torch
-
October 2026 General Discussion
BeastFromTheEast replied to SchaumburgStormer's topic in Lakes/Ohio Valley
I’ve got a feeling we’re going to see a “Morch 2012” type of torch somewhere in the region these upcoming months. All the ingredients seem to be in place for something historic! -
Up to 57F now lol. My drive to work went 38F to 46F back to 34F over 8 minutes and then up to 53F over the next 8 minutes.
-

2026-2027 Record-breaking El Nino
GaWx replied to Stormchaserchuck1's topic in Weather Forecasting and Discussion
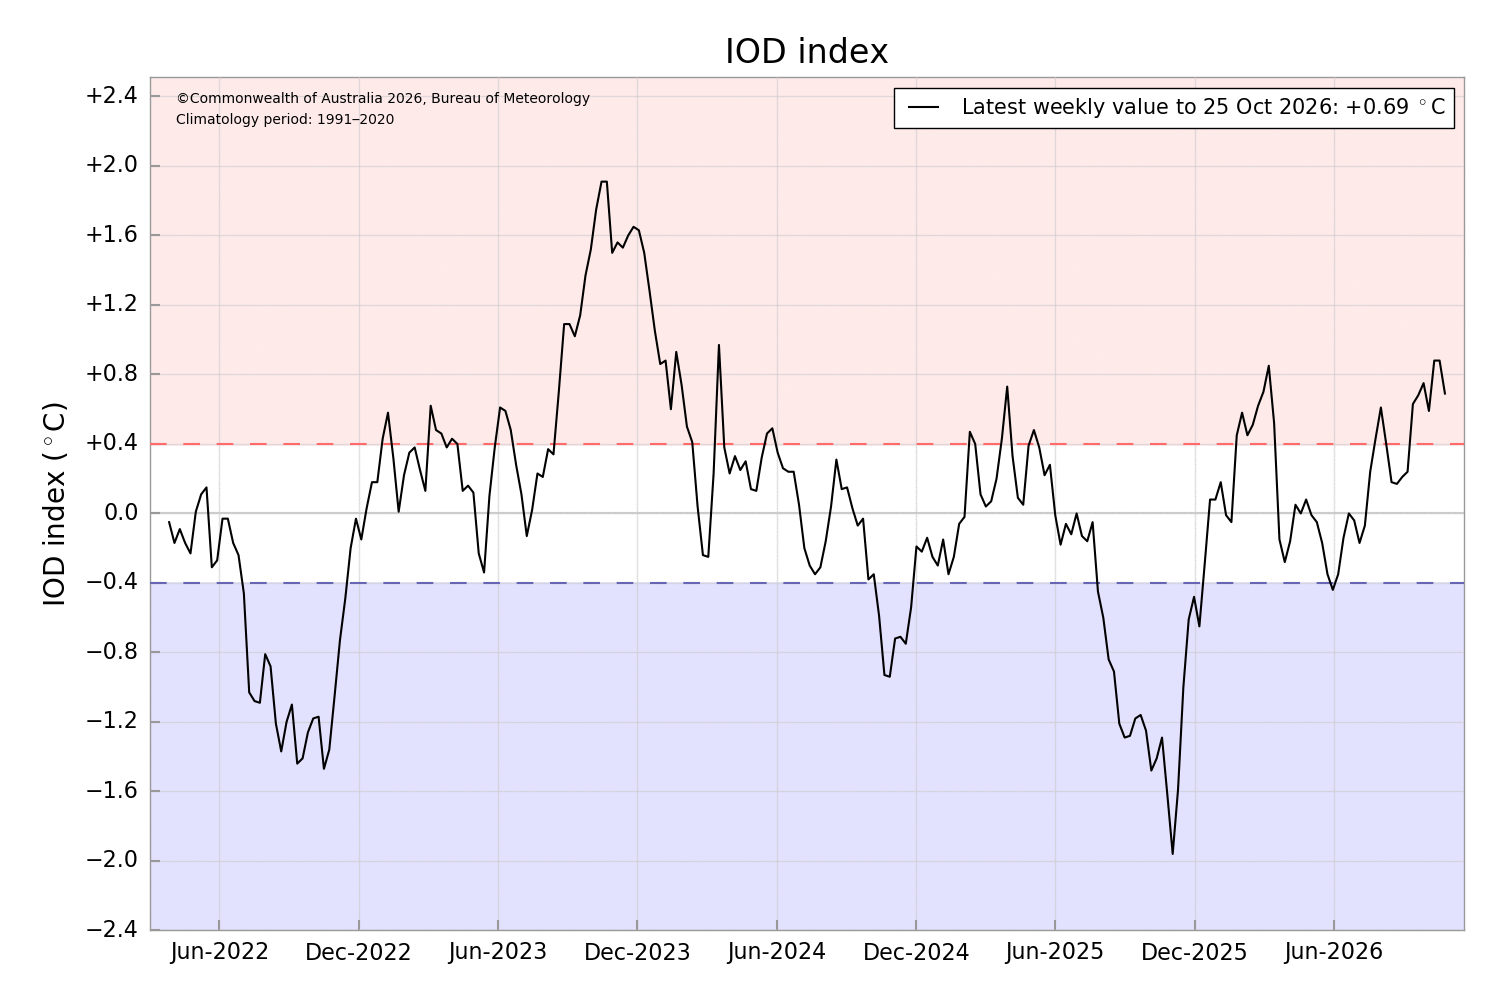
Today’s IOD release (avg for 10/19-25) came in at +0.69 vs the +0.88 of the prior week: 20260831,20260906,0.24 20260907,20260913,0.63 20260914,20260920,0.68 20260921,20260927,0.75 20260928,20261004,0.59 20261005,20261011,0.88 20261012,20261018,0.88 20261019,20261025,0.69 https://www.bom.gov.au/clim_data/IDCK000072/iod_1.txt?1791781094025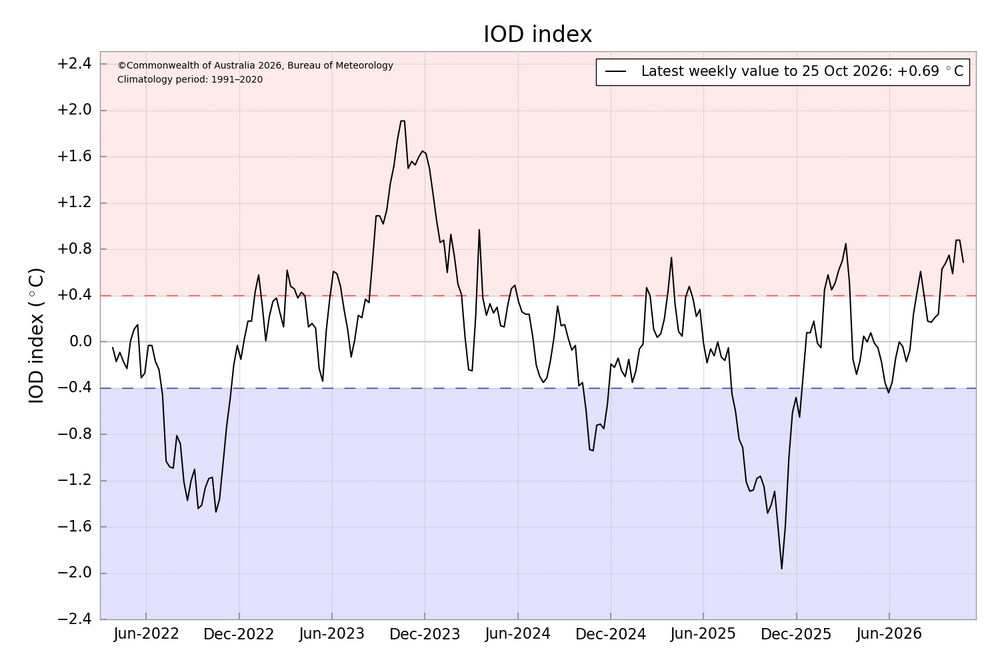
-
October 2026 General Discussion
BeastFromTheEast replied to SchaumburgStormer's topic in Lakes/Ohio Valley
Get used to it, fall/spring shoulder seasons are never going to be the same. Can pretty much extend the summer season a couple of months locally these days. Super early spring and a warm fall is a lock around these parts. Idk how familiar you are with local wx history but you should look up the historic March 2012 heatwave. Endless days of 80s to near 90 in the middle of the month across the MW! 94 in South Dakota on 3/18! The change has been happening long before “Morch 2012“ but it seems like that mega torch was a key milestone where a switch was flipped. -
Last time the Vikings were 6-0 was 2009 that was a good winter...just sayin
-
 reputable indian pharmacies for otc drugs: ZenithIndusRx - order drugs online
 -
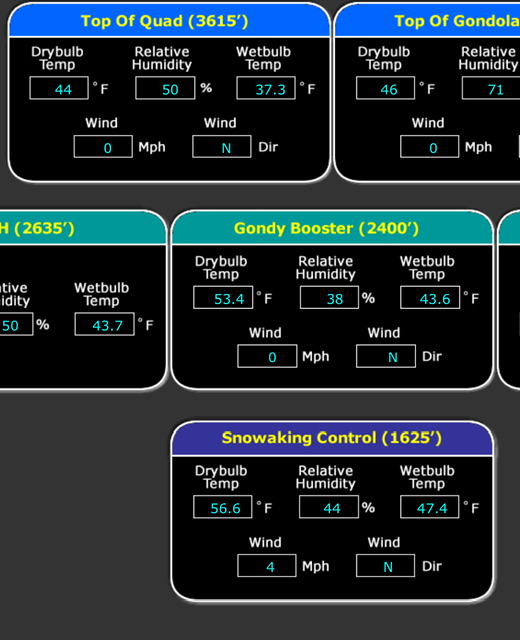
Yesterday boasted the grandest diurnal change I've seen 'round deez parts... 44 to 46 F swing was common within 10 miles of my location, both home stations and tweener NWS sites. [EDIT, 38-43 ...helps when you're not looking at WC columns. still impressive] Today may exceed that differential where has this cold drain phenomenon occurred.
-
Probably gonna be a 42-43 diurnal here today
-
Ravens have the 2nd highest paid defense in the NFL Top 10 Most Expensive NFL Defenses in 2026 thesportscast.net Pittsburgh Steelers – $195.4 M (64.9% of cap) Baltimore Ravens – $187.4 M (62.2%) Chicago Bears – $177.9 M (59.1%) New York Giants – $174.7 M (58.0%) New England Patriots – $169.0 M (56.1%) Washington Commanders – $165.8 M (55.1%)
-
Yep about 20 degrees difference between me and Kev as well last 2 mornings.
-
Very foggy this morning. Surprised the statement didn’t stretch to the coast.
-
It's remarkable ... the autumn of the great unbalanced RAD proficiency continues. It's 48 at ORH ap, 28 here... Granted that's 800' of difference but 20F is about as extreme a still morning difference/RAD result as I've ever seen.
-
Today will be toasty. Good day for lunch outside.
-
Man, I can’t drive 55.
-
Falls Lake is 245.76 Feet so we are about 2-3 days from reaching the summer low.
-
Last night was the sharpest inversion yet. Below freezing in the valley but like 20F higher (50F) like 500ft above. It’s 30F at MVL but 55F (!) at 1,500ft.
-
Just missed the 30’s this morning, 40.1 Just absolutely amazing weather. Give me this every day of the fall (throw some rain in too)
-
Just unmitigated boredom coming up, but I guess I’ll take the nice stretches of weather.
-
2026-2027 Record-breaking El Nino
GaWx replied to Stormchaserchuck1's topic in Weather Forecasting and Discussion
The NOAA relative weeklies released this morning: -Nino 3.4 warmed slightly to +2.5. It remains at record levels for the time of year with it way ahead of the 2nd warmest, +2.0 of 2015. The record for any week is +2.9 of 12/29/82. -Nino 3’s +3.6 is much warmer than the 2nd warmest for the week, +2.9 of 1997 and it also ties the warmest for any week, 12/29/1982. -Nino 1+2’s +4.4 remains much warmer than its 2nd warmest for the week, +3.6 of 1997. Its warmest for any week is the +4.6 of 1998. 30SEP2026 4.5 3.3 2.3 0.1 07OCT2026 4.4 3.4 2.4 0.2 14OCT2026 4.4 3.5 2.4 -0.1 21OCT2026 4.4 3.6 2.5 0.0 https://www.cpc.ncep.noaa.gov/data/indices/rel_wksst9120.txt -
It’s kind of funny I’ll look at my thermometer and then as I walk outside in the dark to go to the gym, you can hear the leaves rustling in the wind. The wind just does not stop on my hill.
-
40.5 here but frost 60’ lower.