All Activity
- Past hour
-
whats the optical zoom on that? 10X I think thats the max for a cell phone and it also has built in image stabilization?
-
Looks like everyone was where they were supposed to be today lol
-
true, and a high of 103 in August in 2001, something that has very rarely happened. Besides that day, I think there's been only one other time NYC has hit 100 in August in my life and that was in 1983.
-
Could have some nice bangers Friday with good CGs. Lots of MUCAPE and steep lapse rates around
-

2025 Atlantic Hurricane Season
LongBeachSurfFreak replied to BarryStantonGBP's topic in Tropical Headquarters
If anything delayed formation favors a home grown season. Further west of the MDR box water temps and OHC are still significantly above normal. While overall ace and named storm numbers may end up below hyperactive, an impactful season still looks likely. A rapidly intensifying storm on approach has much more damage potential then a decaying former MDR major. -
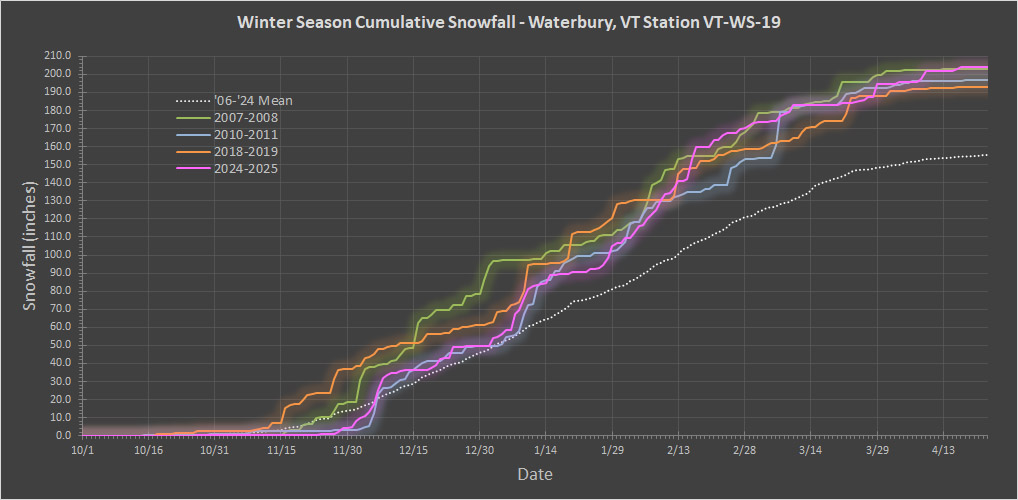
We’re into June and the snow season should be complete here in the valley, so I’ve put together the summary snow data for the 2024-2025 winter season at our site. It was another solid season, right up there with 2007-2008, 2010-2011, and 2018-2019 in terms of snowfall as the plot below shows. These types of seasons are in that top 20% of the data set for snowfall, so something that happens roughly every 5 years on average. The three big midwinter months of December, January, and February were above average on snowfall, but the rest of the months were below average or close to average at best. That meant the season didn’t really break away from the rest of the pack, but if you’re going to have only three months be above average on snowfall, those midwinter months are the ones to do it still and still get a solid season. It wasn’t a season for huge storms with only two storms over 18 inches, but it felt like a decent season for upslope snow. Total Snowfall: 204.1” October Snowfall: 0.5” November Snowfall: 4.0” December Snowfall: 45.1” January Snowfall: 59.5” February Snowfall: 62.1” March Snowfall: 23.6” April Snowfall: 9.3” May Snowfall: 0.0” Total Days with Snowfall: 116 October Days with Snowfall: 2 November Days with Snowfall: 7 December Days with Snowfall: 25 January Days with Snowfall: 28 February Days with Snowfall: 25 March Days with Snowfall: 19 April Days with Snowfall: 10 May Days with Snowfall: 0 Snowstorms: 61 October Storms: 1 November Storms: 5 December Storms: 14 January Storms: 14 February Storms: 14 March Storms: 10 April Storms: 3 May Storms: 0 Average Snowfall per Storm: 3.3” Largest Storm: 22.7” 2nd Largest Storm: 18.8” 3rd Largest Storm: 9.3” 4th Largest Storm: 9.1” 5th Largest Storm: 8.2” Sum of 5 Largest Storms: 68.1” Storms ≥10": 2 Date of Largest Storm: 1/6/25 Earliest Frozen Precipitation: 10/16/24 Earliest Accumulating Snowfall: 10/27/24 Earliest 1" Storm: 11/28/24 Earliest 2" Storm: 11/29/24 Earliest 3" Storm: 12/2/24 Earliest 4" Storm: 12/3/24 Earliest 6" Storm: 12/7/24 Earliest 8" Storm: 12/7/24 Earliest 10" Storm: 1/8/25 Earliest 12" Storm: 1/9/25 Latest Accumulating Snowfall: 4/17/25 Latest Frozen Precipitation: 4/17/25 Length of Snowfall Season: 173 days Start of Season Snowpack: 11/28/24 October days with Snowpack: 0 November days with Snowpack: 3 December days with Snowpack: 31 January days with Snowpack: 31 February days with Snowpack: 28 March days with Snowpack: 31 April days with Snowpack: 15 May days with Snowpack: 0 Days with >0" Snowpack: 139 Days with >0.5" Snowpack: 122 Days with ≥1" Snowpack: 116 Days with ≥2" Snowpack: 107 Days with ≥3" Snowpack: 103 Days with ≥4" Snowpack: 99 Days with ≥6" Snowpack: 82 Days with ≥8" Snowpack: 66 Days with ≥10" Snowpack: 54 Days with ≥12" Snowpack: 48 Days with ≥24" Snowpack: 11 Days with ≥36" Snowpack: 0 Max Snow Depth: 34.0” Date of Max Snow Depth: 2/17/25 End of Season Snowpack: 4/13/25 Continuous Snowpack Season: 137 days Snow-Depth Days: 1346.0 inch-days Total liquid equivalent: 22.51” Frozen liquid equivalent: 12.31” % Frozen L.E.: 54.7% Total Snow/Total Liquid Ratio: 9.07 Total Water Content: 11.0% Total Snow/Frozen Liquid Ratio: 16.58 Frozen Water Content: 6.0%

-
Nice to see warm temps but no big severe in sight for weeks? perhaps months or even years? sucks
-
This system was a dud for a large swath of sw through ne Iowa, where not much rain fell.... following days of models dropping 1+" across most of the state. I was lucky to get 0.53", with only a couple very low rumbles. Models are showing very little rain, again, for the next week+.
- Today
-
NNE summers. Rain, flies, and domestic disputes.
-
Maybe it’s a climo thing? Not sure why, but never heard of them down this way, but for years I heard about them in NNE.
-
They need clean running water to breed. Not sure there’s any left in E MA.
-
Never had an issue. Only thing that bites around here are mosquitoes and sometimes those green heads at the beach.
-
Yeah just the annoying ones. Honestly haven’t experienced black flies until I went to NH earlier in the season like around Mem Day. Holy crap I got mauled.
-

Chester County PA - Analytical Battle of Actual vs. Altered Climate Data
chubbs replied to ChescoWx's topic in Climate Change
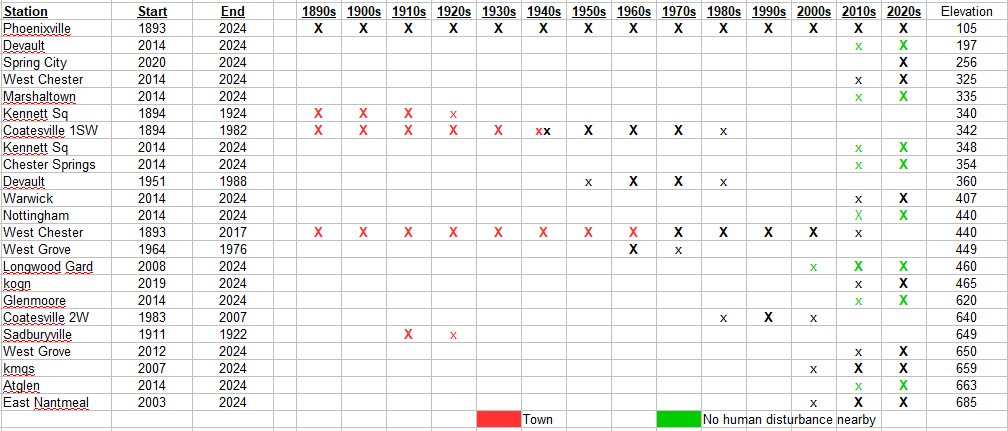
Your chart isn't raw station data. It's a station network average.If the station network is changing the station average will not match raw data from a single station. Per table below, there are 3 major periods: 1893-1948 = all stations in towns and built-up areas, 1948 - 1970 = transition out of towns, 1971 - present = in suburban or rural. Your chart has spurious cooling in the transition period due to station moves and station start-ups in more rural areas. I have plotted raw data from West Chester before the move and Coatesville after the move because there is an overlap period between 1948 and 1969, which allows the stations to have a consistent baseline. This provides a dataset without major station changes from 1893 to present. Phoenixville also provides long-term data at a single location. That's the main difference between my chart and yours. I have taken out the station moves and you have left them in. The big differences between us is in the transition period.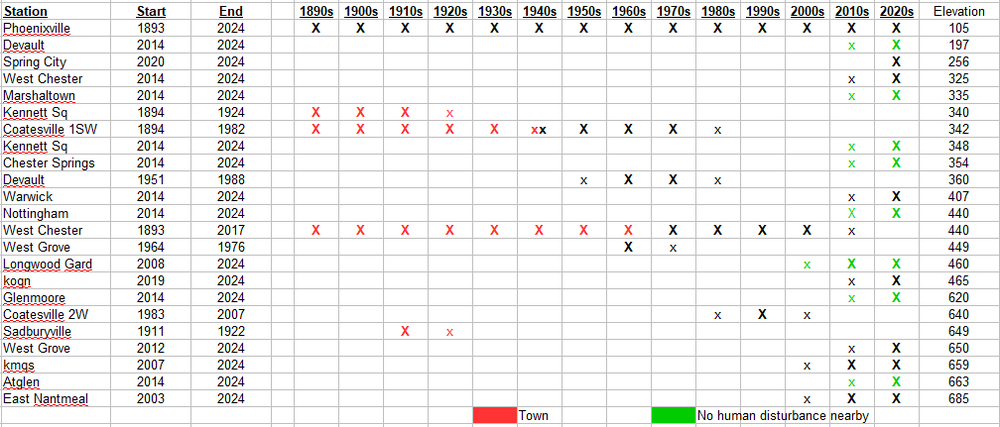
-
easier to enjoy outdoorsy wx in May/June as hornet/wasp populations are down. A wet later summer into early fall does help make them slightly less aggressive, I know you hate that.
-
Making our way towards discussing spiders.
-
what in the hell is going on...
-
Ran across this one on a different board and just had to share so we could all bask in the retro glory... https://weatherstar.netbymatt.com/ And if that's not retro enough for you... https://weatherstar3000.netbymatt.com/
-
Came in here round 6pm. I opened all the windows to cool the house an hour ago and my eyes are burning a bit now. edit: there are surely multiple allergens causing that but the smoke was visible up high.
-
Same here. They had been few and far between through may. A bigger more aggressive population all of a sudden. I would gladly take a week of hot and dry right now to knock the insects down a bit.
-
82 was mine.
-
Not sure if someone locally is having a fire or if the Canadian smoke has made its way here, but I can smell smoke draining in through the windows. Looked like it was creeping in here in the final vis shots of the evening.
-
Lighter colored hats are better then the darker colored ones.
-
That's a whole different level of aggression. Yellow Jackets and White Faced Hornets are not to be f'd with, at least as far as their nesting area goes.


.thumb.png.4150b06c63a21f61052e47a612bf1818.png)

