All Activity
- Past hour
-
 Table of forecasts for September 2025 FORECASTER _______________ DCA _NYC _BOS _ORD _ATL _IAH __DEN _PHX _SEA Scotty Lightning _____________ +1.5 _+1.0 _+1.0 _ +1.0 _+1.5 _+1.5 __+1.0 _+1.5 _+0.5 Roger Smith _________________ +1.0 _+1.0 _+1.0 _ +1.5 _+1.5 _+1.5 __+2.0 _+2.0 _+2.0 hudsonvalley21 ______________ +0.3 _-0.2 _-0.3 _-0.6 _+0.5 _+0.2 __+0.5 _+1.0 _+1.5 yoda _________________________ +0.3 _-0.3 _-0.6 _+0.4_+0.9 _+1.0 __+1.3 _+1.4 _+2.7 DonSutherland1 ______________+0.2 _ -0.1 _ 0.0 _ +0.4 _+0.3 _+0.8__+1.8 _+1.7 _+3.2 RJay _________________________+0.1 _ +0.1 _ +0.1 _ +0.5 _ 0.0 _ +1.1 __+2.0 _+2.0 _+2.2 ___ Normal ____________________0.0 __0.0 __0.0 ___0.0 __0.0 __0.0 ___ 0.0 __0.0 __0.0 wxallannj ____________________ -0.2 _-0.4 _-0.3 _-0.8 _+0.2 _+0.5 __+1.0 _+1.5 _+2.5 ___ Consensus ______________-0.2_-0.3 _-0.3 _-0.6 _ 0.0 _ +0.9 __+1.0_+1.4_+1.9 so_whats_happening ________-0.3 __0.0 _ +0.2 _+0.3 _-0.5 _ -0.5 __+1.2 _+1.4 _+1.3 Tom _________________________ -0.9 _-1.2 _ -1.1 __ -1.5 _ -0.8 _ +1.1 __ +1.5 _+0.6 _+1.8 BKViking _____________________-1.9 _ -2.1 _ -1.8 _ -2.3 _-0.5 _-0.4 __+1.0 _+1.8 _ +0.4 RodneyS _____________________-2.3 _ -0.9 _-0.8 _ -2.2 _-2.3 _+0.9 __+0.3 _+0.5 _+1.8 wxdude64 ___________________-2.5 _ -1.6 _ -0.9 _ -2.6 _-0.8 _ +0.5 __-0.6 _+0.7 _+1.9 StormchaserChuck1 _________ -2.6 _ -2.0 _-1.6 _ -3.5 _-0.8 _ -0.1 __ +0.5 _+0.4 _+3.0 ============ ___ Persistence _______________ -3.6 _-2.3 _-2.1 __-0.5 _-2.0 _+1.7 __+0.9 _+3.8 _+1.4 ________________________ Warmest and coldest forecasts (not including Persistence) are color coded. Normal is also coldest for PHX and SEA. Persistence is colder than all forecasts for NYC and BOS, and warmer for IAH and PHX. (by small margins except for PHX)
 -
82/50 at CON today. Avg 66…normal 66. Right on the money.
-
It’s Stein . There is zero severe threat
-
Lol... Right. Normal high temp.for today is 77. But yeah .. we're burning up!!!
-
Some yellows se of Baltimore today. Probably drought related as much as cool temps.
-
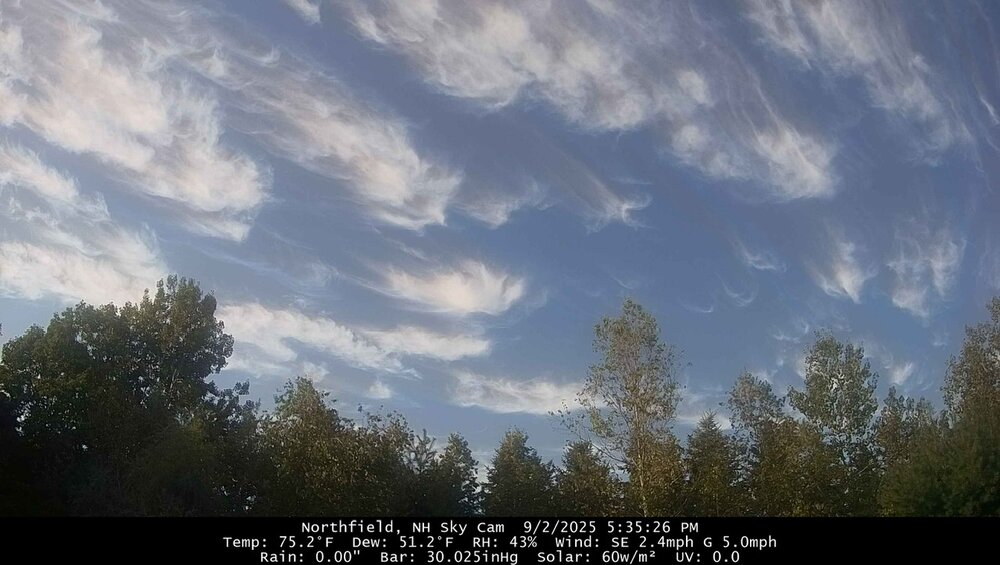
Loving these cirrus with fallstreaks to the north right now.
-
Saturday brings the better chance of some severe storms as instability increases and lift arrives in the form of a cold front. Details will ride on exact timing and stregth of this front, how unstable we can get ahead of it, etc.
-
It has been 2.5 weeks without rain. The lawns have de-greened quite a bit. We could use a good soak again.
-
In theory the atmosphere should be even more nina like than last year. La Niña development started taking off around a month ago, and will likely be stronger than it was last year in late fall. Whether it lasts long enough to register as an official La Niña by ONI is uncertain, but it doesn’t really matter. At this point, the logical assumption is to expect weak la Niña conditions this winter.
- Today
-

September 2025 OBS-Discussion centered NYC subforum
donsutherland1 replied to wdrag's topic in New York City Metro
Generally cool and dry conditions will persist through tomorrow. Highs will generally top out in the upper 70s with lows in the 50s outside New York City and low 60s in New York City. It will turn somewhat warmer late in the week with highs on Thursday through Saturday reaching the lower and possibly middle 80s before another cooler air mass moves into the region. A system could bring some showers on Friday. Another round of showers is possible late Saturday into Sunday. The ENSO Region 1+2 anomaly was -0.3°C and the Region 3.4 anomaly was -0.4°C for the week centered around August 27. For the past six weeks, the ENSO Region 1+2 anomaly has averaged +0.33°C and the ENSO Region 3.4 anomaly has averaged -0.32°C. Neutral ENSO conditions will likely continue into early autumn. The SOI was -1.42 today. The preliminary Arctic Oscillation (AO) was +0.304 today. -
September 2025 OBS-Discussion centered NYC subforum
donsutherland1 replied to wdrag's topic in New York City Metro
Since 1869, there were 26 cases prior to 2025 where August saw < 2" of rain. Just over two-thirds (69%) went on to see a drier than normal (historical 1869-2024 baseline) September. Of those dry September cases, 61% then saw above normal rainfall in October, but 39% experienced another month of below normal rainfall (again using the historic baseline). Anticipating that the question might be raised concerning snowfall in the winter that follows, the shaded regions had the highest frequency of < 20", < 15", and < 10" snowfall. The non-shaded regions had the highest frequency of 30" or more snowfall (with or without the August precipitation constraint). Nevertheless, the statistical relationship is weak.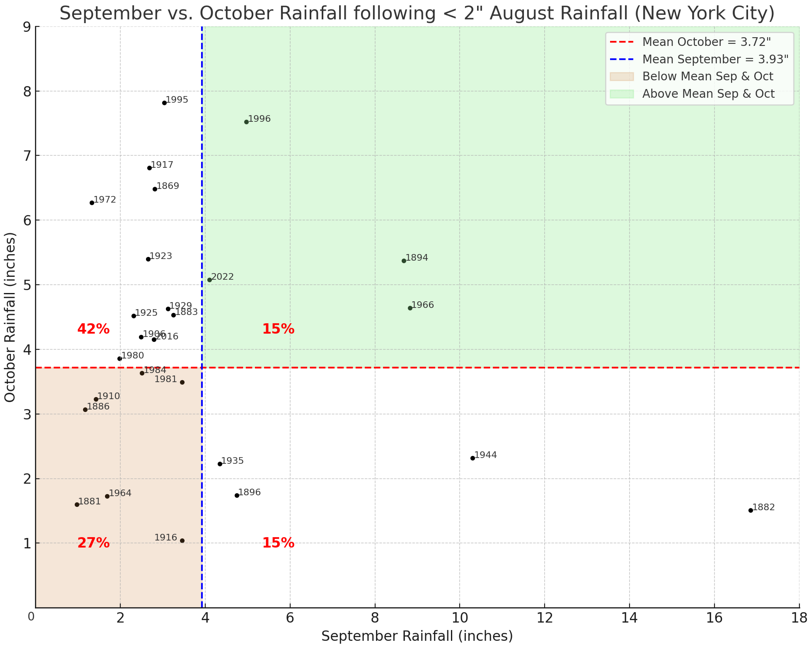
-

September 2025 OBS-Discussion centered NYC subforum
Sundog replied to wdrag's topic in New York City Metro
Extra dry falls ruins the foliage. It sucks -
Actually, 'General Sherman' the 120 year old maple at the corner of the lot and looming shade producer ... is sadly beginning to change now... The earliest I've seen that happen. I'm worried about the big guy. But... he may just be responding to something environmental that permeates the landscape. Because this is happening up and down Rt 2 and 91 between Rt 2 and Worcester. Early juts of color. Some of it looks dull and diffusing green/beiges.. .dryness probably plays a role? I'm also wondering if the smoke days at mid summer may have f-ed with the foliage.
-
That guy and DirectWeather are at the top of my $hit list for ignoring.
-
By then heat is manageable....like mid March arctic bouts. Sun is modifying air masses at this point.
-
No, but better.
-
I agree. I also am keene on the idea of a mid winter SSW, for whatever that is worth...I know those are a mixed bag.
-
12 EPS have b2b majors hitting land, with gabby hitting bermuda and humerto hitting louisiana/texas but focusing on gabby this is what we have innit
-

2025 Atlantic Hurricane Season
BarryStantonGBP replied to BarryStantonGBP's topic in Tropical Headquarters
some of the ensembles have been getting quite low in terms of pressure for "humberto" concerning, how did Milton Keynes form again? -

2025-2026 ENSO
michsnowfreak replied to 40/70 Benchmark's topic in Weather Forecasting and Discussion
Upon further analysis - apparently it wasnt as extreme as I thought. The nighttime lows really did the lifting from late June thru July, but not the entire summer. June High/Low: +2.3F / +2.1F July High/Low: +1.2F / +2.6F August High/Low: -0.9F / -1.4F December High/Low: +1.8F / +2.2F January High/Low: -2.4F / -3.0F February High/Low: -2.4F / -1.4F -
2025-2026 ENSO
michsnowfreak replied to 40/70 Benchmark's topic in Weather Forecasting and Discussion
Very interesting...here its BY FAR most noticeable in summer. Winter mins still tank on clear nights. The only thing that holds them up is an overcast Great Lakes night, often accompanied by snow showers, while west of Lake MI will be clear and cold. Theres no comparison between summer and winter mins. -
@BarryStantonGBPsignal for Gulf activity midmonth is there. We’ll see is all I can say now.
-

September 2025 OBS-Discussion centered NYC subforum
Brian5671 replied to wdrag's topic in New York City Metro
Dry begets dry. I think 3 of the last 4 summers/fall here have been dry. -
First, I know they try, but since there are so many stations that haven't existed since 1901, they are obviously filling in blanks. Where they received that info and how it's calculated makes or breaks it's accuracy. The fact is, Capital City airport in the northern tip of York County was +2.2 and +2.5 for June/July going back to 1939 and York Airport since the start of recording back to 1998, at the southern end of York County, was +2.1 and 2.9. They have York County at +4.1. That map has the the entire County in +3-5. So we're relying on exactly what to piece temps? As for the recent heat, it means nothing to me. I'm not scared.
-
September 2025 OBS-Discussion centered NYC subforum
Sundog replied to wdrag's topic in New York City Metro
The lack of rain is very annoying