All Activity
- Past hour
-

July 2025 Discussion-OBS - seasonable summer variability
LibertyBell replied to wdrag's topic in New York City Metro
well 2010 really stands out Tony only time we had a 1966 type of heatwave around here, one was 3 days in a row of 100+ the other one was 3 days out of 4 of 100+ what about sky conditions, how many of them since 2010 had clear blue skies Tony? -
Maybe the wording will come back but I noticed all mention of rain tonite was removed from my local (Columbia) NWS forecast, at least during the 1pm hour text forecast.
-
July 2025 Discussion-OBS - seasonable summer variability
LibertyBell replied to wdrag's topic in New York City Metro
Roger, did 1887 or 1917 have any 100 degree days? -

July 2025 Discussion-OBS - seasonable summer variability
SACRUS replied to wdrag's topic in New York City Metro
-
Occasional Thoughts on Climate Change
LibertyBell replied to donsutherland1's topic in Climate Change
Phoenix has set some absolutely amazing records the last few years and not just for one or two days but for the entire summer, Don! -

July 2025 Discussion-OBS - seasonable summer variability
Roger Smith replied to wdrag's topic in New York City Metro
You could also add 1887 (thinking of winter 1887-88) which had a very warm July, warmer than 1901. I guess it's not an invariable rule, there was nothing particularly severe about winters 1896-97, or 1953-54, but I would say you could add 1980 to your list because winter 1980-81 featured some extremely cold spells, it just wasn't a very snowy winter and it ended early (second half of Feb 1981 was probably top five in average temp). The summer of 1917 was not all that hot but a spell in late July and early August set a number of records. -
Occasional Thoughts on Climate Change
LibertyBell replied to donsutherland1's topic in Climate Change
Yes, the farther north you go the faster the warming. Boston has many many more 100 degree days than NYC in the last 12-13 years. Even Burlington is hotter. The lobsters are also migrating north, they used to have a colony near Long Island, which migrated to Maine which is now going even farther north to the Maritime Provinces. -

July 2025 Discussion-OBS - seasonable summer variability
steve392 replied to wdrag's topic in New York City Metro
Had to get my front mowed before it got to hot. Thank God for my locust tree that shades a good portion. Brutal out there. -
July 2025 Discussion-OBS - seasonable summer variability
SACRUS replied to wdrag's topic in New York City Metro
Past years One note and i will correct it for JFK in 2019 is 87
-

July 2025 Obs/Disco ... possible historic month for heat
40/70 Benchmark replied to Typhoon Tip's topic in New England
Stay safe -

July 2025 Obs/Disco ... possible historic month for heat
moneypitmike replied to Typhoon Tip's topic in New England
Suddenly overcast at pit2 -

July 2025 Obs/Disco ... possible historic month for heat
weatherwiz replied to Typhoon Tip's topic in New England
We might be in business for later...impressive CU field blowing up over SW NY -

July 2025 Obs/Disco ... possible historic month for heat
Lava Rock replied to Typhoon Tip's topic in New England
0.22" for the appetizer. Main event next Sent from my SM-S921U using Tapatalk -

July 2025 Obs/Disco ... possible historic month for heat
Torch Tiger replied to Typhoon Tip's topic in New England
Stabilizing light shower w/ no thunder popped up overhead. -

July 2025 Obs/Disco ... possible historic month for heat
Chrisrotary12 replied to Typhoon Tip's topic in New England
Well this is a dud of a cold pool. I did think it was pretty far north compared to past events. -

July 2025 Obs/Disco ... possible historic month for heat
NW_of_GYX replied to Typhoon Tip's topic in New England
Big let down here, no wind. -

July 2025 Discussion-OBS - seasonable summer variability
donsutherland1 replied to wdrag's topic in New York City Metro
The climate models couple the ocean and atmosphere in forecasting circulation changes. To date, the trends in the Southwest (including part of California) and Northeast are consistent with what is expected from the circulation changes. The 1960s were snowier, because the cold was so much greater than it has been recently. There was greater opportunity for precipitation to fall in the form of snow than there is today. During winters 1960-61 through 1969-70, the mean winter temperature was 32.6°, four winters had mean temperatures at or below 32°, with the warmest winter having a mean temperature of 35.9°. During 2010-11 through 2024-25, the mean winter temperature was 37.1° (above the warmest winter of the 1960s), the coldest winter was 32.7° (above the mean figure for the 1960s), and four winters had mean temperatures of 40° or above. The rapid increase in warmth has more than offset the wetter climate. As a result, New York City's snowfall is likely in the early stages of a secular decline. By the mid-2030s, it will be clear whether snowfall has truly entered a long-term decline, even as there will still be snowier cycles and snowier winters. I suspect that the 30-season mean snowfall figure will reach or fall below 20.0" at Central Park by the mid-2030s. -
85 at 12:30. Enjoy the weekend before significant humidity and heat come back Monday.
-
July 2025 Obs/Disco ... possible historic month for heat
Chrisrotary12 replied to Typhoon Tip's topic in New England
Congrats to me on the 30 seconds of rain and wind. -
July 2025 Obs/Disco ... possible historic month for heat
Lava Rock replied to Typhoon Tip's topic in New England
Gonna get rocked Sent from my SM-S921U using Tapatalk
-

July 2025 Obs/Disco ... possible historic month for heat
dryslot replied to Typhoon Tip's topic in New England
Under a warning now for those cells over the Lakes region moving east. -
July 2025 Discussion-OBS - seasonable summer variability
LibertyBell replied to wdrag's topic in New York City Metro
100 back to back days in 1901 would have been a really big deal wow!! -
Occasional Thoughts on Climate Change
donsutherland1 replied to donsutherland1's topic in Climate Change
For purposes of illustration, below is an example of why Shewchuk's arguments are deeply flawed. The illustration examines the change in Phoenix's mean summer minimum temperatures. Shewchuk's dismissal of adjusted data would mean that Phoenix's climate has seen summer minimum temperatures increase almost 1.5° per decade due to climate change (natural and anthropogenic). His claims would ignore the impact that the emergence and then rapid growth of Phoenix's Urban Heat Island Effect has had on summer minimum temperatures. In 1941, the beginning of the first 30-year period under consideration, Phoenix had a population of just over 65,000. In 2024, Phoenix's population was 1,682,515. During 1940-1980, Phoenix's population grew an average of 6.4% per year; since 1980, it has been growing at about 1.8% per year. The sharper rise in the raw data during the first part of the chart and flattening afterward provide a footprint of the growth in the UHI. If one were seeking to understand how fast Phoenix's climate has been warming, one would need to exclude artificial factors e.g., UHI. That's what the adjustments do. They remove the impacts of siting changes (location, features such as new buildings, etc.), UHI, time of observation bias, etc. The adjustments allow for comparability. They make robust scientific analysis possible.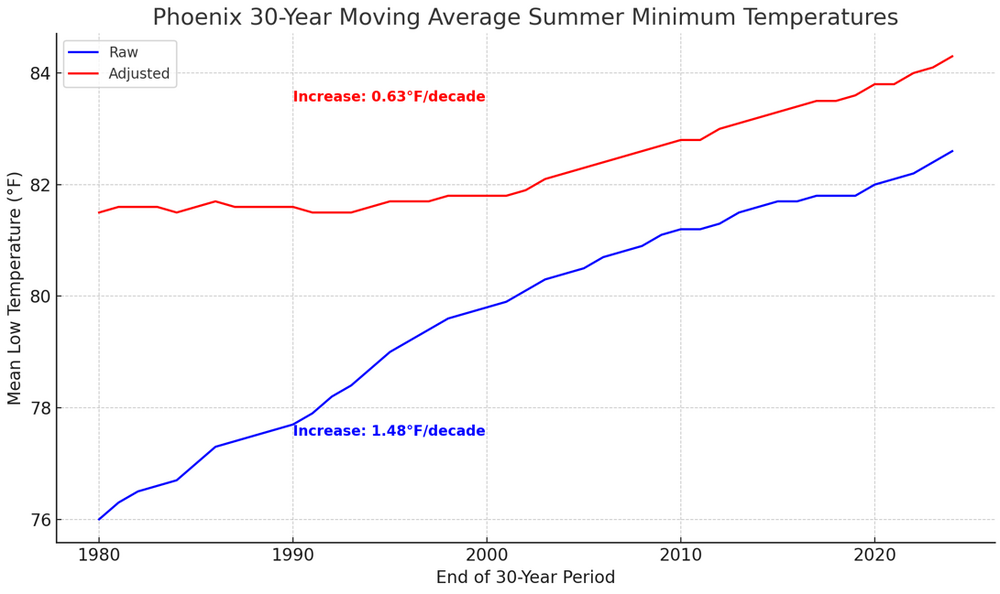
-
July 2025 Discussion-OBS - seasonable summer variability
LibertyBell replied to wdrag's topic in New York City Metro
It's fairly common to have really good winters after 100 degree heat in the summer (examples are 1933, 1944, 1955, 1966, 1977, 1993, 1995, 2010, 2013). -
July 2025 Discussion-OBS - seasonable summer variability
LibertyBell replied to wdrag's topic in New York City Metro
Another thing worth noting about the 60s is that although they were dryer, they had a lot more snow than the decades surrounding them-- my ideal combo, lots of snow in the winter and dry and hot weather in the summer. 1960-61, 1963-64 and 1966-67 were all classic and even historic winters.


