All Activity
- Past hour
-
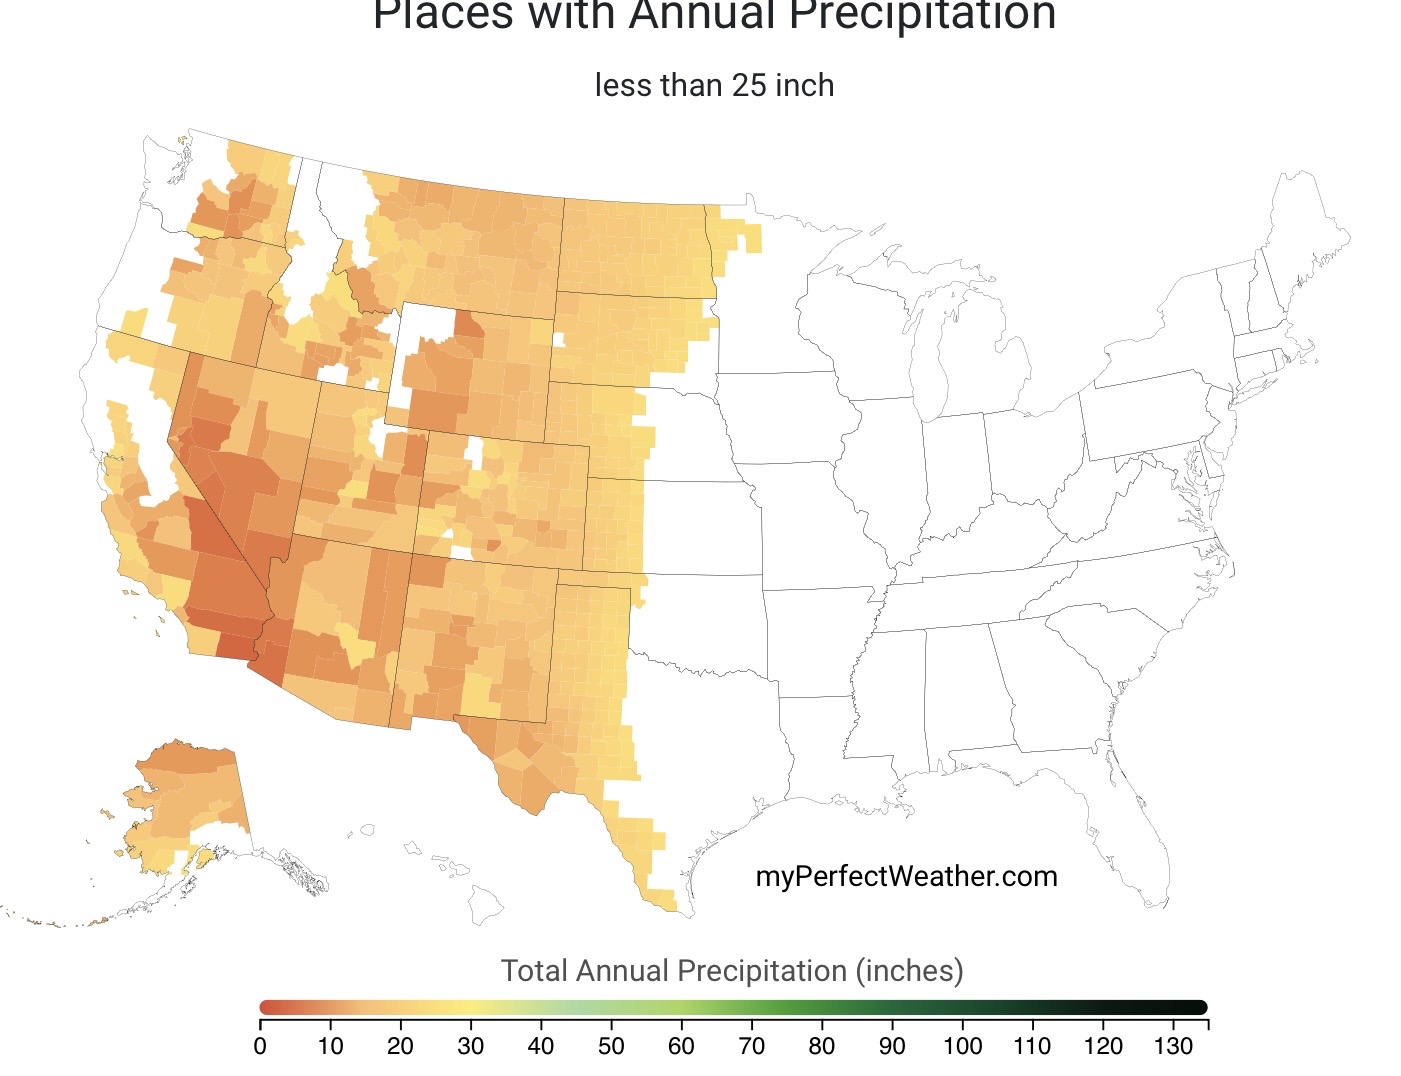
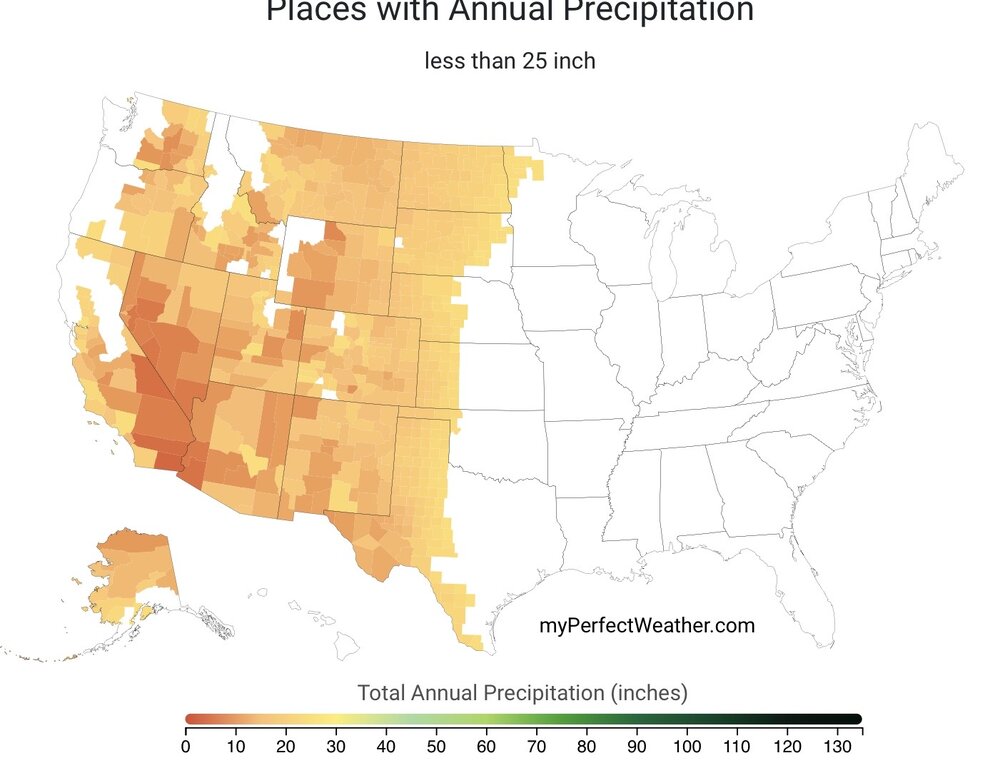
It sounds like you would enjoy the climate out West which averages under 25” a year of precipitation. Just had some friends get back from San Diego and they really loved it out there. We got close to that here back in the 1960s for a time.
-
like a lakes cutter and warm sw flow - clearing out now
-
1.32" here so far. Glad to get a good soaking after my area missed out last week.
-
This is troubling but a sample size of 2 is hard to draw strong conclusions
-

2026-2027 Super El Nino
GaWx replied to Stormchaserchuck1's topic in Weather Forecasting and Discussion
Hot off the press posted by a pro-met! “It does seem strange/off, comparing the CRW and OISST products on cyclonicwx doesn't show that discrepancy.” He then copied this from a NOAA website: “In the afternoon on Aug. 3rd, the ERSSTv5 will switch to ERSSTv6 because NCEI is discontinuing ERSSTv5. RONI values will change slightly. The weekly OISSTv2.1 data will remain unaffected.” -
1.10 rainfall here last 24 hours. Looking at reports with some areas SW of DC near 5 inches.
-

Augdewst 2026: Summer's Last Stand
TauntonBlizzard2013 replied to Prismshine Productions's topic in New England
Under a quarter inch here so far. Don’t spike the football yet -
Skies brightening here. Based on latest visible will be seeing breaks here over the next 60-90 minutes.
-
skies are brightning in eastern NJ as the precip is beginning to move east - expect to see some breaks in the cloud cover soon
-

Augdewst 2026: Summer's Last Stand
CoastalWx replied to Prismshine Productions's topic in New England
We knew. He did not know. -
 les donnГ©es de l'hГґpital catalogue de produits de santГ© pour homme http://tool.baiwanzhan.com/t1/pr.aspx?url=franceformen.online SanteHommeFrance [url=http://naiyoujc.ff66.net/productshow.asp?id=30&mnid=51913&url=http://franceformen.online]avis des instances mГ©dicales[/url] lire le rapport officiel
 -
2026-2027 Super El Nino
GaWx replied to Stormchaserchuck1's topic in Weather Forecasting and Discussion
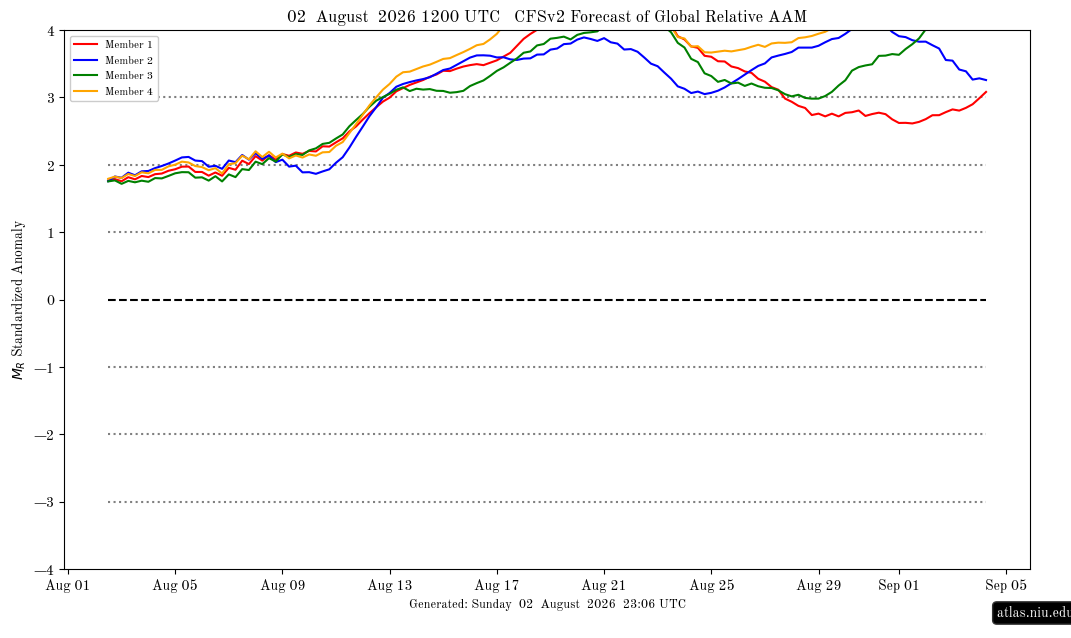
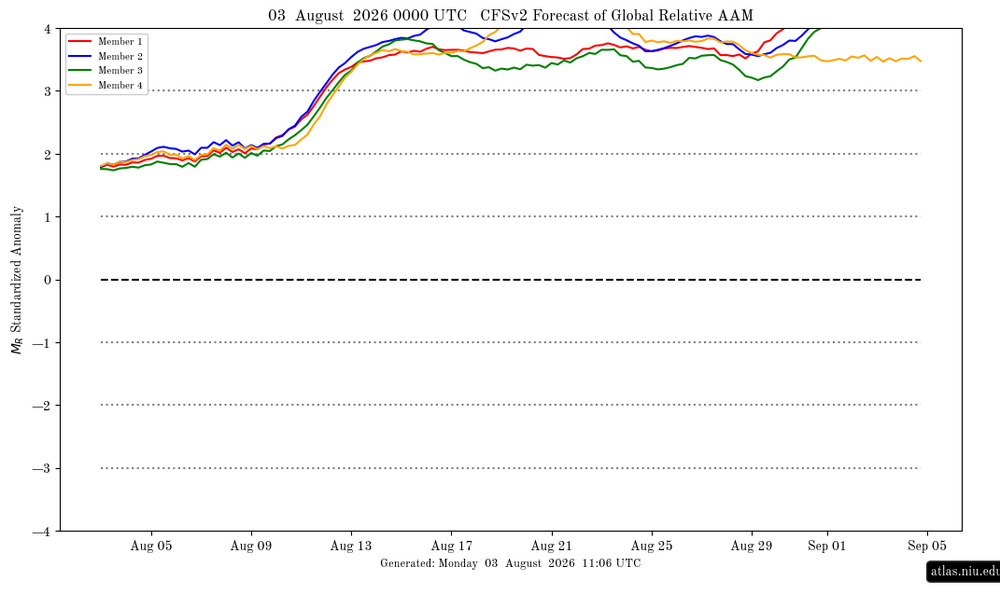
Here’s still another amazingly strong CFS AAM run (about as strong as any overall), the 0Z August 3rd run (I’ve seen/posted 4 amazing runs in a row). Check out the complete agreement of members exceeding a very strong amp of 3 on Aug 13th/day 11 and an even stronger 3.5 on Aug 14th/day 12, as early as I’ve seen in any run! It being early is very important since these quickly become increasingly unreliable due largely to an increasing + bias once much past day 14. The key days for me to watch are in and near Aug 11-14 as of now: @snowman19
-

Augdewst 2026: Summer's Last Stand
Ginx snewx replied to Prismshine Productions's topic in New England
Cloudy rainy 70 degree dews so much better than the COC days we just had, said no one -

super el nino banter thread
forkyfork replied to forkyfork's topic in Weather Forecasting and Discussion
i'm gay and he's cool with me -

E PA/NJ/DE Summer 2026 Obs/Discussion
MGorse replied to PhiEaglesfan712's topic in Philadelphia Region
Rain has ended. Total of 3.83 inches. Quite the deluge! -
Augdewst 2026: Summer's Last Stand
Ginx snewx replied to Prismshine Productions's topic in New England
4 inch stuff just to my south in Griswold and training -

Augdewst 2026: Summer's Last Stand
Damage In Tolland replied to Prismshine Productions's topic in New England
This has been the summer of the CTRV . Crush job after crushjob. Except EAHA) Using all qpf up in summer ? -

E PA/NJ/DE Summer 2026 Obs/Discussion
The Iceman replied to PhiEaglesfan712's topic in Philadelphia Region
4.2” overnight and this morning. Much needed! Seems like we only do flooding rains or drought this summer, no in between. -
Yeh keeps backfilling
-
crazy squall right now. blinding rain and winds gusting 35+
-
10.8” of snow for CPK with +5 all winter…yea for suck!
-
Yeah but this situation is unique, though...new GM but the manager just got there the previous year. I'm wondering if ownership would be on board with that... Because if you're trying to win with some of the players here...do you wanna put them through yet another managerial transition just a year later? Not to mention that would be kinda unfair to Alby too--You gonna do all that introduction this year and not even give him the courtesy of a second year after his rookie season? Ehh that would be kinda crappy from an organizational standpoint, imo I know some fans want it, but I don't know, man...
-

Augdewst 2026: Summer's Last Stand
Snowedin replied to Prismshine Productions's topic in New England
Dewy, steamy and about to get another good soaking of moisture. What more could one ask for in a New England summah? -
That video isn’t from this year. I think it was actually on the Corrotoman River on July 4th, 2022.
-
August 3 1896: A violent hailstorm destroys two thirds of the crops in Swift County. For Monday, August 3, 2026 1885 - A tornado hit Philadelphia and Camden along its eight mile path. (David Ludlum) 1970 - Hurricane Celia struck the coast of Texas producing wind gusts to 161 mph at Corpus Christi, and estimated wind gusts of 180 mph at Arkansas Pass. The hurricane was the most destructive of record along the Texas coast causing 454 million dollars damage, and also claimed eleven lives. (David Ludlum) (The Weather Channel) 1987 - A severe thunderstorm moved across Cheyenne, WY, during the mid afternoon. The thunderstorm produced hailstones up to two inches in diameter causing more than 37 million dollars damage. The eastern U.S. sweltered in the heat. A dozen cities reported record high temperatures for the date, including Paducah KY with a reading of 102 degrees. Beckley WV established an all- time record with an afternoon high of 93 degrees. (Storm Data) (The National Weather Summary) 1988 - Thunderstorms developing ahead of a slow moving cold front produced severe weather from the Central High Plains to the Upper Great Lakes Region. Thunderstorms around Fort Collins, CO, produced wind gusts to 74 mph along with marble size hail. Sixteen persons were injured in the storm, most of whom were accidently locked out of their office building, having evacuated it when the fire alarm went off, apparently triggered by lightning. (Storm Data) (The National Weather Summary) 1989 - Thunderstorms representing what remained of Hurricane Chantal drenched Wichita, KS, with 2.20 inches of rain in four hours during the early morning. Thunderstorms developing in Minnesota produced wind gusts to 85 mph at Baudette during the afternoon, and softball size hail at Lake Kabetogama, during the evening. Jamestown, ND, reported a record hot afternoon high of 103 degrees. (Storm Data) (The National Weather Summary) Observances: 3 Mon National Watermelon Day 3 Mon Big Forehead Day 3 Mon Clean Your Floors Day 3 Mon Cloves Syndrome Awareness Day 3 Mon National Grab Some Nuts Day