All Activity
- Past hour
-
Yeah we have started with some stuff and it was really just this week, but still largely sticks especially just out of the valley floor above 1,000ft. I can tell it’s about to explode though. Feel like we need another 1-2 days of sun and mild and it would go full green everywhere.
-

Central PA Spring 2026 Discussion/Obs Thread
mahantango#1 replied to Voyager's topic in Upstate New York/Pennsylvania
-
The 80s on Tuesday made a huge difference here. Trees started leafing out, fruit trees are flowering, and the catbird, orioles, and hummingbirds have returned. It just looks and sounds different out there.
-
A little better, but still seems too high compared to modeled 2m temps. What’s up with those times too? Max temps are 03:00 and mins closer to 12:00 or 15:00.
-
Low was 36.0 degrees, currently 37.1/32.8 degrees at 7:30 am with clear skies.
-
32F… kind of has a November vibe with not much greenery and still stick season. Weird with the long daylight though. Bring back the 70s.
-
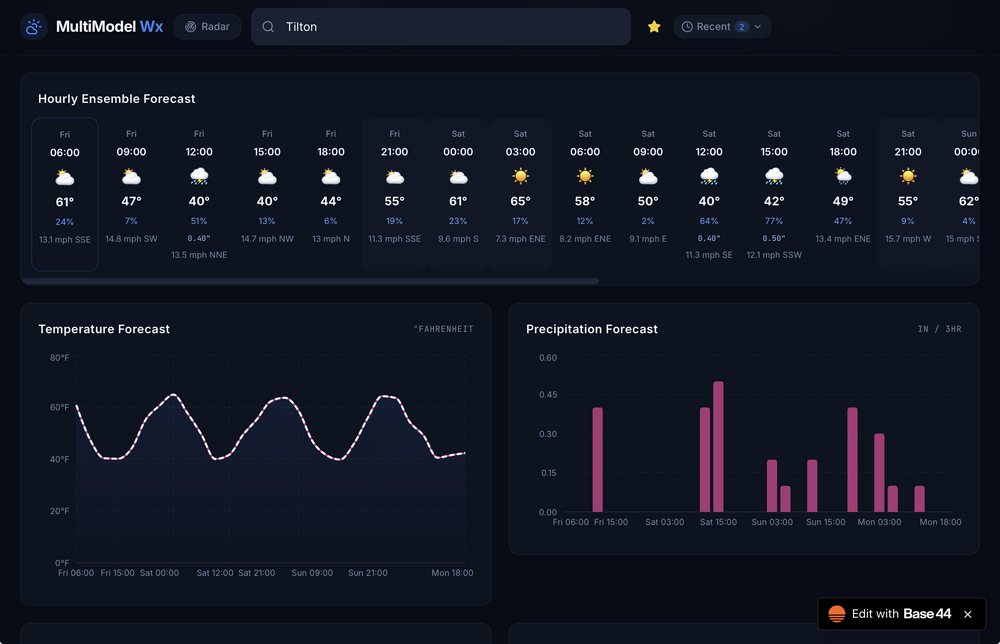
Try now https://synoptic-weather-lens.base44.app
-
There are a few types of plants that are looking weak due to disrupted development from that freeze. Some don't really show it but, because they started flowering and the flowers froze they won't be fruiting and seed production will be severely reduced.
-
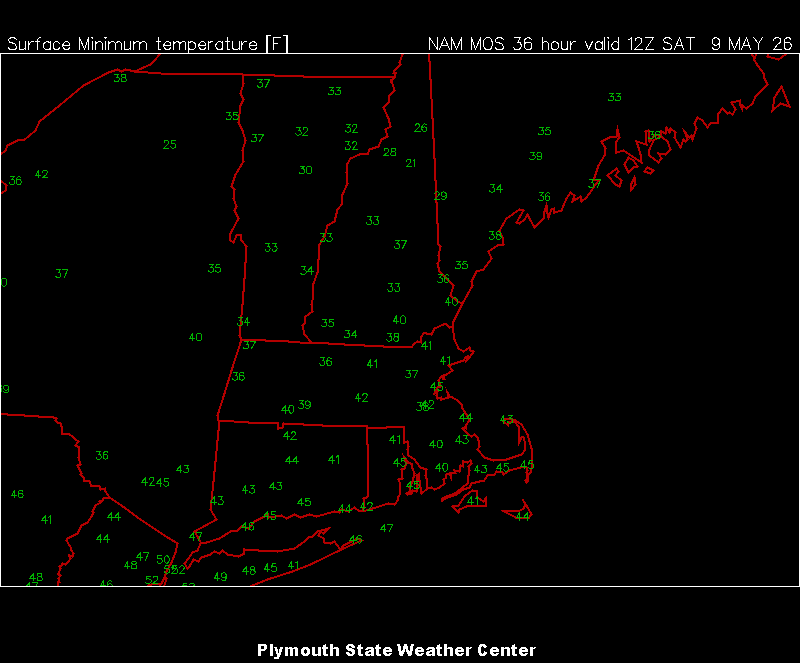
MOS mins for tomorrow AM. Cutting it close with the potted plants in the driveway.

-
Working on it
-
Fixed it I hope. Keep the suggestions coming. https://synoptic-weather-lens.base44.app
-
It doesn’t have a temp below 50° for me for the entire forecast period, yet we had frost this morning and another frost threat tomorrow.
-

Central PA Spring 2026 Discussion/Obs Thread
Jns2183 replied to Voyager's topic in Upstate New York/Pennsylvania
Haha, also where do you get the idea they just forget to update the maps? You should take 30 mins and read up on the criteria of how the make the map. It isn't voodoo magic whose encantstions are secret knowledge. Ironically the biggest complaint against them the last few years has been their slowness to recognize drought. Not too long ago farmers in West Virginia are sending pictures in of their dead corn and craft fields when they still had supposedly a mild or moderate drought. Also I think if you would look at the areas soil types it would make more sense. Some areas are basically just run off machines because of it and it takes significantly more rain than other areas to recharge the aquifers and Wells and such. Sent from my SM-S731U using Tapatalk -
Something is wrong with rain working on it. Thank you feel free to use it. Will be free for AMWX users once published
-
Central PA Spring 2026 Discussion/Obs Thread
Jns2183 replied to Voyager's topic in Upstate New York/Pennsylvania
We also have had 3 straight years below normal rainfall with mean deficit of 10%. Nothing has been able to recharge and the antecedent dry background condition amplifies a single dry month significantly Sent from my SM-S731U using Tapatalk -

2026-2027 Strong/Super El Nino
Stormchaserchuck1 replied to Stormchaserchuck1's topic in Weather Forecasting and Discussion
^Right, I'm just running all the data (73 years +events) and showing that in the data there isn't really a difference. -

2026-2027 Strong/Super El Nino
snowman19 replied to Stormchaserchuck1's topic in Weather Forecasting and Discussion
A recent (2025) research paper came up with this conclusion about +PMM El Niños: “A positive Pacific Meridional Mode (+PMM) acts as a crucial driver for developing eastern Pacific (EP) El Niño events, particularly by facilitating wind-evaporation-SST (WES) feedback that warms the subtropical Northeast Pacific and promotes westerly wind anomalies at the equator. This interaction commonly triggers EP-type El Niño, characterized by peak warming in the eastern Pacific, as opposed to the Central Pacific (CP) type.” Link to the research paper: https://www.science.org/doi/10.1126/sciadv.adv8621#:~:text=Other climate modes further complicate,and NPO%2C on ENSO evolution. -

2026-2027 Strong/Super El Nino
bluewave replied to Stormchaserchuck1's topic in Weather Forecasting and Discussion
We had a smaller temperature rise with the 80s into early 90s El Niño events since we were just coming out of the cooler climate prior to 1980. The first global first significant temperature jump occurred in 1997-1998. Then the next one in 2015-2016. Followed by 2023-2024. We didn’t find out what the CRCs were until after the events. So it’s going to take some time to know how all the details following this event also. https://www.nature.com/articles/s41467-025-66143-7 Climate regime shifts (CRSs), characterized by abrupt and persistent transitions between alternative stable states in the climate system, pose serious threats to ecosystems and human well-being. Understanding the potential drivers of CRSs is crucial, particularly in a warming world where CRSs are becoming more frequent. Here, using multiple observations and model simulations, we find that the likelihood of CRS occurrence significantly increases in the context of super El Niño events due to their remarkable climate perturbations. This higher probability is detected across various climate elements, such as surface air temperature, sea surface temperature, and surface soil moisture. In addition, we suggest that this boost effect of super El Niño events on CRSs will be greatly amplified under future greenhouse warming. Our findings underscore a deeper and more persistent climate footprint of super El Niño events, suggesting that early warnings and proactive measures are crucial for mitigating their escalating risks.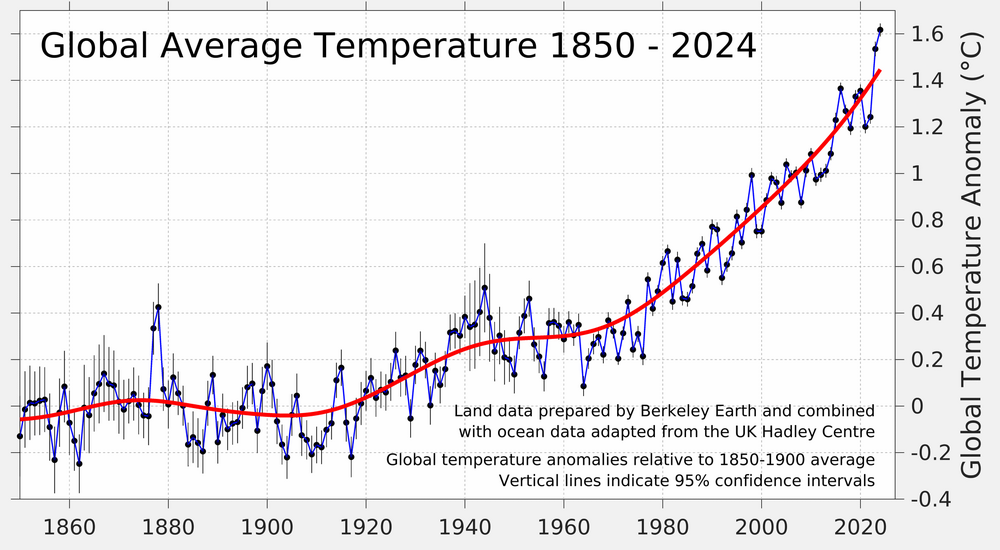
- Today
-
A nice cool morning with a low of 37 this morning.
-
Central PA Spring 2026 Discussion/Obs Thread
Jns2183 replied to Voyager's topic in Upstate New York/Pennsylvania
I think a big part of this is where you are located. There is a world of difference between what I'm tracking in Lancaster vs Adams county over the last 90 days soil moisture wise. One is not even -0.5 std dev below normal while the other is flying to -1.5 fast. Here are the precipitation departure from normal over some time periods Sent from my SM-S731U using Tapatalk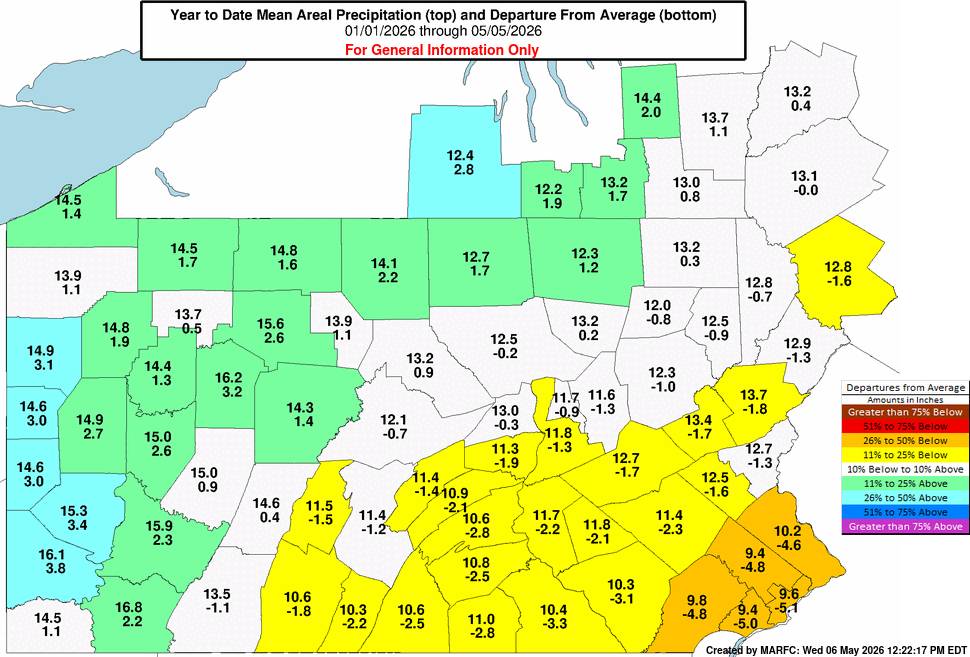
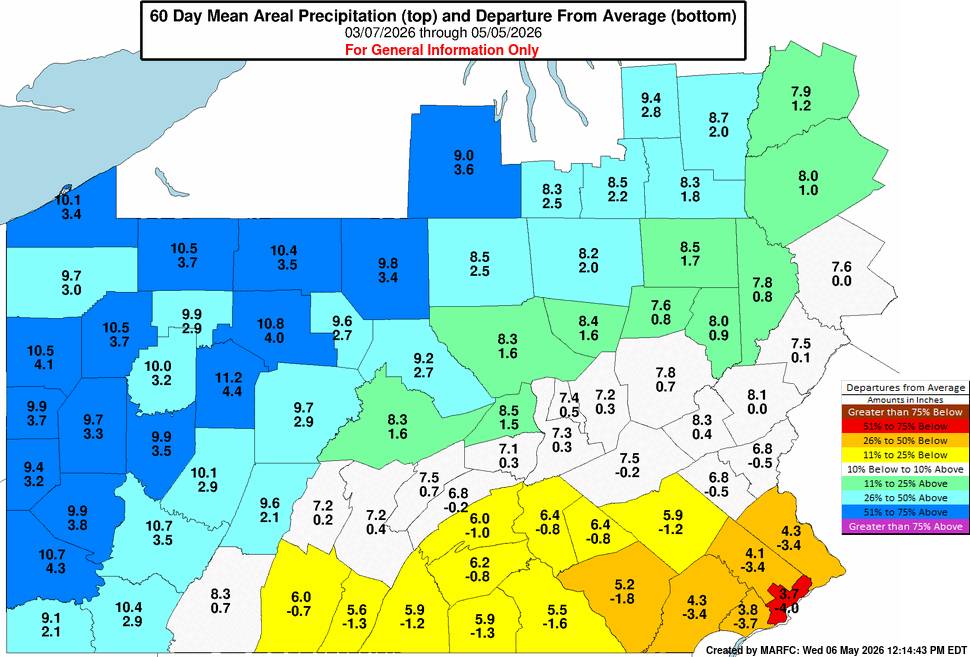
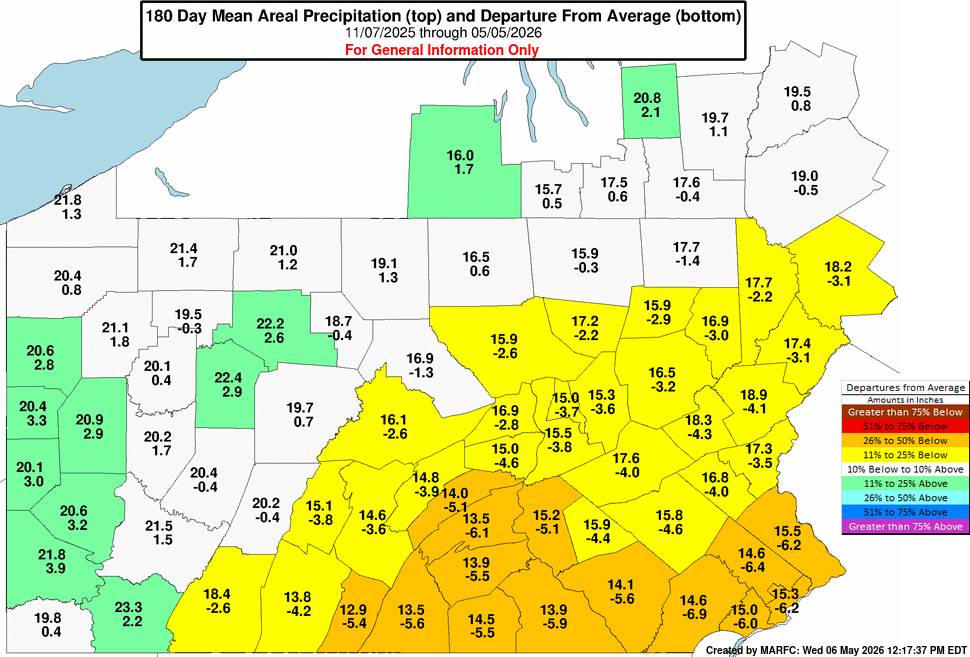
.jpg.899f2dde50b7a66b12858657d303cc56.jpg)
-
2026-2027 Strong/Super El Nino
Stormchaserchuck1 replied to Stormchaserchuck1's topic in Weather Forecasting and Discussion
Not much of a May PMM difference between Nino 4, 3.4 and 1.2 based later-in-the-year El Nino's. If anything it's probably strongest for Nino 4 -
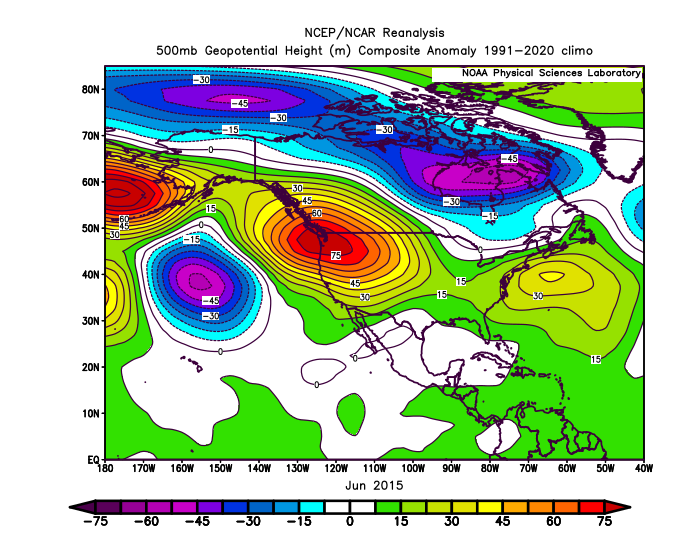
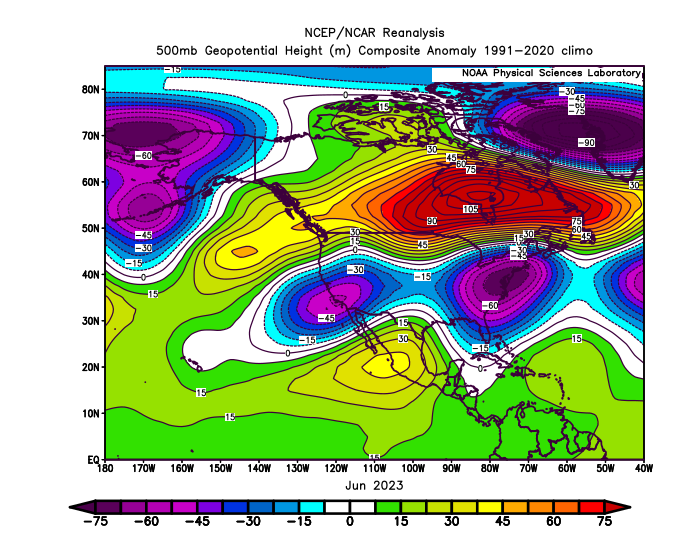
We will have to wait and see since we aren’t getting the extreme ridge over Canada like we had from May into June 2023 leading to the record air pollution in NYC from the Canadian wildfires. Notice how 2015 started off warmer in June than 2023 which set the pace for the whole summer. A much warmer winter has been a given with super El Niños like 1983, 1998, 2016, and 2024. But we did find a way to get a generally warmer summer in 2015 with over 30 days reaching 90°. Even the 2023 summer which was closer to average still had 29 days due to the late warm up into September. Time Series Summary for NEWARK LIBERTY INTL AP, NJ - Jan through Dec 90° days Click column heading to sort ascending, click again to sort descending. 2025 39 0 2024 33 0 2023 29 0 2022 49 0 2021 41 0 2020 31 0 2019 27 0 2018 36 0 2017 22 0 2016 40 0 2015 35 0
-
Central PA Spring 2026 Discussion/Obs Thread
mahantango#1 replied to Voyager's topic in Upstate New York/Pennsylvania
35 with just a touch of frost this morning. -
Winter 25-26 (All Snowfall Maps & Season Total)
The 4 Seasons replied to The 4 Seasons's topic in New England
All the climate sites came in above normal but ISP had a crazy good winter with near 200% of normal snowfall, same with PVD (mostly from one storm) Long Island and the Cape/S. Coast did really well overall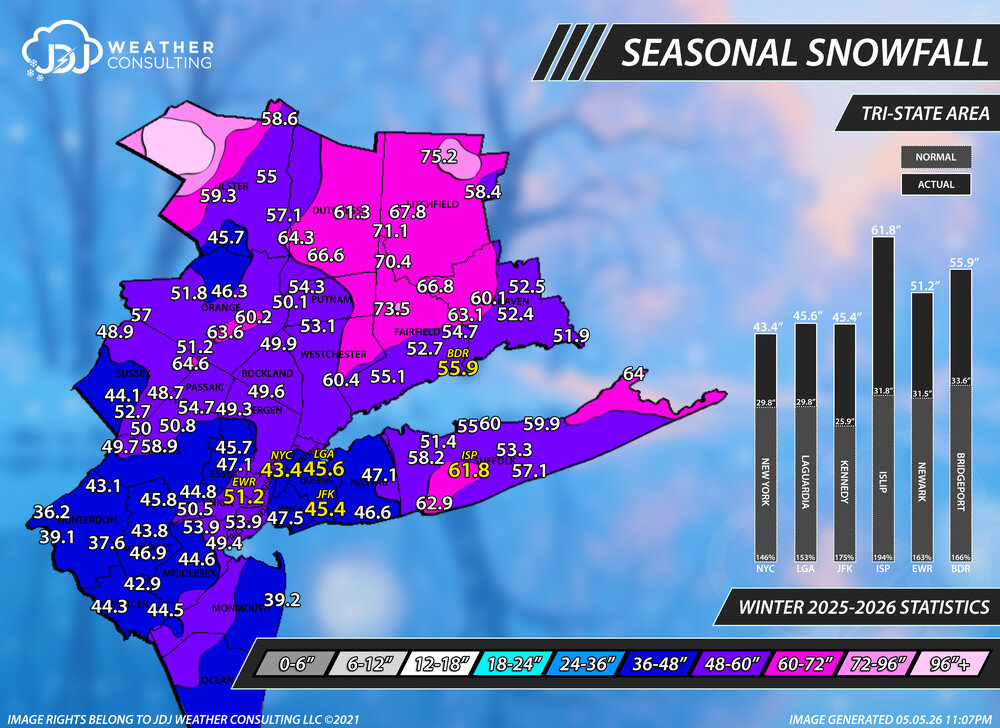
-
We need one or two loaded up El Niño southern jet setups to make it this far north with cold air. We don’t want too much blocking to squash everything south.