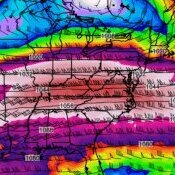
Chinook Posted June 2, 2023 Share Posted June 2, 2023 This summer is looking bad already as a blocking pattern has made the rainfall go away for the last 3 weeks here. Let's look at a historical d***ght of 1988. It stunk. I remember it. Up to that point in my life I had never heard a weatherman say it was 104 degrees outside. The development really happened in April as the temperatures over southern Canada and the northern Midwest and Rockies were very high. Then, May and June got very dry and then also very hot over a lot of the central to eastern US. The core of the driest weather moved eastward in June. The monthly precipitation plot shows that the precipitation departure was -3 inches over the entire eastern USA. Considering the entire month of July, northwest Ohio had normal precipitation but was still suffering from the effects of drought. The Palmer Drought Index showed a continued drought into September here. In August, the Palmer Drought Index showed extreme drought in the Appalachians, Illinois, and also the northern tier of the US. Some Toledo stats. On June 25, Toledo hit 104 degrees. Then, on July 1st there was a low temperature of 40 degrees, which is nearly unthinkable for mid-summer. Then on July 6th-8th, it was 100, 103, and 100. That's such a crazy change of temperature that is indicative of low soil moisture. This was some of the worst soil moisture that NW Ohio has ever had, as the July Palmer Drought Index was -4 (see plot). Toledo had only minor rainfall until July 18th, but then more rain. July 1988 had a monthly temperature near normal and precipitation above normal at Toledo. The heavy rainfall occurred in between July 30th to the end of August. PRECIPITATION, standardized departure, as calculated by the ESRL-PSD web site June 1988 precipitation departure, in INCHES 1 2 2 Link to comment Share on other sites More sharing options...
Chinook Posted June 2, 2023 Author Share Posted June 2, 2023 New thought here. The map from ESRL-PSD says the northwest Ohio division was possibly +2.5 to +3.0 degrees F for July (not sure about the colors) Let's look at some numbers that are the specific observations at the airport. Toledo had an average temperature 75.9 which is listed in this table as 0.5 degrees above average as seen here. The 1991-2020 current 30yr average July is 73.8 degrees. The 1951-1980 average July temperature was 72.1 degrees. so 75.9 would have been +2.1 based on the recent data but it would have been +3.8 based off the data up to 1980. So I'm confused. 1 1 Link to comment Share on other sites More sharing options...
TheClimateChanger Posted June 2, 2023 Share Posted June 2, 2023 34 minutes ago, Chinook said: New thought here. The map from ESRL-PSD says the northwest Ohio division was possibly +2.5 to +3.0 degrees F for July (not sure about the colors) Let's look at some numbers that are the specific observations at the airport. Toledo had an average temperature 75.9 which is listed in this table as 0.5 degrees above average as seen here. The 1991-2020 current 30yr average July is 73.8 degrees. The 1951-1980 average July temperature was 72.1 degrees. so 75.9 would have been +2.1 based on the recent data but it would have been +3.8 based off the data up to 1980. So I'm confused. Yes, the 1991-2020 average for Toledo is 73.8F. But the NWS must be beta-testing some sort of new method for calculating the normals in the NWS CLE area because a lot of the normals are substantially higher than the arithmetic mean. I don't know if they included some sort of global warming factor or something? There was no explanation for the changes. Anyways, despite the 1991-2020 average being 73.8F, the current normal for Toledo in July is 75.4F. Link to comment Share on other sites More sharing options...
TheClimateChanger Posted June 2, 2023 Share Posted June 2, 2023 14 minutes ago, TheClimateChanger said: Yes, the 1991-2020 average for Toledo is 73.8F. But the NWS must be beta-testing some sort of new method for calculating the normals in the NWS CLE area because a lot of the normals are substantially higher than the arithmetic mean. I don't know if they included some sort of global warming factor or something? There was no explanation for the changes. Anyways, despite the 1991-2020 average being 73.8F, the current normal for Toledo in July is 75.4F. Not to highjack your thread, but you can see this effect in the current normals for Cleveland and Toledo. At Cleveland, the 1991-2020 average (arithmetic mean) annual mean temperature is 51.4F, yet the normal is 52.4F - a full degree higher. At Toledo, the 1991-2020 average (arithmetic mean) annual mean temperature is 50.6F, yet the normal is 52.5F - nearly two degrees higher! You would think with normals that are 1-2 degrees warmer than the mean temperature for the base period, you would see a heavy slant towards below normal temperatures. And that would certainly be the case in a static climate. However, in reality, whatever the NWS has done was good, as most months are still coming in above even the heavily inflated normals. I suspect this is some sort of "beta testing" of a new method of calculating normals that factors in the rapid global warming trend. In recent decades, the use of arithmetic means has led to a substantial bias towards warmer than normal temperatures since the climate is warming and not static. Therefore, the use of a past base period results in temperatures and conditions that are necessarily from a cooler climate and not representative of the current conditions at the site. This warming factor in the TOL and CLE means seems to have been introduced to take account of the trends at each station. I have not noticed this effect anywhere outside of the NWS CLE area. The first-order sites in surrounding locations still seem to have normal temperatures that are approximately equal to the arithmetic mean of the base period. This is what led me to believe this is some sort of beta test. This just highlights the importance of language - often times, people refer to the normal temperatures as the "1991-2020 averages" which has never been strictly true since the figures are normalized. But with the most recent normals, this is completely wrong. Link to comment Share on other sites More sharing options...
TheClimateChanger Posted June 2, 2023 Share Posted June 2, 2023 5 minutes ago, TheClimateChanger said: Not to highjack your thread, but you can see this effect in the current normals for Cleveland and Toledo. At Cleveland, the 1991-2020 average (arithmetic mean) annual mean temperature is 51.4F, yet the normal is 52.4F - a full degree higher. At Toledo, the 1991-2020 average (arithmetic mean) annual mean temperature is 50.6F, yet the normal is 52.5F - nearly two degrees higher! You would think with normals that are 1-2 degrees warmer than the mean temperature for the base period, you would see a heavy slant towards below normal temperatures. And that would certainly be the case in a static climate. However, in reality, whatever the NWS has done was good, as most months are still coming in above even the heavily inflated normals. I suspect this is some sort of "beta testing" of a new method of calculating normals that factors in the rapid global warming trend. In recent decades, the use of arithmetic means has led to a substantial bias towards warmer than normal temperatures since the climate is warming and not static. Therefore, the use of a past base period results in temperatures and conditions that are necessarily from a cooler climate and not representative of the current conditions at the site. This warming factor in the TOL and CLE means seems to have been introduced to take account of the trends at each station. I have not noticed this effect anywhere outside of the NWS CLE area. The first-order sites in surrounding locations still seem to have normal temperatures that are approximately equal to the arithmetic mean of the base period. This is what led me to believe this is some sort of beta test. This just highlights the importance of language - often times, people refer to the normal temperatures as the "1991-2020 averages" which has never been strictly true since the figures are normalized. But with the most recent normals, this is completely wrong. The warming factor has been successful so far. At Toledo, the mean for 2021 was 54.0F and for 2022 was 52.7F. These are 1.5F and 0.2F above the current normal; however, they would have been a whopping 3.4F and 2.1F above the 1991-2020 averages. At Cleveland, the mean for 2021 was 53.3F and for 2022 was 52.2F. These are 0.9F above and 0.2F below the current normal; however, they would have been 1.9F and 0.8F above the 1991-2020 averages. What's interesting is CLE averaged 0.8F warmer than TOL from 1991-2020, yet the normal mean at TOL was set 0.1F warmer than CLE. This has also turned out to be correct, as TOL has averaged 0.7F and 0.5F warmer than CLE in the first two years of this decade. Apparently, TOL is warming more rapidly than CLE. Link to comment Share on other sites More sharing options...
TheClimateChanger Posted June 2, 2023 Share Posted June 2, 2023 Just to prove I'm not making this up. Here are the annual mean temperatures at CLE from 1991-2020, with the calculated mean (51.4F) at the bottom. And here is the 1991-2020 "normal" mean for CLE (52.4F): Here are the annual mean temperatures at TOL from 1991-2020, with the calculated mean (50.6F) at the bottom. And here is the 1991-2020 "normal" mean for TOL (52.5F): Link to comment Share on other sites More sharing options...
TheClimateChanger Posted June 2, 2023 Share Posted June 2, 2023 With the current means at TOL, only three years from the base period would have been warmer than average (1998, 2012, and 2020). The other 27 years were less than the current normal. Yet so far, since they've been in effect, two consecutive years have come in even higher than these inflated numbers. And, again, sorry to highjack the discussion, but as you noted it was a new thought that popped up as you were looking into the summer of 1988. With that said, you are the first person I've seen question these numbers and express confusion... I noticed this a while back, and it had me scratching my head. Like I said, it has to be some sort of "trend" factor - maybe calling it a global warming factor is loaded terminology. But it would only make sense to use a trend correction if you were pretty confident whatever trend you are factoring in is going to continue. If there was instead a cyclical pattern, and it cycled into a cooling trend, then this would produce normals way above the current temperatures. Link to comment Share on other sites More sharing options...
luckyweather Posted June 2, 2023 Share Posted June 2, 2023 “Not to hijack your thread”Proceeds to make 5 successive replies on Toledo’s average mean temp in a historical drought thread. I remember as a kid in the 80s seeing several segments on the local St Louis area news about various shipwrecks being exposed as the Mississippi and Missouri rivers all but dried up. 2 Link to comment Share on other sites More sharing options...
TheClimateChanger Posted June 23, 2023 Share Posted June 23, 2023 Here was an interesting comparison shared by @BAMWX on Twitter. Worse than 2012, but not quite to 1988 levels. Link to comment Share on other sites More sharing options...
cyclone77 Posted June 23, 2023 Share Posted June 23, 2023 I loved the drought/heat of 1988 as a kid. Went swimming about every day. Link to comment Share on other sites More sharing options...
TheClimateChanger Posted June 27, 2023 Share Posted June 27, 2023 I will probably face resistance for pointing this out, since some seem to always assume (without evidence, I might add) that past records were more reliable than modern ones. However, I believe is important to note that the temperature records from this era (roughly mid 1980s to mid 1990s) exhibit a warm bias at most first-order climate stations, due to the widespread use of HO-83 hygrothermometer. Temperature readings from the HO-83 have been shown to exhibit a large warm bias (especially with summertime maxima). ASOS units were installed nationwide in the 1990s, and generally read a couple to, in some cases, several degrees cooler than the HO-83. It is therefore likely that the HO-83 hygrothermometer was at least, in part, responsible for some of the many record high temperatures set in the summer of 1988. In sum, 1988 was certainly an extreme drought - by some measures, the worst nationally since the Dust Bowl. The drought was accompanied by periods of extreme heat, although mean temperatures from that summer have been regularly exceeded in numerous recent years. Some of the records set at first-order sites from that summer are likely unreliable, since the equipment used to measure the temperature exhibited a warming bias of a few to several degrees on sunny summer days, especially in the absence of significant wind. When comparing temperature records, it is important to be aware of potential biases. Based on the evidence, I believe it is highly unlikely that we would have observed as many 100 degree days in 1988 had modern equipment been in place. Sources: Comparison of records from Lincoln, NE, showing a warm bias of around 2F relative to ASOS, but up to 7F on certain days: https://repository.library.noaa.gov/view/noaa/30286/noaa_30286_DS1.pdf American Meteorological Society Journal article, highlighting warm bias in Albany, NY (1.2C error on sunny July days): Recent Maximum Temperature Anomalies at Albany, New York: Fact or Fiction? in: Bulletin of the American Meteorological Society Volume 74 Issue 2 (1993) (ametsoc.org) 1991 New York Times article detailing how the HO-83 produced dozens of phantom record high temperatures in Tuscon, AZ: In Tucson, It's Not the Heat, It's the Thermometers - The New York Times (nytimes.com) Steve McIntyre and Anthony Watts discussion of the problem from 2008: Inside the HO83 Hygrothermometer « Climate Audit Steve McIntyre discussion from 2007, with numerous citations: The HO-83 Hygro- thermometer « Climate Audit Link to comment Share on other sites More sharing options...
TheClimateChanger Posted June 27, 2023 Share Posted June 27, 2023 Officially, 1988 recorded the most 100+ days in Chicago weather history. But can we really say without a doubt this is a legitimate record, given the overwhelming evidence of bias in the HO-83 from various parts of the country which I cite to in the preceding post? Most likely, at least a few of these 7 days would have been measured in the mid/upper 90s in the absence of the HO-83. For the record, 3 of the 7 days were exactly 100. A bias of even 1F would suggest those days were only 99F, but comparison studies have shown the bias was in excess of 2F on sunny, summertime days. And it's the same case throughout the midwest. Now, one could ask why years from this era don't show up as breaking more records if there was a significant warm bias. But the bias was generally 2F or less overall, except larger during sunny summer days [i.e., the types of days in abundance across the midwest and eastern US during the summer of 1988, and always present in Tuscon, AZ]. The warming that has occurred due to AGW is of much greater magnitude, and so many recent years have set numerous records despite being observed on "cooler" equipment. And I would point out that 1991 does show up as a very warm year in many locations, which may have been somewhat inflated at sites utilizing the HO-83. Link to comment Share on other sites More sharing options...
TheClimateChanger Posted June 27, 2023 Share Posted June 27, 2023 I think what is particularly damning is the fact that Chicago O'Hare had 11 100+ days from 1986 to 1995, but only 6 such days since then, despite a rapid warming trend. Even the 1995 heat wave was likely exaggerated by equipment bias, which is one of the reasons Tom Karl cited as evidence there had been no systematic changes in extreme heat wave frequency: The 1995 Chicago Heat Wave on JSTOR And it's the same story in many places. Pittsburgh had 4 100+ days between 1986 and 1995 [2 in 1988, 1 in 1995], but zero since then. In fact, there has never been any other year other than 1988 and 1995 where KPIT [the airport] has reached 100 degrees, or better, dating back to the establishment of the airport in 1952. Link to comment Share on other sites More sharing options...
Chicago Storm Posted June 27, 2023 Share Posted June 27, 2023 stop posting.. 5 Link to comment Share on other sites More sharing options...
A-L-E-K Posted June 27, 2023 Share Posted June 27, 2023 if stebo was a mod this wouldn't be happening 1 Link to comment Share on other sites More sharing options...
hardypalmguy Posted June 27, 2023 Share Posted June 27, 2023 I think what is particularly damning is the fact that Chicago O'Hare had 11 100+ days from 1986 to 1995, but only 6 such days since then, despite a rapid warming trend. Even the 1995 heat wave was likely exaggerated by equipment bias, which is one of the reasons Tom Karl cited as evidence there had been no systematic changes in extreme heat wave frequency: The 1995 Chicago Heat Wave on JSTOR And it's the same story in many places. Pittsburgh had 4 100+ days between 1986 and 1995 [2 in 1988, 1 in 1995], but zero since then. In fact, there has never been any other year other than 1988 and 1995 where KPIT [the airport] has reached 100 degrees, or better, dating back to the establishment of the airport in 1952. 3 Link to comment Share on other sites More sharing options...
IWXwx Posted June 28, 2023 Share Posted June 28, 2023 Dude, you are wasting a lot of time splitting hairs over the temperatures during the '88 heat wave/drought, as if 100° was some sort magical number. So what if the actual temps at first order stations were inflated by a degree or two? As you said yourself, it was the worst since '36. As an aside, I was 30 years old in '88 and drove from Indiana (with no a/c), spending some time in Philly and D. C. during the height of the heat wave. I saw several mercury thermometers that registered 100° or more in the shade during that trip. And it wasn't a one and done, it was days upon days of mid and upper 90's. It was most extreme heat and dryness I have ever experienced and is still one for the record books, whether the thermometer read 102° or 99°. 1 Link to comment Share on other sites More sharing options...
Stebo Posted June 30, 2023 Share Posted June 30, 2023 On 6/27/2023 at 2:53 PM, A-L-E-K said: if stebo was a mod this wouldn't be happening Correct Link to comment Share on other sites More sharing options...
buckeye Posted August 1, 2023 Share Posted August 1, 2023 Remember that summer very well. I was working near Cincinnati and remember the rule of thumb was if it hit 94 by noon it was going to be a 100+ day. It happened a lot that summer. Also the first time I recall people losing their entire lawns, (not dormant but actually killed off). Many people had to have them re-seeded, sodded. On separate note, that was also the first time I felt an earthquake....it was later during that same summer. Link to comment Share on other sites More sharing options...

Recommended Posts
Create an account or sign in to comment
You need to be a member in order to leave a comment
Create an account
Sign up for a new account in our community. It's easy!
Register a new accountSign in
Already have an account? Sign in here.
Sign In Now