Ian Posted August 7, 2011 Share Posted August 7, 2011 http://www.washingto...A8wI_story.html Thoughts? Haven't looked into it much yet. Still working on my AUG climo post for CWG and may include something about this. I think perhaps it's slightly a thing of luck as it seems our biggest rainfall days want to hug the Aug/Sep border and Sep has not seen as severe a decline. It is still interesting though. Worth noting that AUG in D.C. holds 6 of the top 10 rainiest days on record, all well over any monthly avg during the yr. Link to comment Share on other sites More sharing options...
H2O Posted August 7, 2011 Share Posted August 7, 2011 I have found it noticable. Part of my work requires water levels in the Occoquan to be at a certain level in order to do the work. We have always scheduled things around AUG to allow for these drier than normal conditions as of late. If AUG is now drying up then that only lengthens our typical dry season which I have been told is our fall months. And the smartazz comment is that Rainstorm's recurve meme really works. Link to comment Share on other sites More sharing options...
RodneyS Posted August 8, 2011 Share Posted August 8, 2011 http://www.washingto...A8wI_story.html Thoughts? Haven't looked into it much yet. Still working on my AUG climo post for CWG and may include something about this. I think perhaps it's slightly a thing of luck as it seems our biggest rainfall days want to hug the Aug/Sep border and Sep has not seen as severe a decline. It is still interesting though. Worth noting that AUG in D.C. holds 6 of the top 10 rainiest days on record, all well over any monthly avg during the yr. I tend to agree with you about the luck factor, which is why I question the predictive value of 30-year precipitation normals. If you look at the entire period of record in DC, 1871-2010, August precipitation has averaged 4.09 inches, making it second only to July. During that 140-year period, June has been third and September fifth (behind May). However, during the last 20 years, September has been first, June second, July fifth, and August eleventh. So, what appears to have happened recently is that summer storms have just happened to bypass DC more often in July and August, while nailing us more often in June and September. Will this continue in the future? I doubt it, but then again, there is always a chance that a fundamental change in precipitation patterns is taking place that will not be obvious for another 20 years or so. Link to comment Share on other sites More sharing options...
Ian Posted August 8, 2011 Author Share Posted August 8, 2011 I tend to agree with you about the luck factor, which is why I question the predictive value of 30-year precipitation normals. If you look at the entire period of record in DC, 1871-2010, August precipitation has averaged 4.09 inches, making it second only to July. During that 140-year period, June has been third and September fifth (behind May). However, during the last 20 years, September has been first, June second, July fifth, and August eleventh. So, what appears to have happened recently is that summer storms have just happened to bypass DC more often in July and August, while nailing us more often in June and September. Will this continue in the future? I doubt it, but then again, there is always a chance that a fundamental change in precipitation patterns is taking place that will not be obvious for another 20 years or so. I do think "lack of hurricanes" is too easy an answer as hurricanes are kind of outliers to begin with and they heavily skew any avg due to the fact that they drop 1-3 months worth of rain. Yet, looking at more common daily values there is seemingly a trend for less of them as well. http://www.washingto...mpN2I_blog.html. Given increased warmth I wonder if it can be partially attributed to increased ridging/less frequent cold fronts. Tho as you note it could be as simple as a thunderstom dumping 3" of rain 2 miles away from the airport while they get a trace, yet the regional stats tend to say not necessarily. Link to comment Share on other sites More sharing options...
mappy Posted August 8, 2011 Share Posted August 8, 2011 I do think "lack of hurricanes" is too easy an answer as hurricanes are kind of outliers to begin with and they heavily skew any avg due to the fact that they drop 1-3 months worth of rain. Yet, looking at more common daily values there is seemingly a trend for less of them as well. http://www.washingto...mpN2I_blog.html. Given increased warmth I wonder if it can be partially attributed to increased ridging/less frequent cold fronts. Tho as you note it could be as simple as a thunderstom dumping 3" of rain 2 miles away from the airport while they get a trace, yet the regional stats tend to say not necessarily. The thunderstorm notion you mention could be part of it - according to your DC Thunder Climo information (in another thread) August only averages 4.6 days of thunder activity (and as you said, that includes thunder when rain isn't reported). Link to comment Share on other sites More sharing options...
Kmlwx Posted August 8, 2011 Share Posted August 8, 2011 Post would be better with maps from Katie. Link to comment Share on other sites More sharing options...
The Dude Posted August 8, 2011 Share Posted August 8, 2011 http://www.washingto...A8wI_story.html Thoughts? Haven't looked into it much yet. Still working on my AUG climo post for CWG and may include something about this. I think perhaps it's slightly a thing of luck as it seems our biggest rainfall days want to hug the Aug/Sep border and Sep has not seen as severe a decline. It is still interesting though. Worth noting that AUG in D.C. holds 6 of the top 10 rainiest days on record, all well over any monthly avg during the yr. Saw that this weekend, and was disappointed by the article. The graph provided seems to beg the question as to whether the earlier high averages were the result of anomalous events. The problem with 30-yr precip averages is that they are especially susceptible to large changes on the upper end due to anomalously large events, such as tropical systems. To have a meaningful debate on this, it would seem useful to know how the averages change if you were to toss out the 2/3 highest and lowest years. Clearly having 1955, 1967, and 1971 come off the books would make a big difference. By my rough math, those years alone account for over 50% of the difference. If that's right, the question shifts from weather there are large-scale changes at issue to whether it's just a matter of whether a DC gets a good tropical rainmaker once a decade or so. I'd be very curious to see the change in non-tropical precip, but I imagine that would take an incredibly long time to compile. Link to comment Share on other sites More sharing options...
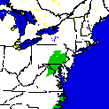
MN Transplant Posted August 8, 2011 Share Posted August 8, 2011 Hits both the average and median. Link to comment Share on other sites More sharing options...
MN Transplant Posted August 8, 2011 Share Posted August 8, 2011 Maybe not as dramatic, but present at BWI Link to comment Share on other sites More sharing options...
Ian Posted August 8, 2011 Author Share Posted August 8, 2011 Saw that this weekend, and was disappointed by the article. The graph provided seems to beg the question as to whether the earlier high averages were the result of anomalous events. The problem with 30-yr precip averages is that they are especially susceptible to large changes on the upper end due to anomalously large events, such as tropical systems. To have a meaningful debate on this, it would seem useful to know how the averages change if you were to toss out the 2/3 highest and lowest years. Clearly having 1955, 1967, and 1971 come off the books would make a big difference. By my rough math, those years alone account for over 50% of the difference. If that's right, the question shifts from weather there are large-scale changes at issue to whether it's just a matter of whether a DC gets a good tropical rainmaker once a decade or so. I'd be very curious to see the change in non-tropical precip, but I imagine that would take an incredibly long time to compile. The graph I posted above was a simple attempt to de-aggregate it or at least separate it out a bit, though I'm sure this could be a very in depth study that I don't really have time for right now--not that I could find any perfect answer myself. There are a lot of variables in summer of course when it comes to convection and often lacking winds to move said convection. However, it is clear at least that the major events are almost always tropical related. I guess I don't know enough about the tropical history here, but to me that still says it's an outlier to "expect" a wet August. I've been here at least long enough to know that we do get remnants, but not often to we get the ones that heavily inflate an avg of any sort. This is what I sent to Jason of CWG verbatim after I saw the piece. just a small sample of these "extreme" rainfall days.. which is where the main analysis needs to be I think rather than at a monthly or 30-yr avg level. "I just also looked through 3"+ rainfall days, AUG/SEP are leaders as you'd probably expect, covering about 50% of those type days. See attached. While we have not had many of those biggest days in Aug lately, we have in Sept. Kind of a small sample, but ~70% of all 3"+ rainfall days in the AUG/SEP period are from mid-Aug through mid-Sep. Even as low a range as Aug 25-Sep 5 has 30% of the the total. So it's seemingly weighted toward the switch in months... maybe random when? " additionally, below is the whole section i did in the august climo piece with graph I pasted above. fairly rudimentary in this debate but i think it at least tells that 1) we also are seeing less .1"+ rain days which is meaningul and 2) tropical systems are the answer.. but i dont necessarily believe Aug climo supports them as they tend to cluster late in the month or into sept. sept may not see the same decrease due to that same fact -- it's more "normal" then to get remnants interacting with a front, etc. From post: http://www.washingto...g.html#comments Despite these heavy rainfall event, it has been noted that August seems to be drying up in Washington, D.C. to the point of having an impact on local plant life. Those types of trends are clearly visible in year-to-year precipitation, rolling averages and regional changes in climate normals. Trends in average number of days with .1”, .5”, 1” and 2” of rainfall over 30-year climate periods throughout recorded history at Washington, D.C. See sources for data. As with July, August is often home to a persistent area of high pressure. This is occasionally, and more frequently as the month progresses, interrupted by cold fronts or other rain events. The first four of six August entries into the “top-10 rainiest days on record” were set by tropical cyclones (tropical storms, hurricanes or their remnants). In all four cases -- 1933, 1944, 1928, 1955 – the system tracked directly over Washington dumping ~5.50” or more in just one day with some higher multi-day totals. Outliers in history, even if “expected” here and there. Still, declining trends are evident – if maybe less extreme – in counts of the average number of days with conditions such as a “nuisance” 0.10” of rain, in addition to those that we might term a washout with 2” or more. Tropical systems account for a significant amount of the variability in August extremes, but more robust — or longer-lasting — summer high pressure ridging may also be playing a role in the slow decline of rainy days in the more common lesser amounts. Link to comment Share on other sites More sharing options...
Ian Posted August 25, 2011 Author Share Posted August 25, 2011 bust Link to comment Share on other sites More sharing options...
WxUSAF Posted August 25, 2011 Share Posted August 25, 2011 LOL...was going to bump this thread as well. I think most areas were going to see 4"+ this month even without Irene. Link to comment Share on other sites More sharing options...
Ian Posted August 28, 2011 Author Share Posted August 28, 2011 todays total highest since 1971 it seems.. bests new monthly avg Link to comment Share on other sites More sharing options...
RodneyS Posted August 29, 2011 Share Posted August 29, 2011 August precipitation at DCA is now 8.72 inches, the most in August since 1967 and 10th on the all-time list, 1871-2011. Link to comment Share on other sites More sharing options...
MN Transplant Posted August 29, 2011 Share Posted August 29, 2011 IAD: 3.74" on the month. Link to comment Share on other sites More sharing options...
mitchnick Posted August 29, 2011 Share Posted August 29, 2011 August precipitation at DCA is now 8.72 inches, the most in August since 1967 and 10th on the all-time list, 1871-2011. 10.38" at BWI and 11.97" at the MD Science Center 8 miles to the north of BWI EDIT: looks like this August is in 5th place at Baltimore (includes figures from Baltimore City pre-BWI); 8/55 had an unbelievable 18.35"!!!! Link to comment Share on other sites More sharing options...
SoCoWx Posted August 29, 2011 Share Posted August 29, 2011 Even though some folks dont consider southern VA part of the Mid-Atlantic...our total rainfall from Irene is 15". I'm not sure how much non-tropical rainfall we've had this month. Drought busted I guess. lol. Link to comment Share on other sites More sharing options...

Recommended Posts
Archived
This topic is now archived and is closed to further replies.