brooklynwx99
-
Posts
6,233 -
Joined
-
Last visited
Content Type
Profiles
Blogs
Forums
American Weather
Media Demo
Store
Gallery
Everything posted by brooklynwx99
-
they shouldn’t run these everyday. it’s overkill in my opinion
-
this will work. what a ridge in central Canada. that'll promote HP in a good spot
-
the EPS amps the trailing wave well. gets BN heights overhead from the initial wave. this could work great ridge over C Canada… should promote surface HP in a good spot too
-
+10 air coming out of northern Canada is still cold enough for our intents and purposes
-
large signal showing up for Christmas week… cold air will be an issue but worth tracking with a SS vort this potent. the Canadian ridge can also force transient HP downstream
-
large signal showing up for Christmas week… cold air will be an issue but worth tracking with a SS vort this potent. the Canadian ridge can also force transient HP downstream
-
worth noting that ENS would have a really hard time picking up on transient HP that’s forced by the Canadian ridge
-
well, there’s your post-Christmas coastal signal. cold air is marginal here verbatim but still worth keeping an eye on
-
that likely happens later in the winter when wavelengths shorten
-
end of the month looking more and more interesting with a potent SS shortwave sneaking under anticyclonic flow in central Canada
-
not sure how anyone can see these kinds of setups and not get excited about the rest of the winter. loaded southern stream showing up later in the month. wait until we get a legit -NAO to establish a 50/50 ULL and you're golden
-
to be honest, I think that some of the source region stuff is a bit overrated. yes, we would prefer Canada to be cold, but that is usually not the case in El Ninos, even the prolific ones. for example, look at Feb 2010! there was +10-15C air right over SE Canada. made no difference. same with Feb 1987, Canada is torched
-
“actually Nunavut is gonna be +20 so nobody cares if it’s -1 along the EC” as it’s literally snowing
-
yeah, you’re probably correct there. those years usually don’t have amazing Pacific patterns
-
i can pretty much guarantee that if we see a strong -NAO there could be a prolific period as long as the Pacific isn’t absolute garbage. we are seeing a strong STJ and zero indication of any persistent SE ridging
-
what’s interesting is that the central Canadian ridge actually leads to HP in a good spot since it leads to NVA aloft. so, it can provide confluence even if it’s in an unorthodox way
-
GEFS looks interesting after Christmas. nice western ridge, strong central Canadian ridge, and a potent SS vort
-
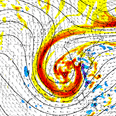
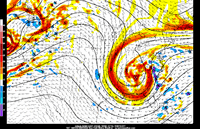
first larger storm signal this year? looks potent
-
nice seeing a deep SE trough showing up on ENS for the end of the month
-
not yet, but still a pretty big shift nonetheless
-
amwx attachment policy isn’t a fan of that
-
yeah this works
-
this will do also that’s also the whole thing about Canada torching. the +20F air up there is like -4F here
-
personally, I was expecting the GFS and CMC to hold serve and for the ECMWF to get way flatter. this morning surprised me
-
if the ECMWF holds and everything remains like this at 00z, then probably. that trend in the CMC and GFS is pretty sharp