

Typhoon Tip
-
Posts
44,524 -
Joined
-
Last visited
Content Type
Profiles
Blogs
Forums
American Weather
Media Demo
Store
Gallery
Everything posted by Typhoon Tip
-
https://phys.org/news/2024-10-bone-dry-october.html "...Now it's almost 50% and growing, according to the U.S. Drought Monitor. That fits the definition of "flash drought," which is different than normal slowly developing dry spells, said U.S. Department of Agriculture meteorologist Brad Rippey, a drought monitor author. A study last year showed that a warming world from the burning of coal, oil and gas is causing more frequent and damaging flash droughts, such as a $30 billion one that hit America in 2012 and a devastating 2022 drought in China...."
-
impressively persistent -pnap extending through the 1st 2 weeks of nov in guidance pure experience … novies tend to be low amplitude +pnap. interesting
-
I think the science would find that the polarward shift in the zonal-mean zonal wind is occurring in both hemispheres everywhere …
-
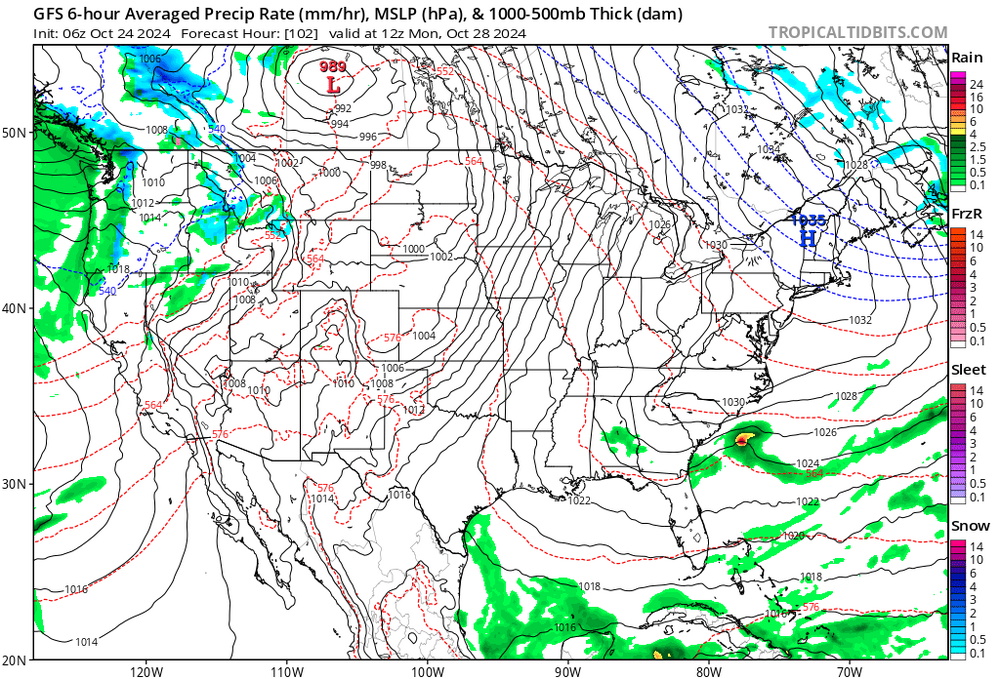
that's one of the more impressive warm frontal events i've seen depicted on a modeled chart series in quite some time. .. perhaps going back to that april 2010 one that sent mid 40s to mid 80s in 24 hours - the only difference between tomorrow and wednesday is that we don't have april insolation to work with. so perhaps mid 40s 10am tomorrow to 77 at 21z wednesday will have to do to get the sensible point across... as far high t's on wed, preeetty sure machine numbers will labor and fail to rise to actuals with their climo dead weight. but the synoptic warm front is every bit as impressive.
-
it's coming... doesn't help our life times, no but some 100(s) years off, provided we get around this Fermi Paradox crap in the foreground, there is a technological destiny of what we might now consider exotic visions, reality only attainable by those who looked beyond the ability to fly; those future benefactors of our toil and discoveries that parlayed newer evolved wonders. this kind of concern will be like when we say, imagine what it was to live before there was electricity. 'they had to suffer the night.' and the fruits of such a future is probably one where work ( if there is such a thing ..>), leisure, and living, can happen anywhere and still be home for supper.
-
oh i know how it works. but dark by 4:30 sucks no matter how we cut up the day. i think what we need is a weird shaped planet that when it rotates ...it's 30 hours on the sun side and 5 hours on the night. haha brian was just saying that some people that's fine. of those i happen to know, most don't like it. but yeah, there's a practical reason for wanting early light. i wouldn't want my kids waiting for the bus in the night just being one of those. ...etc
-
i bet you're not the minority .. .about half the pop has to be up by 7 - i think i actually read that specific demographic once lol. i was thinking about this at the gym - cuz what i'm doing there is so vastly interesting, otherwise... and i was actually wondering if my bachelor lifestyle ( work remotely too - ) is kind of the minority actually. so yeah which ever
-
meh.. .it's only 45 or so days ... then it starts going the other way pretty quick it's better than a 6 whole months of lost evening light to me but to each is his own i guess.
-
you didn't ask but ...my passion for winter is gone - maybe an age thing. maybe a john thing. i dunno. but the only thing that keeps me coming back at all any more is that i still am fascinating by winter storms. but ... i'm fascinated with any kind of storm frankly. if it were bombastically warm all winter long with repeating thunderstorm outbreaks and cbs rolling the tropopauses i'd be just as amused as if there were a stem wound block island bomb. doesn't matter which. it's no longer a winter thing or summer thing.. .it's just don't be fuckin bored thing. zip tolerance or joy for the anticipation of no light and extended wind strung winters of cc glory that can't produce because of shearing and are thus brown earthers
-
i realize some of you want it dark or when not ... blue tinted light encased in snow with with 44 mins of daylight, followed by eternal cryo night when not a sideways blizzard and all... but, here it is just 3:30 pm and the sun is tickling the western tree line. shadows are 20 foot plus ..and I'm thinking jesus christ in a week we gotta lose even another hour off this life support solar. i dunno. the older i get, the more i wish they just leave the clocks in the summer mode.
-
It's leaving a lot on the table imho - but, no argument, it's -pnap base .. sending warm heights n over the e continental mid latitudes in general. it's really just the n stream. this is probably not true, but it seems to me sometimes like that the model's error correcting to force seasonal change ...so it decouples the 'aa' phase of the hemisphere, falsely creating the 'ab' phase - when the n/s streams are more than less in sync is aa and vice versa may just be premature but real. there is a likely +pna out there toward mid novie. it's like it's clicking the n stream into that configuration and decapitating the southern wave number
-
yeah it's like it's solutions are always riding along the least warm possibility of all. it's gonna be november here in a minute so whatever
-
seems like the gfs is trying to derail the entire pattern
-
12z gfs not holding back
-
might be interesting to test that. we've had our discussions in the past about biases among machining but this looks about as ideal for a stone low rational free fall as can physically happen. gotta get a kid or two through the pond ice i guess -
-
beat ya lol is it sunny and 70 there right now? we got this stationary band of clouds here as the front is stalled waiting on that ocean morass to move past. i hate it when randomness ruins it specifically here. haha
-
caa is weak/lagged a bit, so yeah ....the profile might still support some warmth. however ...we're getting this near stationary quasi- ana frontal cloud band. might make that difficult if the sun doesn't come by noon. but it's 63 -ish anyway, so it's not exactly a chilly air mass, no - high launch pad. also, for the general reader - these cool pops should be 20 or so % devalued over guidance when beyond d5 or 6. this is true because models, all of them, seem to over amplify cold oscillations out in time - may or may not be some sort of essence of a cc thing doing that... no idea the cause but its just become operationally expected, regardless. it's true of cyclone intensity and complexion, too. digress.. at least through novie 2 or 3 out there, this is especially true as the base line telecon canvas offers very little support for much other than above normal. i don't disagree that 'cold' shots end up closer to neutral, as they are really just going to be synoptics that are relative/embedded in the longer term warm hemisphere. seeing long range hints at a mode shift in the pna beyond, however. never seen such a persistently positive west pacific oscillation tho. +epo/+pna type of november 10th
-
i noticed about the recent versions of the gfs model ... it seems to be quite sensitive to tc genesis, apparently relative to the mjo predictions out in time. i wonder if they've 'goosed' the physics to do that - based upon probabilistic expectation and research wrt to mjo phasing - or if it is achieving that 'organically'. either way, the gfs seems to spin up tcs in the western caribbean at least excuse imagined/is very sensitive in that region, and from what i've noticed ... is in concert with the mjo -related uvm anomaly distribution. which, are in fact predicted to favor the cag creation ( caribbean gyre) region of the western caribbean moving into the first week of november. it's not a suspicion tho. the model had helen and milton on the d 12 charts and tho successive runs sprayed the solutions around the region down there, in principle, it was correct. good batting average
-
that's the key logical point that a surprisingly large number of folk, from all walks of society ...educated and not, seem to have trouble with. delta(frequency) but there's a deeper issue than that, more of a sociological observation rather than a strictly met one. heh. i think there is a codified discipline called 'behavioral weather' - it studies stuff like full moons and humid nights and murder rates and creeped-out shit like that... as well as sad disorders, , too. the stock market - guess all the bare market crashes ( or most of them...) in history happen in octobers - roughly when the sun is setting on everyone's hopes and dreams in lieu of a dark and dreary cold season, not being any sort of coincidence... etc. group mechanics being melancholy and sensing doom from the oncoming darkness lends to modalities i may be wandering in this statement at this point ...but, i've often mused that the greatest problem in the accepted ubiquity of the climate change is because it does not directly appeal to anyone's natural senses. sight, sound, taste, touch, smell... i mean, that's all changing now. the sight of out of control wild fires, and piles of dead animals due to synergized heat waves of hadean proportions and the like, ... .yeah, it's starting to appeal in media. but still, not enough of the ubiquitous peoples are really experiencing these aspects as 'pain' first hand, appealing to how they personally feel, then integrates group attitudes. haha... really simple. if you hand someone an iron skillet and tell them the handle might be hot, most people will wait to register the heat before reacting. hand them a cherry red handle, and they drop it before you even have to tell them. that silly metaphor ... being so obvious as it may be, is just how dumb the 'human condition' is with global warming. they are being told, and they are waiting...
-
keeping in mind also ... clouds and precipitation can lead a user impression into a bias ( ha ) because they tend to be awake during the day. i mean, i'm assuming you are referring to empirically measured/scalar diurnals, but just for everyone else .. a wet day's average may in fact be higher and is attributed to nights staying above climo in wet patterns. it 'feels' like shit out there, but is in fact often warmer than normal at night by ( and here's the kicker! ) a greater amount than the day held cooler due to clouds and rain. the day may be -10, but the night was +10.5 ...
-
probably shoulda started a 'winter panic 2020 - further notice' thread 7 some years years ago
-
yeah well... i guess the emphasis was on "we'll see" - i mean we actually just rocketed to 75 over the last hour so, it all caused just a delay sort of thing. the key is that the saturation at a higher temperature over previous nights ( because of the moisture source), was probably very shallow in the atmosphere. such that even the feeble sun combined with some wind was able to mix out that cool layer. anyway, last day of this warmth ...then some more seasonal days for week. looks like mid next week we might burst back to another warm anomaly of similar proportions to this exiting one.
-
yesterdays almost imperceptible and unacknowledged bd front that drifted thru and injected an e to ese oceanic taint into the region, is consequentially holding temperatures down this morning. the warm days recently were fragile, just enabled by the larger surrounding synoptics... they were fragile because the air was so dry. but the imparting of wv from even that weak onshore flow penetrating inland, thermodynamically cooled the air mass closer to wb overnight. the morning dense fog around eastern zones was the tip off as a result, we are technically in the same synoptic arena as yesterday - until this front comes through later on .. - but with the inject of water resetting the llvs closer to the wet bulb, we are a full 10 f below yesterday at this time. hint, wet air takes more energy to raise the temp than does dry air. ...not that anyone asked. lol we'll see but it does seem difficult for 78 today now that the sun is laying down on the southern tree tips at zenith and only dumping in tepid energy.
-
It’s funny how these unprecedented phenomenon are happening all over the world, with increasing frequency … yet we’re not allowed to blame any specific one of them on cc… lol eventually … the frequency will have increased to the point where it’s just … welp, all the time ie, the new climate, and it still won’t be because of cc
-
yeah was thinking about adding ... +4 isn't necessarily death knell n of nyc latitude. more problematic down here than up there, of course. but even here, we can put up a warm month to that scale, and still couch a couple blue bombs for the course. although, i'd caution snow hopefuls that our 'flop direction' is no longer negative like 20 whatever years ago. back in the day, a 'hole punch' modeled 850 mb thermal field ( pockets of -.5 in a sea of +1s), tended to verify snow and noodles after dynamical hammering. as an aside on this, ... unclear if this is cc doing this - not making a statement there. it could certainly be the modeling physical evolution is the culprit. either way, we've observed that marginally modeled events are tending to end up more wet. so, having said all that ... yeah, you don't count on our latitude 'as much' with +4. we're getting closer to nj climate and that's just something that we adults of our industry and passion are fully aware of and see the incontrovertible truth of it. just sayn' my methods are probably quite simple comparing other's opuses... lol. that being heavily persistence reliant, + the whopper solar max and the rather robust warm polar indices/lag correlation on winter, + cc induced stronger than normal jet velocities/mid latitude balanced geostrophic wind potential causing the wave numbers to favor subtropical ordinance.


