

Typhoon Tip
-
Posts
44,568 -
Joined
-
Last visited
Content Type
Profiles
Blogs
Forums
American Weather
Media Demo
Store
Gallery
Everything posted by Typhoon Tip
-
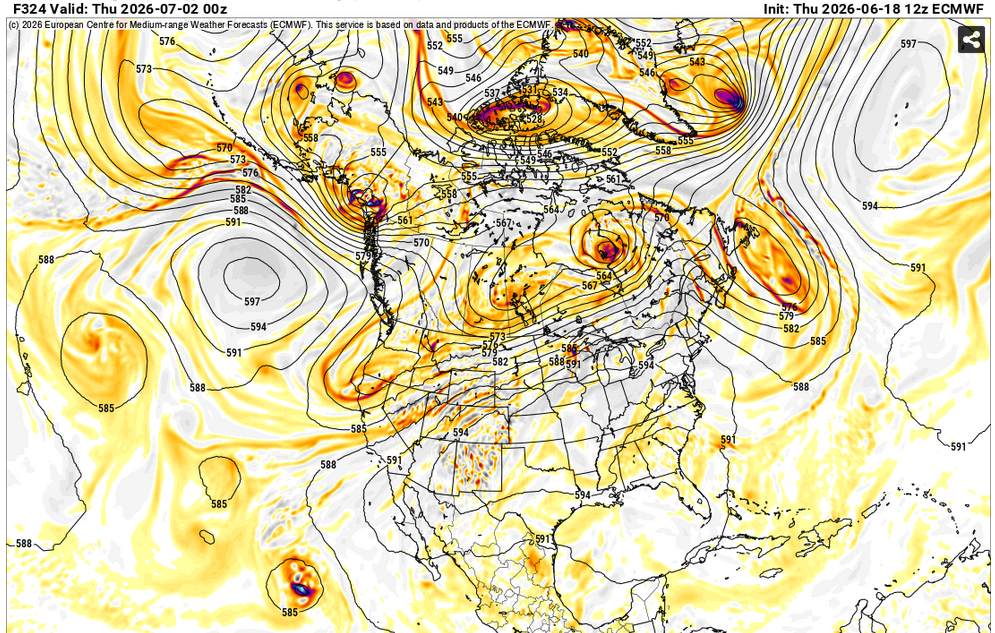
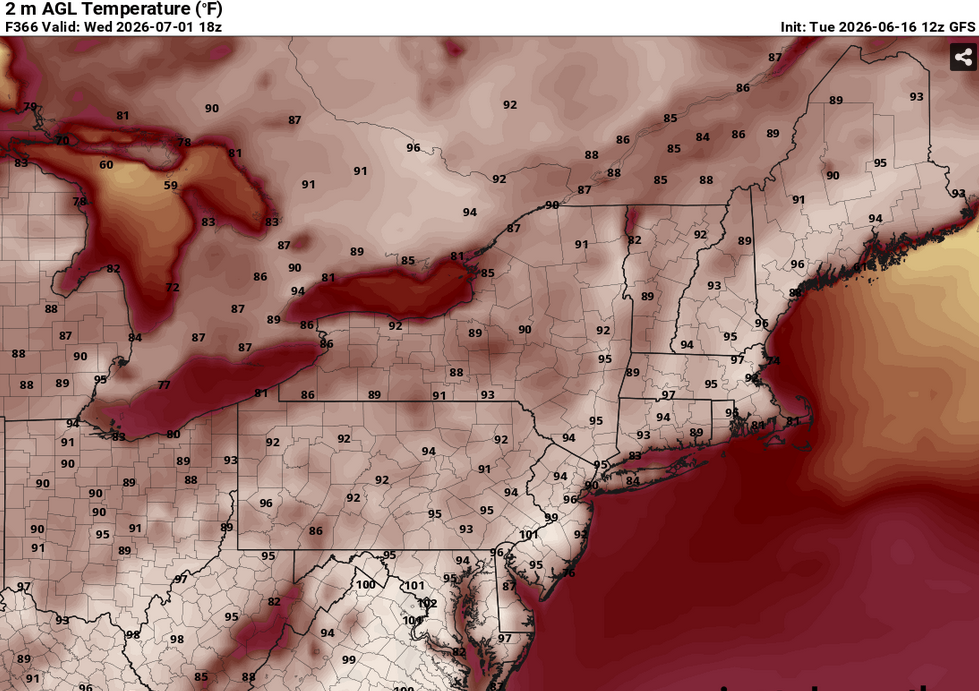
Dangerous heat signal on this Euro run... GFS not as aggressive but hints. Granted these are around the 1st of July, so it may just be eye candy for heat enthusiasts
-
Just got my 80 ... 80/67 rustling breeze with cracker alto strata and a few scud shred moving swiftly underneath. Intervals of sun. Actually feels like an tropical island morning.
-
This could be fun... we clearly have a warm frontal thrust/wedge now up to EEN and we're opening the skies to sun. Temp popped 4-6F in the last hr west of ORH up through FIT and across my region. 79/67
-
yeah SPC mentioned 'low top' in their coverage. I suspect they went tor out of respect for the llv jet in the area.
-
Decent destabilization going on ... 77 to 80 suddenly with 66 dps. Sun splashing and a nice llv S jet wobbling the trees. any thunderstorms rollin into this will be set up with +helicity
-
T-watch Envious threat primarily N of Weatherwiz
-
Warm boundary slipping thru now... 75/68 sky light breaks 69/64 under schmutz last hr
-
There is a 24 hour tele connector that exists because it’s statistically significant that’s all I’m gonna say I honestly don’t need the meteorology lesson
-
Heh... they did expand the Slght into NE after all
-
agreed... wild digression ...buuut: all of society is bottle-necking reliance with technology. While doing so, there's no redundancies. There should be back up systems that achieve the same tasks, like in "off" mode, ready to be turned on in the event of calamity. It's getting closer to a one system handling everything. Banking, to heart surgery, to flying airliners, to surfing porn on the web, and everything else that machines civility along, if that one agency goes down, heh... It's too easy to even write that Sci Fi dystopian novel. First, make the entire species slaved to one system, which is eventually either by design or hostility, taken over by a proverbial Skynet type agency ...and well, shit - we've already seen that movie, huh. But anyway, I see this kind of thing all the time. I wish they still would run old systems that worked, but were abandoned because of the evolution of ease and convenience. Like if the NBM future system has an outage... we can still look at the constituent parts.
-
Yeah.. this is what I was suggesting to you yesterday ... there's a warm boundary that the Euro and GFS are less coherently defining. The NAM on the other hand is kinking the PP enough to suggest a triple point goes underneath Logan. I have seen both scenarios verify in situations like this. I am not presently seeing anything that argues for either. About split.
-
mm... this doesn't lower the value nor significance of the statistical correlation - which is synoptic/ holistic in scale. Not a discrete convective level/meso analysis/indicator. Which there are no known telecons that can be that predictively discrete. For obvious reasons... The point is that the set ups tend to move that incremental spatial-temporal range in the 24 hour window. Hell, not every +PNA/-NAO creates a winter storm here, either, and that's dealing with scales that are far more obvious to the physics.
-
in this case, not any specifics, but I’m better than 50/50 that cool ‘potential’ before the end of June, we are in back below normal, is subjected to being modified ….how much so remains to be seen… And that bigger heat’s likely returned by July 1 … which means it could even be earlier
-
Lol well, I’m not in any kind of troll fight between you two I’m just trying to clarify what I’ve already said many times too, about those probability charts, but everybody keeps posting them like it’s a colder than normal outlook. He may not have intended that just makin sure .
-
You sound far too certain of that for 222 hours out Also keep in mind those are probability charts are not actually cooler than normal in the scaler sense It’s telling you, there’s a low chance for cooler than normal and it doesn’t say how much cooler is normal either
-
2026-2027 Super El Nino
Typhoon Tip replied to Stormchaserchuck1's topic in Weather Forecasting and Discussion
Seemin' like y'all tryin to will a super phat dope ass nuclear nino -
Drive 12 hours in any direction on land and you're still 90 or better
-
-
Yeah, SPC is taking the typical NE approach in stopping short of our lat/lon for slight and period 5s. But I can imagine that will need to be extended NE.
-
Mm...it sounds sorta like you're idealizing against a Plains profile in the back of your mind. Not trying to tell you what you're thinking- just seems that way... If so, no. We don't do that around here - not very often anyway. EOF 1 and 2 swarms. In 1954, we set up 4,000 foot tall stove pipe finger of god and sent it drillin' for oil down near Worcester... In 2010...sort of hybrid of that in Monson. Otherwise, that's apples to oranges for low LCL events. High shear/helicity profiles spin even meager updraft motion, lower in the troposphere. Which ... not all the models concur on that profile, admittedly - some have the warm front clearing house (NAM). However, I'm also using an a-priori in knowledge/experience. Warm boundaries don't just waltz on thru like the models are doing Thursday morning. So I could be wrong there. If the warm front, incongruent to our climate as it may be, effortlessly and without resistence ... sails on past by 15z, we'll see the blue tinted hill side under blazing sun-wasted torrid miasma of 76F DPs because of weak sauce lapse rates and insufficient triggers. But there is one other option...hm. You know, I'm not sure this is an analog - probably not at discrete analysis... but it does remind me of June 1987 ..I think it was around the 10th or 15th.. A morning warm front with elevated convection that actually became severe ... sending warned cells through midriff ORH county ... It all passed off by noon with abrupt clearing. The warm front cold front wedge was then in place. By 1:30...full sun soared T over TD ... 86/73. An explosion of thunderstorms erupted up the Mohawk Trail W of ALB, and as it came ESE ... it evolved into a small Derecho ( probably would have been a big one if it didn't move out over the ocean later that evening...). It came down Rt2 with routine gusts to 70mph, quarter sized hail, and a lot of power outages during the evening.
-
Watch Michigan the day before ... tomorrow afternoon and evening. There's a little known 24-hour lead/lag Michigan to Massachusetts telecon that exists - and in this case ... the chart progression makes obvious the reason why.
-
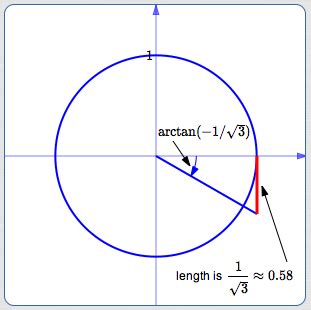
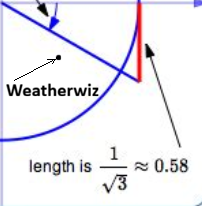
That's what really popped out of the data for me was the shear... About as high as it can be - Anytime I have a chance to lose my audience in here, I take it! so here we go: whenever you see high arctan angles ... ex, .... resulting from curvature of the pressure field ( the circle), and you are in the SE quadrant of a total cyclonic envelope like below, you have large +helicity where ... ...is located. Throw the fact that there's prooobably a warm boundary subtended/cutting straight across the tendency to turn, with it's excessively focused frontal induced curvature sending local tendencies into insane SRH... that becomes a total constructive feedback that sends roof tops on a magic carpet ride. Now... consider the 570+ thickness advection clear to Brian's latitude, with 576 testy hairs tickling the pike... with QPF smeared around the illustrations? That means you have very low LCL's to draw any rotating columns down into the boundary layer. ...as though that's even needed given the former constraints. my god I mean ... may as well just put a tornado warning for everywhere now and call it a day
-
I think it's one of those days where satellite is lying everywhere. There's more black than white on vis looping yet I'm getting something like 1/4th sun per hour
-
Not to overstep or bypass your statement. It is interesting that the single one year overshot so far. More on that in a moment... For me, the bigger story is that despite that record holding as long as it has, the year-to-year deltas since have in total averaged negative. In fact, an aspect that's been going on for decades prior to 2012 for that matter. Global ice, not just sea ice, began receding around 1850 - altho it's accelerated notably since 2000. So, a rather low bar of intelligence can infer we are at risk of another plummet at any time. However, I think what 2012, and the 2023 (unilateral atmospheric/sea-temperature coupled explosion of thermal imbalance) both implicate is troubling: the global climate system is capable of moving in unpredictable thrusts. Not in a steady, predictable, thus easier to plan and adapt, linear ascent. Even though 2023 seemed to cause a pause, followed by flurry of pimped out memes, there nothing in the climate reconstructions that suggests that wouldn't happen. I mean geological history is not smooth nor a predictable practice. So epistemically it should never be a surprise to anyone. When's the next thrust?
-
I realize there's a drought meme popularity right now. It is vying for second place to this other sweeping grand Disclosure stuff, where is apparently going to cause a global 'ontological shock' risking civility meltdown. Yeeeah. We'll see about thaaat. If there's a meltdown it's prooobably not coming from ... whatever that means. But in the meantime, in so far as around here? - absolutely 0 physical manifestation of any problem with water deficit. We go through this every year. Yes, promoted by the U.S. Drought Monitoring, then set forth by their primary sales agent, Kevin's emceeing the desiccation destruction of the world... We read this same sentence every year, though: "We go through this every year" Yet, y'all just can't wait to pack the reception hall again. I guess we're an easy audience - I don't just mean us in this social media. I mean human condition of 2026 and the last 50 or so years of this ongoing socio-technological evolutionary experiment. We've become stimulation junkies for it. But when you look out the window at any moment, that still quiescence, that is what is happening. Everything else is human fabrication. Human actions. Human interactions. Yet this latter has become reality as though reality is unstoppable. 100% of everything that the world presently faces, at macro to individual scales of potential harm or crisis, is 100% human caused. Including, Climate Change. Ironically, a consequence that is largely construed as the lie. Despite being utterly empirically undeniable. This is the dangerous paradox of our times. There's this "right" to flout objective truth. It might even be a defense mechanism. If one cannot believe any of it due to the loss of public faith, they'll turn to what gives them comfort. Basic psychobabble. In either case, we've somehow arrived to a time in history where the freedom and entitlement to believe whatever one wants, givens them a right to deny objective reality. It's bad too... you point out 1+2=2 to commoners at this point, they nod and return to whatever piece of shitness they are. Penetrating truth into anyone's complete nonsense has become almost insurmountable. So they carry on.. litigating in favor of what they want over objective reality, and while not accepting the latter, that is the real harm. This is an elegant self-impost extinction event - one that is probably caused by our own innovation. Well... maybe a some are coming around... But I tell you what, in my aggressive opinion ( LOL ), it is still largely and unanimously denied. Until the ballast of humanity stops doing what it that is causing the problem, to persist means there's too little acceptance. Kind of analogous to an alcoholic bargaining. Bargaining in the context of alcoholism refers to the mental process where individuals admit to a problem with limited intent ... a time in which they continue to engage in addictive behavior. This form of rationalization is a fallacy of control, which is really a psychosis for minimizing its impact. This can lead to a cycle of relapse and worsening symptoms, including psychosis, which can manifest as hallucinations or delusions during heavy drinking or withdrawal. Sound familiar? Like Disclosure I saw the movie yesterday. As science fiction art it was fantastic.


