

GaWx
-
Posts
19,126 -
Joined
Content Type
Profiles
Blogs
Forums
American Weather
Media Demo
Store
Gallery
Everything posted by GaWx
-
Ray, I have no issue, whatsoever, in anyone emphasizing the significance of the restrengthening -PDO, especially since I very recently posted about the up to date WCS PDO plunge. But it got out of hand from there and I’m trying to do whatever I can to get it back on track. That’s why I’m responding to your post here in banter. I’m not taking sides but just want that great thread to get back on track with high quality discussion.
-
2026-2027 Super El Nino
GaWx replied to Stormchaserchuck1's topic in Weather Forecasting and Discussion
Folks, this thread has had great met. discussion recently. Please don’t let it get out of hand. Because this is my favorite met. thread at this BB, I’d appreciate it if the El Niño banter thread were used instead for certain posts, which is easy to do by quoting a post from here and responding to it at this link: -
1. Today it hit 100 for the high at KSAV for the 3rd day in a row, which hadn’t happened since that unforgettable record hot late May of 2019!2. Although the chance wasn’t even mentioned since it was only 10%, the Savannah area had sudden evening pop-ups as a result of an outflow boundary coming S from earlier SC convection that collided with a W moving seabreeze per radar. It’s so cool to see these collisions! At my home, I had a big temp. drop along with gusty winds and loud thunder. Several gusts to 43 mph were measured just off of Tybee. I had two short periods of rain, but together they amounted to only ~0.01”. Other areas in the county like to the SW, to the S (Montgomery), and to the SE, especially Skidaway Island, had significant to heavy amounts. As a matter of fact:PRELIMINARY LOCAL STORM REPORT NATIONAL WEATHER SERVICE CHARLESTON SC 1042 PM EDT SAT JUL 11 2026 .TIME... ...EVENT... ...CITY LOCATION... ...LAT.LON .DATE... ....MAG.... ..COUNTY LOCATION..ST.. ...SOURCE. ..REMARKS.. 1015 PM RAIN 1 NE SKIDAWAY ISLAND 31.95N 81.04W 07/11/2026 M2.51 INCH CHATHAM GA MESONET UGA34 REPORTS 2.51 INCHES OF RAIN FELL OVER THE PAST 3 HOURS.
-
2026-2027 Super El Nino
GaWx replied to Stormchaserchuck1's topic in Weather Forecasting and Discussion
Looking at model SLP forecasts, I see a near certainty that the current -SOI streak will make it to 67+ days. That would then make it the 3rd longest -SOI streak on record (back to 1991). Will it make it past 72 days? That’s too far out to predict with confidence right now. But that appears to have a decent chance as of now. -
2026-2027 Super El Nino
GaWx replied to Stormchaserchuck1's topic in Weather Forecasting and Discussion
I just researched it. CMCC is an Italian climate model. I can’t find verification data, but +5.3C monthly peak isn’t going to happen on a RONI basis and almost certainly not even per ONI. If there had been other models near that, I might have given it a little more consideration. But with it 1.4C warmer than the 2nd warmest on that list and with that 2nd warmest, itself, already forecasting >1C warmer than the current record warmest, I find it hard to consider it even remotely possible. -
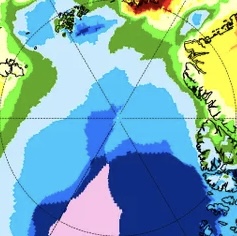
But for just 80N+, it is quite cold overall! Below is a closeup of just the 80N+ portion showing that overall it’s quite cold: 1. only ~1/7 is in warmest 1/2 of years vs ~6/7 in coldest 1/2 2. -a little >50% is in 4 coldest colors meaning coldest 11 of 87 -but only ~6% is in warmest 11, which is <1/8 the size of coldest 11 3. -~25% is in coldest 3 of 87 -but only ~1% is in warmest 3 of 87, which is a mere 1/25 of the size of coldest 3
-
100.0F right now (4:48PM) at my home!
-
2026-2027 Super El Nino
GaWx replied to Stormchaserchuck1's topic in Weather Forecasting and Discussion
After rising to -0.19 on June 24th, the WCS daily PDO has since plunged and is as of July 9th down to -1.50, which is the lowest daily PDO since way back on Nov 8th! -
2026-2027 Super El Nino
GaWx replied to Stormchaserchuck1's topic in Weather Forecasting and Discussion
The TAO buoy data, including the Dateline data found at the links below, totally confirms Roundy’s noting of the lack of a consistent 30C isotherm E of the Dateline in 1997 when considering SSTs along the 180 and 170W longitudes and comparing those to 1997 to 2026. But it’s also important to keep in mind that there’s been a large amount of GW since 1997. So, that by itself gives 2026 a significant advantage. That’s of course why relative measures have been incorporated in products by NOAA and some others worldwide. That being said, this isn’t meant to minimize the significance of what Roundy said as it’s still a big deal! That’s the beauty of the SOI. It doesn’t appear to be substantially affected by GW and thus the comparison to past years. TAO buoy historical data: https://www.pmel.noaa.gov/cache-tao/sb1/deliv/data1897934/sst5s180w_dy.ascii https://www.pmel.noaa.gov/cache-tao/sb1/deliv/data1897934/sst0n180w_dy.ascii -
2026-2027 Super El Nino
GaWx replied to Stormchaserchuck1's topic in Weather Forecasting and Discussion
Thanks, Adam. So, Long Paddock after ~a week finally came back to updating its daily SOIs. This is what I earlier posted about this: In doing so, it also retroactively changed some dailies prior to July 3rd. What’s most interesting is that those changes changed what had been 2 small positives to negatives: June 18th/19th changed from +4/+1 to -4/-4. Based on the original June 18th release of +4, a 37 day -SOI streak had apparently ended June 18th. However, with these changes, it didn’t and thus we’re in a very long -SOI streak that’s now at a whopping 62 days and is still going strong! How does this compare to the longest back to 1991? -100 days in 1998 -72 days in 1997 -66 days in 2015 -65 days in 2023 -62 days and counting 2026 -
I’d love for this to be true. However, unfortunately: The administration has a new climate change office. It’s headed by a climate critic. The office that produces the National Climate Assessment has been reconstituted, after the administration gutted it last year. https://www.politico.com/news/2026/07/09/the-administration-has-a-new-climate-change-office-its-headed-by-a-climate-critic-00990916 ————————— Spreading climate misinformation is fast becoming a shortcut to popularity across right-wing media. This man’s rise proves it. Matthew Wielicki makes baseless claims about climate change and is now a budding star in the climate denial community https://www.mediamatters.org/climate-deniers/spreading-climate-misinformation-fast-becoming-shortcut-popularity-across-right
-
2026-2027 Super El Nino
GaWx replied to Stormchaserchuck1's topic in Weather Forecasting and Discussion
Thanks, Chris. Wow! 1. Am I correct in assuming this 0Z Euro map referring to record high H5 for 6Z of 7/14/26 centered on the N Plains is for ALL dates rather than just for July 14th? 2. Do you have a link to a source for record highest and lowest H5 for all dates for any location? -
Thanks, Chris. From that ECMWF “data information sheet” link, the 80N+ mean is strongly biased toward the portion closer to 90N and thus shouldn’t be used for determining actual mean. I’m educatedly guessing that that’s the reason for its cold bias. OTOH, it also says comparing one year to another, which I’ve also been doing, can still be done: “Since the data are gridded, it is straightforward to deduce the average temperature North of 80 degree North. However, since the model is gridded in a regular 0.5 degree grid, the mean temperature values are strongly biased towards the temperature in the most northern part of the Arctic! Therefore, do NOT use this measure as an actual physical mean temperature of the arctic. The 'plus 80 North mean temperature' graphs can be used for comparing one year to an other.”
-
2026-2027 Super El Nino
GaWx replied to Stormchaserchuck1's topic in Weather Forecasting and Discussion
Based on my own look just now at the comparison of anomalies in the 4 Nino regions, I have only 4 clearcut Modoki El Niño events since 1950: 1. 1968-9: Month……..1+2……3……3.4……4 Nov………-0.1……+0.1….+0.5…+0.4 Dec………+0.2….+0.4….+0.7….+0.6 Jan………-0.2……+0.5…..+1.0….+0.9 Feb……..-0.8…….+0.3…..+1.1…….+1.1 Mar……..+0.3……+0.2……+0.5.…+0.6 2. 1977-8: not as Modoki as 68-9 Month……..1+2……3……3.4……4 Nov……….-0.5…..+0.2….+0.5…+0.3 Dec……….-0.6…..+0.3….+0.7….+0.4 Jan……….-0.4…..+0.1…..+0.6…..+0.4 Feb……….-0.4…...0.0……+0.3…..+0.2 Mar……….-1.2……-0.5…..-0.2…..-0.1 3. 2004-5: the most Modoki Month……..1+2……3……3.4……4 Nov……...+0.7…..+0.6…+0.7….+0.8 Dec……..+0.4……+0.7….+0.7….+0.9 Jan……...0.0……..+0.3…..+0.7….+0.9 Feb……..-0.9…….-0.1…….+0.4…..+0.7 Mar……..-1.5…….-0.1…….+0.5……+0.6 4. 2014-5: 2nd most Modoki Month……..1+2……3……3.4……4 Nov……….+0.8….+0.8…+0.8…+0.7 Dec………+0.4….+0.7…+0.7….+0.8 Jan………-0.2…..+0.4…+0.5….+0.8 Feb……..-0.5…..+0.1….+0.4….+0.9 Mar…….+0.1…..+0.1….+0.5…..+0.9 So, based on the above, the most Modoki (W based) El Niño events since 1950 were (starting from strongest): 1. 2004-5 2. 2014-5 3. 1968-9 4. 1977-8 Based on this, it appears to me that regarding wintry precip in El Niño seasons, the SE (based on ATL and RDU) seems to do somewhat better with C based (3.4 with clearly the warmest anomalies) than Modoki/W based. If I’m not mistaken, the NE tends to do better with W based (Modoki) over C based. Please correct me if that’s wrong. Interesting! https://www.cpc.ncep.noaa.gov/data/indices/ersst5.nino.mth.91-20.ascii -
2026-2027 Super El Nino
GaWx replied to Stormchaserchuck1's topic in Weather Forecasting and Discussion
Indeed! Yeah, Chuck, it’s confusing because when I searched for it, I first found the new FB post, dated 7/2/26. At first it looked on the surface like a new record/first time over 100 in Arctic Circle based on the 1st 2 paragraphs. But then the 3rd paragraph said that on June 20, 2020, it hit 38C/100.4F. Then I was curious to see the comments below. The first one incorrectly said that was Antarctica lol. Then the 2nd comment said that it was 6 years ago and was critical of the story being posted now for no good reason other than to confuse. -
2026-2027 Super El Nino
GaWx replied to Stormchaserchuck1's topic in Weather Forecasting and Discussion
“In 2020, the town of Verkhoyansk, Russia, reached a temperature of 100.4 degrees Fahrenheit, the highest temperature ever recorded in the Arctic Circle.” https://www.upi.com/amp/Top_News/2026/06/20/On-This-Day-Arctic-Circle-reaches-record-setting-100-degrees/2481781913298/ -
2026-2027 Super El Nino
GaWx replied to Stormchaserchuck1's topic in Weather Forecasting and Discussion
Hey Chuck, Do you have a link? The only thing I saw was a story from just a few days ago but it said that on 6/20/20 it hit 100.4F at Verkhoyansk, Russia (Siberia): https://www.facebook.com/story.php?story_fbid=1023286790456624&id=100083259374691 -
2026-2027 Super El Nino
GaWx replied to Stormchaserchuck1's topic in Weather Forecasting and Discussion
July 8th mean 80N+ temp. (C) per DMI: 2026: 273.1 (barely below freezing and lowest on record (to 1958)) 2025: 274.1 2024: 274.5 2023: 274.2 2022: 273.8 2021: 273.9 2020: 274.3 2019: 274.3 https://download.dmi.dk/pub/plus80N_temperatureindex/ -
Very strong storm incoming! Very windy and fierce looking skies just to west! Small limbs falling! A few big raindrops. So far just a few big drops. This batch formed per radar from collision of inland outflow and seabreeze boundaries. Cool stuff! Rarely a dull moment this time of year. Edit 9:20 PM: There was never more than a trace from those aforementioned few drops at my place. However, there was heavy rain for a pretty short period from the NW part of the county to downtown and also from Skidaway and Wilmington Islands to Tybee. In addition, much of the coastal counties of S SC got plentiful rain.
-
After 3 99s this summer so far, KSAV had 100 today!
-
Thanks, Chris Keep in mind that even when assuming a bias, this is the coldest chart late May through early July overall for 80N+ compared to the same charts back to 1958. So, isn’t it an apples to apples comparison if one says it’s the coldest DMI chart for 80N for this period?
-
2026-2027 Super El Nino
GaWx replied to Stormchaserchuck1's topic in Weather Forecasting and Discussion
Per TAO, 5 day averaged SSTs of 30C+ reached not only 180 but also to 170W at 0N as early as April 22nd of 2015: Location: 0N 170W 22 Apr 2015 to 22 May 2015 ( 7 times, 1 blocks) Gen. Date Jul 9 2026 Units: Sea Surface Temperature (C), -9.99 = missing Time: 1200 22 Apr 2015 to 1200 22 May 2015 (index 1 to 7, 7 times) Depth (M): 1 QUALITY YYYYMMDD HHMM SST Q 20150422 1200 30.04 1. 20150427 1200 -9.99 0 20150502 1200 -9.99 0 20150507 1200 29.85 1 20150512 1200 29.89 1 20150517 1200 29.91 1 20150522 1200 30.06 1 Time: 1200 3 Dec 2015 to 1200 2 Jan 2016 (index 49 to 55, 7 times) Depth (M): 1 QUALITY YYYYMMDD HHMM SST Q 20151203 1200 30.62 1 20151208 1200 30.68 1 20151213 1200 30.76 1 20151218 1200 30.53 1 20151223 1200 30.26 1 20151228 1200 30.29 1 20160102 1200 30.23 1 —————— This year it was still <29C in April and took til June 1st to exceed 30C although it’s been mainly rising since: Location: 0N 170W 2 Apr 2026 to 6 Jul 2026 ( 20 times, 1 blocks) Gen. Date Jul 9 2026 Units: Sea Surface Temperature (C), -9.99 = missing Time: 1200 2 Apr 2026 to 1200 6 Jul 2026 (index 1 to 20, 20 times) Depth (M): 1 QUALITY YYYYMMDD HHMM SST Q 20260402 1200 28.01 2 20260407 1200 28.14 2 20260412 1200 28.35 2 20260417 1200 28.65 2 20260422 1200 28.74 2 20260427 1200 28.94 2 20260502 1200 29.17 2 20260507 1200 29.36 2 20260512 1200 29.34 2 20260517 1200 29.67 2 20260522 1200 29.59 2 20260527 1200 29.82 2 20260601 1200 30.05 2 20260606 1200 30.38 2 20260611 1200 30.42 2 20260616 1200 30.59 2 20260621 1200 30.58 2 20260626 1200 30.56 2 20260701 1200 30.55 2 20260706 1200 30.46 2 https://www.pmel.noaa.gov/tao/data_deliv/deliv-nojava.html @snowman19 -
2026-2027 Super El Nino
GaWx replied to Stormchaserchuck1's topic in Weather Forecasting and Discussion
The WCS daily PDO has plunged from -0.19 on June 24th to -1.43 just 2 weeks later: -
2026-2027 Super El Nino
GaWx replied to Stormchaserchuck1's topic in Weather Forecasting and Discussion
Dips: below -26 in ‘25, ‘24, ‘22, ‘18, ‘15, ‘12, ‘10, ‘07, ‘05, ‘96, ‘94, ‘84; But none in 1983-1948: why? -
Meanwhile, per DMI charts back to 1958, the mean temp. for the Arctic N of 80N continues being the coldest on record (I’ve been looking at all years’ charts) thus continuing the coldest overall there since the 2nd half of May:


