GaWx
-
Posts
19,132 -
Joined
Content Type
Profiles
Blogs
Forums
American Weather
Media Demo
Store
Gallery
Everything posted by GaWx
-
1.5 hours ago it was looking like ATL could have snow before noon. And now you two both think it probably won’t snow at all?
-
But we were just talking about the possibility of snow starting in ATL area by late morning.
-
Even near the airport? What’s changed?
-
14Z HRRR has spot on dewpoints in ATL and GA in general as of 10AM fwiw. But 12Z NAM 10AM dewpoints too high as KATL at 17F vs reality of 8F. It has dewpoints in other parts of GA also too high. Something to keep in mind when considering qpf differences between the two models at least in GA. HRRR may be more realistic.
-
I suggested my sis tell my bro in law, who just left for work, to return home out of caution just in case. Don’t know when he’s planning to come home. He works at airport and lives near Emory Univ. All schools closed there today unlike the 1/2 day they had in 2014, thank goodness. Good advice to ask him to come back home now?
-
Any guesses as to when measurable snow will start in Atlanta area? Should folks go to work for 1/2 day or is there risk of 1/29/2014 snow jam again? That’s what happened then. Schools went for 1/2 day and they got stuck at 11-11:30AM or so. I had told my sis to keep kids home, which she did, then based on radar/obs. She was thankful. Is today going to be repeat?
-
6Z HRRR did better in Houston than Euro, GFS, and NAM with it lighter there (0.15”). It also got Baton Rouge almost perfectly with 0.03” vs actual of 0.04”. So, better than GFS/Euro in Baton Rouge.
-
Baton Rouge modeled amounts 1-7AM EST 6Z runs: Euro 0.17” GFS 0.25” Actual 0.04” BATON ROUGE LGT SNOW 27 22 81 NE8 30.55R WCI 19 6HR MIN TEMP: 27; 6HR MAX TEMP: 37; 6HR PCP: 0.04; Is this significant?
-
HOUSTON BUSH LGT SNOW 28 23 81 N17 30.55S VSB 1 WCI 16 6HR MIN TEMP: 28; 6HR MAX TEMP: 31; 6HR PCP: 0.10; HOUSTON HOBBY LGT SNOW 28 25 88 N16G25 30.52S FOG WCI 16 6HR MIN TEMP: 28; 6HR MAX TEMP: 32; 6HR PCP: 0.01; *HOUSTON SW AP LGT SNOW 29 26 90 NE9G22 30.56R WCI 20 6HR MIN TEMP: 29; 6HR MAX TEMP: 32; 6HR PCP: 0.09 So, 6 hour precip 1AM-7AM EST Houston area measured max of 0.10”. That’s lighter than these 6Z runs have fwiw: 6Z GFS: ~0.20” 6Z Euro: ~0.20” 6Z NAM 3 km ~0.20” Is the lighter than modeled amount having fallen in Houston area 1-7AM EST significant? Anyone have an opinion?
-
That must be the 12km NAM. Here’s the 3km NAM, which has ~no snow in ATL vs 3.2” on the 12km: Check out the reason: N end of qpf on 3km NAM is quite a bit south on 12km NAM: 6Z NAM 3km qpf: ATL none 6Z NAM 12km qpf: ATL gets 0.35! Why? Isn’t the 3km more accurate?
-
As I posted in the storm thread, we had some snow pellets 12:50AM-1AM. Temp 35.4F with calm winds. Temp was earlier 33F. 850s are -1C. This is the first wintry precip here in 7 years!
-
We just got some snow pellets over the last 5 minutes since ~12:50AM! This came from the streak of wintry that gave you sleet earlier. First frozen precip here in 7 years. Here they were shaped like sleet but were softer and white. They made sleet like noises when landing. Temp 35.4F. Our modeled 850s are a bit colder, near -1C. Interesting that that light precip made it to the ground. Our dewpoint isn’t overly low, low to mid 20s. I’m easily excited!
-
0Z Euro sleet 0Z ZR:
-
Indeed, here’s 0Z Euro qpf: Here’s Kuchera:
-
0Z Euro NW shift vs 18Z
-
The sleet is consistent with the modeled 850s of +1 as of now at AYS.
-
0Z GFS is a big hit of a mix in SE GA/S SC: Kuchera snow IP: ZR:
-
0Z GFS qpf: fairly similar to 18Z
-
0Z GFS early maps look pretty similar to 18Z fwiw.
-
Houston started having sleet at 8PM EST/7PM CST. I wonder how that compares to the timing of the qpf start on various models.
-
0Z ICON: slight SE shift vs 18Z 0Z 18Z was a little to the NW of 0Z
-
It’s important that current dewpoints be compared to modeled dewpoints: Example: KATL actual 9PM DP is 0F What do models show for 9PM there? 0Z 3K NAM: way up at +14F! It’s 14F too high! 0Z NAM 12K: +10F (10F too high) 18Z Euro: +3F (only 3F too high…so very close) 18Z GFS is -10F (10F too low) So, 18Z Euro is by far the closest for KATL. You guys might want to check your locations as dewpoint will be very important in determining how long it will be virga. For here, Euro is spot on making it easily closest to reality like at KATL.
-
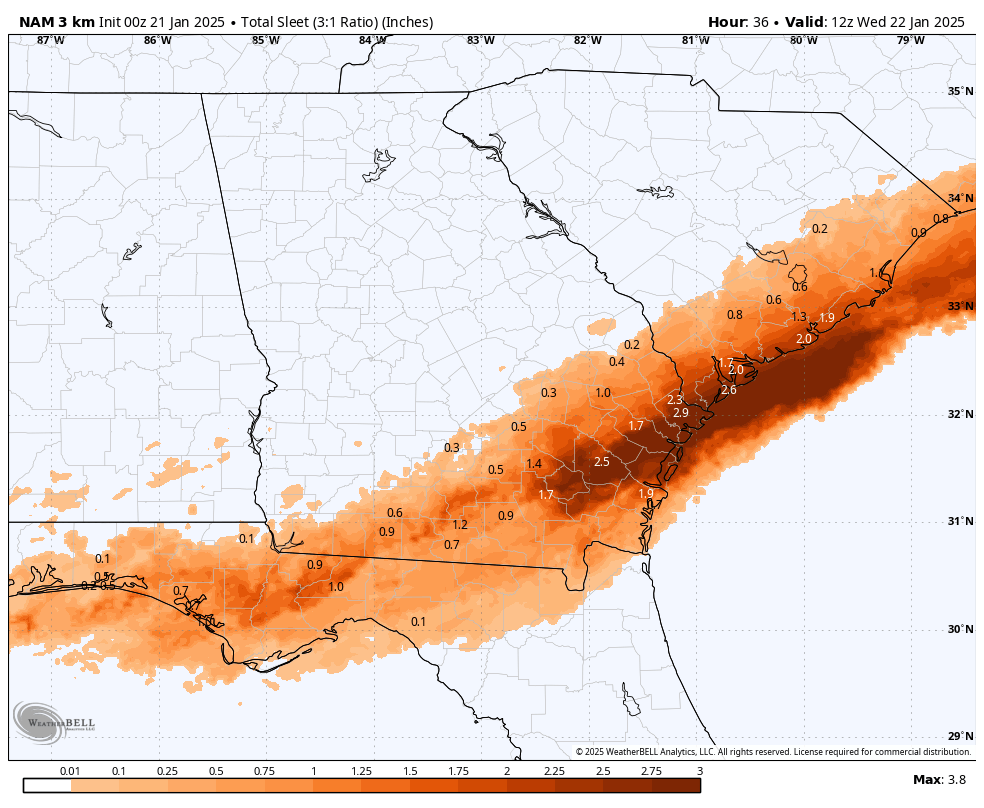
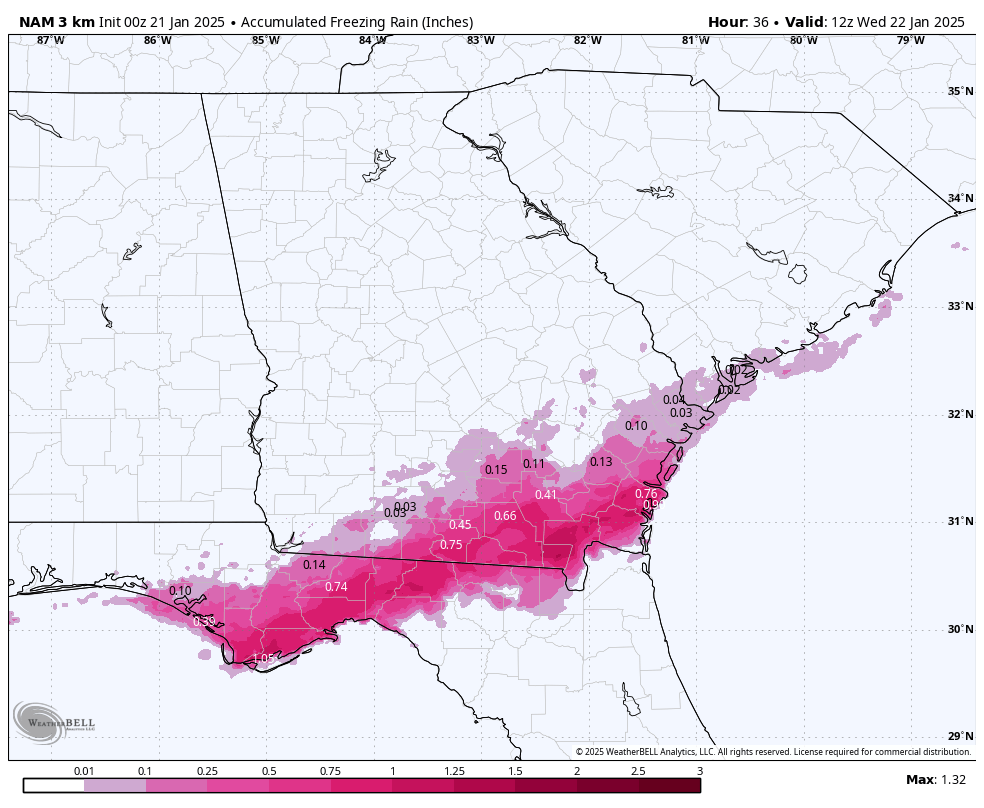
0Z NAM going north means more sleet and ZR down here on it: now may go ahead and charge my backup power packs in case ZR ends up dominating and is heavy sleet: would undoubtedly be alltime record IP by far in SE GA: some of this is off the top end of the chart! @dsaur


-
Compare that to 0Z NAM radar as of 9PM: And 10PM radar as if 10PM: p
-
0Z NAM a good bit further N!