

donsutherland1
-
Posts
23,782 -
Joined
Content Type
Profiles
Blogs
Forums
American Weather
Media Demo
Store
Gallery
Everything posted by donsutherland1
-
Under variably cloudy skies, readings reached the upper 60s and lower 70s today. Newark reached 70° for the 166th time this year. As a result, 2021 now as the 11th highest figure on record. Tomorrow will likely be a bit warmer. Sunshine and much above normal temperatures are likely Thursday and Friday. Saturday will be another very warm day, but some showers are even a thundershower are possible as a strong cold front moves across the region. Behind the frontal passage, readings will return to near normal levels. The MJO is currently passing through Phase 5 at a very high amplitude. During the 1991-2020 period, there were 6 cases with passage through Phase 5 with at least three days at an amplitude of 1.500 or above: 1998, 2000, 2004, 2010, 2017, and 2020. There was a strong signal for the second half of October to wind up warmer than normal (83%) cases in the New York City area. However, that signal broke down to a 50-50 split for the first 10 days of November. That hints at possible timing for a pattern transition depending on the pattern evoluton and changes in the teleconnections. Fall 2021 will likely be wetter to much wetter than normal in the northern Middle Atlantic region. Since 1869, there have been 9 August cases where New York City picked up 20.00" or more rainfall during the summer. Two thirds of those cases (and 4/5 of those with summer mean temperatures of 73.0° or above) had 17.00" or more fall precipitation in New York City. 2011 is probably the closest match in terms of precipitation and a nearly identical summer mean temperature. Mean fall precipitation for those 9 cases was 14.86". The median was 17.35". The 1991-2020 normal value is 12.27". Following very wet July-September periods, winter (December-February) precipitation has typically been near or below normal. The most recent exception was winter 2018-19. The ENSO Region 1+2 anomaly was +0.1°C and the Region 3.4 anomaly was -0.7°C for the week centered around October 6. For the past six weeks, the ENSO Region 1+2 anomaly has averaged +0.08°C and the ENSO Region 3.4 anomaly has averaged -0.35°C. Neutral ENSO conditions will likely yield to La Niña conditions later this month. The SOI was +12.96 today. The preliminary Arctic Oscillation (AO) figure was -0.788 today. On October 10 the MJO was in Phase 5 at an amplitude of 1.864 (RMM). The October 9-adjusted amplitude was 1.704 (RMM). Based on sensitivity analysis applied to the latest guidance, there is an implied 90% probability that New York City will have a warmer than normal October (1991-2020 normal). October will likely finish with a mean temperature near 61.9° (4.0° above normal).
-
Such pattern changes have often occurred following passages when the MJO was in Phase 5 at a very high amplitude at this time of the year. The most recent such example was in 2010. October 16-31 was 1.9 degrees above normal. November 1-10 was 4.9 degrees below normal.
-
Morning thoughts… It will be partly to mostly cloudy and milder. High temperatures will likely reach the upper 60s and lower 70s in most of the region. Likely high temperatures around the region include: New York City (Central Park): 69° Newark: 73° Philadelphia: 72° Normals: New York City: 30-Year: 65.8°; 15-Year: 66.9° Newark: 30-Year: 67.4°; 15-Year: 68.7° Philadelphia: 30-Year: 68.7°; 15-Year: 69.6° A generally warmer than normal regime will continue into the weekend before a strong cold moves across the region.
-
Drier air moved into the region allowing for partly sunny skies and mild readings in the 70s. Newark reached 70° for the 165th time this year. As a result, 2021 is tied for 11th place with 1990 and 2017. Tomorrow will likely be a similar day. Sunshine and much above normal temperatures are likely from mid-week into the start of the weekend. Overall, the generally warm regime will continue into weekend before a strong cold front ushers in cooler readings. In the wake of the frontal passage, readings will return to near normal levels. Fall 2021 will likely be wetter to much wetter than normal in the northern Middle Atlantic region. Since 1869, there have been 9 August cases where New York City picked up 20.00" or more rainfall during the summer. Two thirds of those cases (and 4/5 of those with summer mean temperatures of 73.0° or above) had 17.00" or more fall precipitation in New York City. 2011 is probably the closest match in terms of precipitation and a nearly identical summer mean temperature. Mean fall precipitation for those 9 cases was 14.86". The median was 17.35". The 1991-2020 normal value is 12.27". Following very wet July-September periods, winter (December-February) precipitation has typically been near or below normal. The most recent exception was winter 2018-19. The ENSO Region 1+2 anomaly was +0.1°C and the Region 3.4 anomaly was -0.7°C for the week centered around October 6. For the past six weeks, the ENSO Region 1+2 anomaly has averaged +0.08°C and the ENSO Region 3.4 anomaly has averaged -0.35°C. Neutral ENSO conditions will likely yield to La Niña conditions later this month. The SOI was +2.32 today. The preliminary Arctic Oscillation (AO) figure was -0.038 today. On October 9 the MJO was in Phase 5 at an amplitude of 1.701 (RMM). The October 8-adjusted amplitude was 2.024 (RMM). Based on sensitivity analysis applied to the latest guidance, there is an implied 87% probability that New York City will have a warmer than normal October (1991-2020 normal). October will likely finish with a mean temperature near 61.8° (3.9° above normal).
-
Morning thoughts… It will be partly to mostly cloudy and milder. High temperatures will likely reach the upper 60s and lower 70s in most of the region. Likely high temperatures around the region include: New York City (Central Park): 70° Newark: 74° Philadelphia: 74° Normals: New York City: 30-Year: 66.2°; 15-Year: 67.3° Newark: 30-Year: 67.8°; 15-Year: 69.2° Philadelphia: 30-Year: 69.0°; 15-Year: 70.0° A generally warmer than normal regime will continue into the weekend before a strong cold moves across the region.
-
Yes. The PNA is forecast to turn positive. The weekend should turn cooler. It will be interesting to see how long this lasts.
-
An offshore storm brought clouds, a stiff east-northeasterly wind, and some light rain to the region. Rainfall amounts included: Atlantic City: 0.03"; Bridgeport: 0.04"; Islip: 0.11"; New York City: 0.11"; Newark: 0.33"; and, Philadelphia: 0.03". The rainfall at Central Park pushed the 2021 total to 52.22". That surpassed the 52.13" that fell in 1979 as New York City's 32nd highest annual figure on record. Warmer and drier air will start to return tomorrow, but it will be partly to mostly cloudy. Sunshine and much above normal temperatures are likely around mid-week. Overall, the generally warm regime will continue into at least mid-month. Fall 2021 will likely be wetter to much wetter than normal in the northern Middle Atlantic region. Since 1869, there have been 9 August cases where New York City picked up 20.00" or more rainfall during the summer. Two thirds of those cases (and 4/5 of those with summer mean temperatures of 73.0° or above) had 17.00" or more fall precipitation in New York City. 2011 is probably the closest match in terms of precipitation and a nearly identical summer mean temperature. Mean fall precipitation for those 9 cases was 14.86". The median was 17.35". The 1991-2020 normal value is 12.27". Following very wet July-September periods, winter (December-February) precipitation has typically been near or below normal. The most recent exception was winter 2018-19. The ENSO Region 1+2 anomaly was 0.0°C and the Region 3.4 anomaly was 0.0°C for the week centered around September 29. For the past six weeks, the ENSO Region 1+2 anomaly has averaged +0.07°C and the ENSO Region 3.4 anomaly has averaged -0.28°C. Neutral ENSO conditions will likely yield to La Niña conditions later this month. The SOI was -4.13 today. The preliminary Arctic Oscillation (AO) figure was +0.395 today. On October 8 the MJO was in Phase 5 at an amplitude of 2.025 (RMM). The October 7-adjusted amplitude was 2.236 (RMM). Based on sensitivity analysis applied to the latest guidance, there is an implied 85% probability that New York City will have a warmer than normal October (1991-2020 normal). October will likely finish with a mean temperature near 61.8° (3.9° above normal).
-
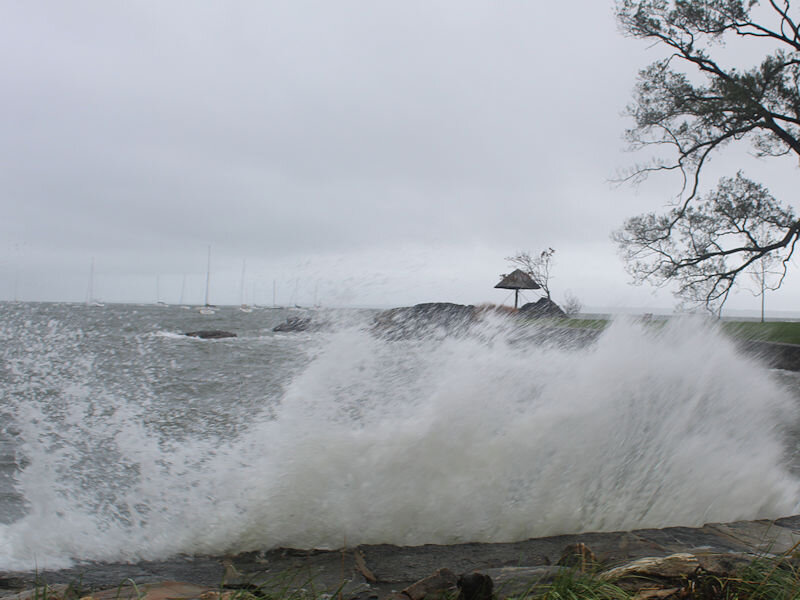
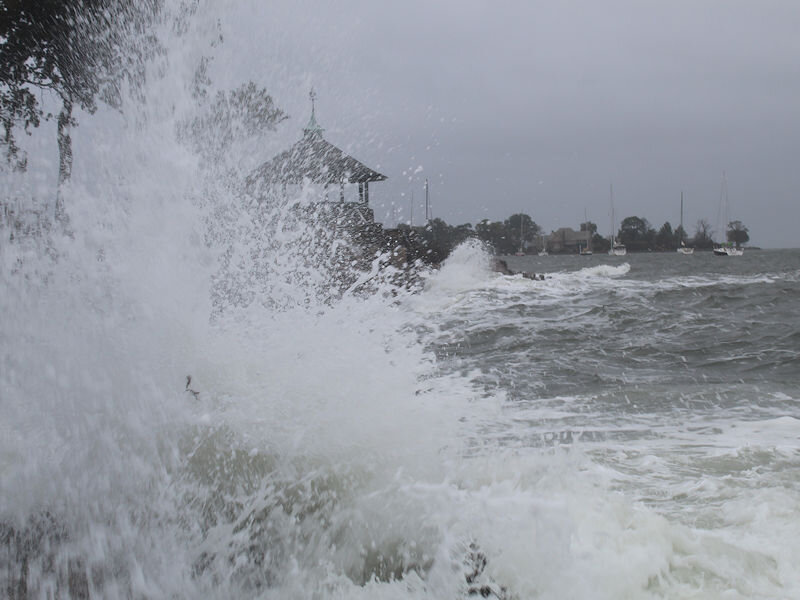
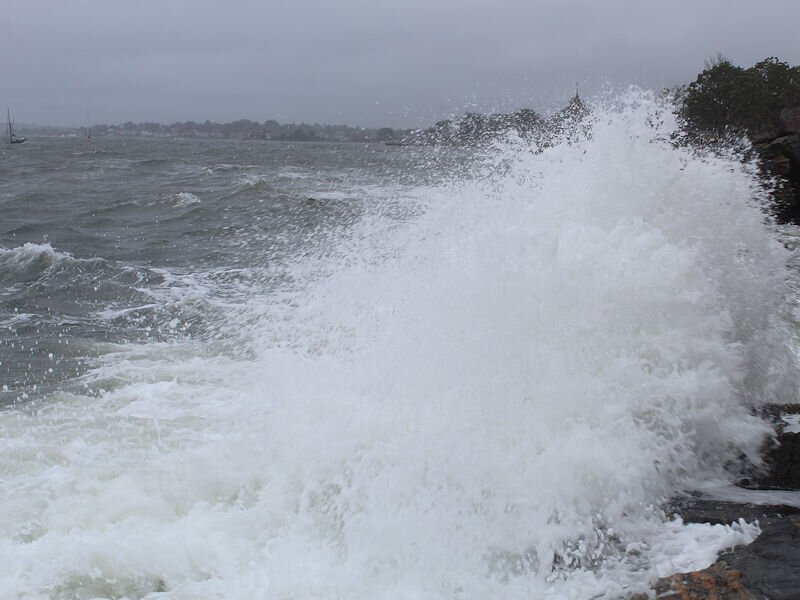
Waves on the Long Island Sound.

-
Morning thoughts… It will be mostly cloudy and cool. Some showers are possible from time to time, but much of the day should be dry. Rainfall amounts will be light, mainly 0.25” or less. Only the Jersey Shore and eastern half of Long Island will likely see more appreciable amounts of rain. High temperatures will likely reach the middle and upper 60s in most of the region. Likely high temperatures around the region include: New York City (Central Park): 64° Newark: 68° Philadelphia: 69° Normals: New York City: 30-Year: 66.6°; 15-Year: 67.7° Newark: 30-Year: 68.2°; 15-Year: 69.6° Philadelphia: 30-Year: 69.4°; 15-Year: 70.5° A generally warmer than normal regime will continue into at least mid-month.
-
I’ve seen that that large outside of the Bronx at the Marshlands Conservancy, but this is the biggest one I saw at the NY Botanical Garden.
-
SSTAs seem to suggest a predominant positive NAO. The seasonal models had decreased the amount of potential blocking. While there remains uncertainty about snowfall, I don’t think a really big snowfall season is on the table. Something near normal or somewhat above normal may be possible at the high-end. But things could still change as the pattern continues to evolve and the La Niña develops.
-
Much of the region experienced a cool breeze that capped temperatures in the 60s. However, Newark reached 70° for the 164th time this year. As a result, 2021 is ranked in 13th place. Tomorrow will be another mostly cloudy and cool day. Temperatures will likely top out in the middle and upper 60s. Some showers and periods of rain are possible. Aside from the Jersey Shore and Long Island, most of the region should see 0.25" or less total rainfall. Warmer air will start to return on Monday. Overall, the generally warm regime will continue into at least mid-month. Fall 2021 will likely be wetter to much wetter than normal in the northern Middle Atlantic region. Since 1869, there have been 9 August cases where New York City picked up 20.00" or more rainfall during the summer. Two thirds of those cases (and 4/5 of those with summer mean temperatures of 73.0° or above) had 17.00" or more fall precipitation in New York City. 2011 is probably the closest match in terms of precipitation and a nearly identical summer mean temperature. Mean fall precipitation for those 9 cases was 14.86". The median was 17.35". The 1991-2020 normal value is 12.27". Following very wet July-September periods, winter (December-February) precipitation has typically been near or below normal. The most recent exception was winter 2018-19. The ENSO Region 1+2 anomaly was 0.0°C and the Region 3.4 anomaly was 0.0°C for the week centered around September 29. For the past six weeks, the ENSO Region 1+2 anomaly has averaged +0.07°C and the ENSO Region 3.4 anomaly has averaged -0.28°C. Neutral ENSO conditions will likely yield to La Niña conditions later this month. The SOI was +2.51 today. The preliminary Arctic Oscillation (AO) figure was -0.213 today. On October 7 the MJO was in Phase 5 at an amplitude of 2.239 (RMM). The October 6-adjusted amplitude was 2.145 (RMM). Based on sensitivity analysis applied to the latest guidance, there is an implied 84% probability that New York City will have a warmer than normal October (1991-2020 normal). October will likely finish with a mean temperature near 62.0° (4.1° above normal).
-
Amidst cloudy skies and a stiff breeze that held temperatures in the middle 60s, the New York Botanical Garden is continuing its autumn transition.


-
Same in Mamaroneck.
-
Morning thoughts… It will be mostly cloudy and cooler. High temperatures will likely reach the middle and upper 60s in most of the region. Likely high temperatures around the region include: New York City (Central Park): 66° Newark: 69° Philadelphia: 70° Normals: New York City: 30-Year: 67.0°; 15-Year: 68.1° Newark: 30-Year: 68.6°; 15-Year: 70.0° Philadelphia: 30-Year: 69.8°; 15-Year: 70.9° Tomorrow will be another cool day with some showers, particularly during the late morning and afternoon. Rainfall totals should be light. Philadelphia, Newark, and New York City will likely see 0.25” or less. Heavier amounts will likely be confined to eastern New Jersey and across Suffolk County on Long Island. A generally warmer than normal regime will continue into at least mid-month.
-
Today was another unseasonably warm day. Temperatures rose into the middle and upper 70s across the region today. Newark reached 70° for the 163rd time this year. As a result, 2021 is tied for 13th place with 2001 and 2011. Tomorrow will be slightly cooler. Temperatures will generally top out in the middle and upper 60s. Some rain is possible, especially during Sunday afternoon. Overall, the generally warm regime will continue into at least mid-month. In the Northern Plains and Upper Midwest, the first week of October was exceptionally warm. Some temperatures and rankings for the first week of October: Billings: 63.9° (5th warmest) Bismarck: 64.5° (2nd warmest) Duluth: 60.5° (old record: 59.3°, 1963) Fargo: 63.9° (tied, 3rd warmest) Glasgow, MT: 64.4° (2nd warmest) Green Bay: 64.4° (3rd warmest) International Falls: 60.1° (3rd warmest) Madison: 67.2° (4th warmest) Milwaukee: 68.4° (3rd warmest) Minneapolis-St. Paul: 66.0° (5th warmest) Fall 2021 will likely be wetter to much wetter than normal in the northern Middle Atlantic region. Since 1869, there have been 9 August cases where New York City picked up 20.00" or more rainfall during the summer. Two thirds of those cases (and 4/5 of those with summer mean temperatures of 73.0° or above) had 17.00" or more fall precipitation in New York City. 2011 is probably the closest match in terms of precipitation and a nearly identical summer mean temperature. Mean fall precipitation for those 9 cases was 14.86". The median was 17.35". The 1991-2020 normal value is 12.27". Following very wet July-September periods, winter (December-February) precipitation has typically been near or below normal. The most recent exception was winter 2018-19. The ENSO Region 1+2 anomaly was 0.0°C and the Region 3.4 anomaly was 0.0°C for the week centered around September 29. For the past six weeks, the ENSO Region 1+2 anomaly has averaged +0.07°C and the ENSO Region 3.4 anomaly has averaged -0.28°C. Neutral ENSO conditions will likely yield to La Niña conditions later this month. The SOI was +13.08 today. The preliminary Arctic Oscillation (AO) figure was -0.524 today. On October 6 the MJO was in Phase 5 at an amplitude of 2.147 (RMM). The October 5-adjusted amplitude was 1.963 (RMM). Based on sensitivity analysis applied to the latest guidance, there is an implied 83% probability that New York City will have a warmer than normal October (1991-2020 normal). October will likely finish with a mean temperature near 62.0° (4.1° above normal).
-
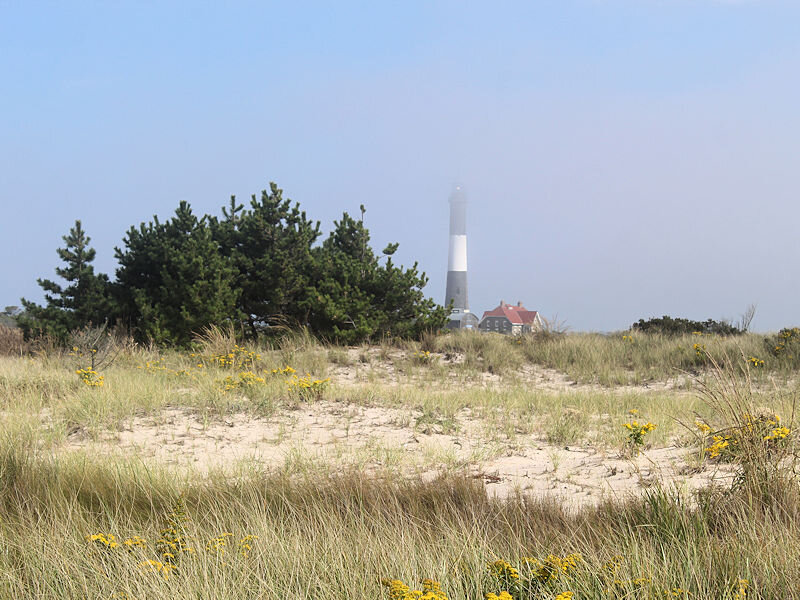
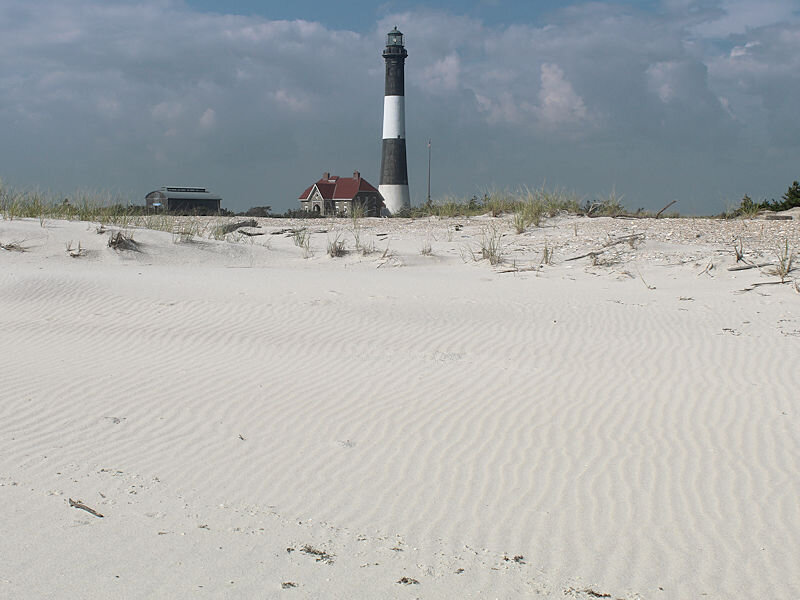
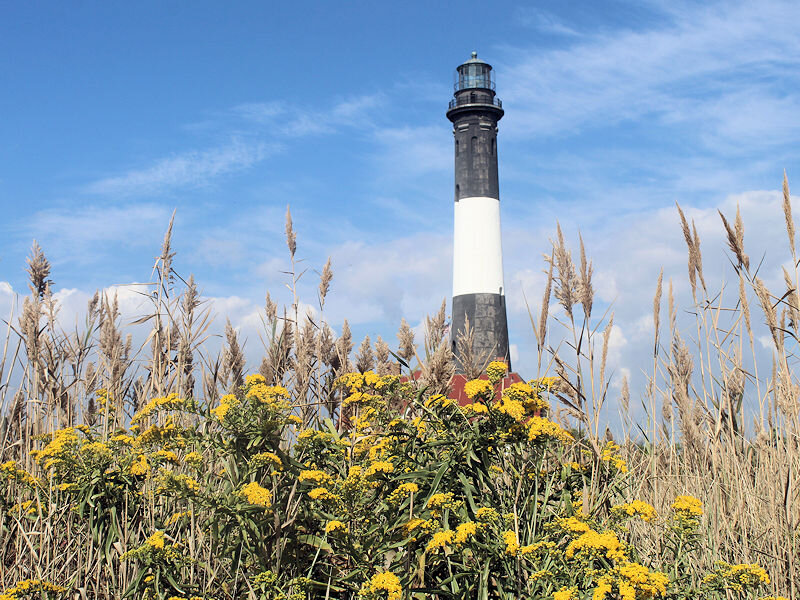
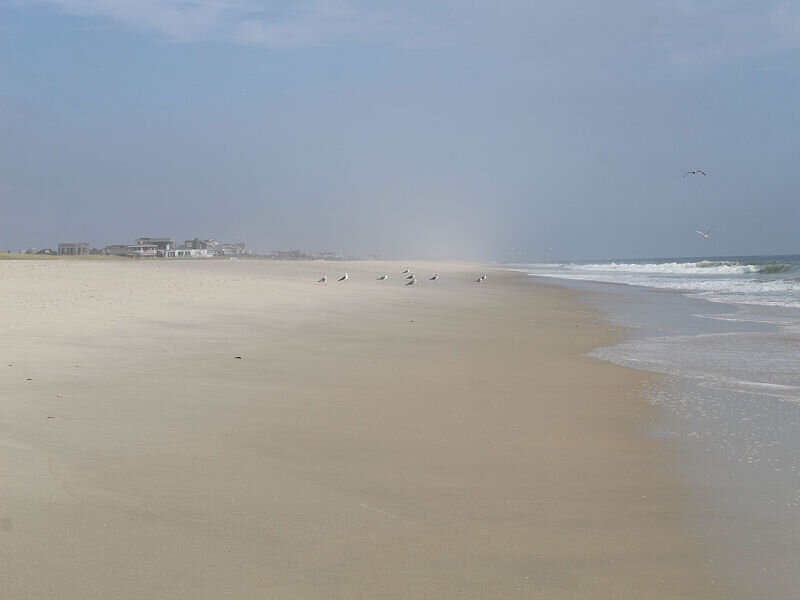
Today proved to be another great late-season beach day with strong sunshine and temperatures in the 70s.
-
The National Blend of Models has about a quarter inch of rain, mainly from afternoon showers. There remains higher than usual uncertainty as to the potential development and placement of an inverted trough.
-
Morning sunrise:


-
Morning thoughts… After some early fog in a few locations, today will be partly sunny and warm. High temperatures will likely reach the middle and even upper 70s in most of the region. Likely high temperatures around the region include: New York City (Central Park): 73° Newark: 77° Philadelphia: 77° Normals: New York City: 30-Year: 67.4°; 15-Year: 68.6° Newark: 30-Year: 69.0°; 15-Year: 70.4° Philadelphia: 30-Year: 70.2°; 15-Year: 71.3° A generally warmer than normal regime will continue into at least mid-month.
-
Right now, it looks as if showers and light rain will arrive Sunday morning near 8 am and on and off light rain will persist into the evening. Total rainfall will be somewhere around 0.50”. I wish things looked better. We’ll see what the overnight guidance shows.
-
Under partly sunny skies, temperatures rose into the lower and middle 70s today. Newark reached 70° for the 162nd time this year. As a result, 2021 is tied for 15th place with 1959 and 1989. Tomorrow will be variably cloudy and very warm. The temperature will likely reach the middle and possibly upper 70s. Slightly cooler air will return for the weekend. Some rain is possible on Sunday. Overall, the generally warm regime will continue into at least mid-month. Bismarck concluded its 2nd warmest opening week of October on record with a mean temperature of 64.5°. The record of 65.1° was set in 2011. In addition, the October 1-7 average high temperature was 82.3°. That set a new 7-day October record. The old record of 81.9° was set during October 7-13, 1934. Records go back to 1874. Fall 2021 will likely be wetter to much wetter than normal in the northern Middle Atlantic region. Since 1869, there have been 9 August cases where New York City picked up 20.00" or more rainfall during the summer. Two thirds of those cases (and 4/5 of those with summer mean temperatures of 73.0° or above) had 17.00" or more fall precipitation in New York City. 2011 is probably the closest match in terms of precipitation and a nearly identical summer mean temperature. Mean fall precipitation for those 9 cases was 14.86". The median was 17.35". The 1991-2020 normal value is 12.27". Following very wet July-September periods, winter (December-February) precipitation has typically been near or below normal. The most recent exception was winter 2018-19. The ENSO Region 1+2 anomaly was 0.0°C and the Region 3.4 anomaly was 0.0°C for the week centered around September 29. For the past six weeks, the ENSO Region 1+2 anomaly has averaged +0.07°C and the ENSO Region 3.4 anomaly has averaged -0.28°C. Neutral ENSO conditions will likely yield to La Niña conditions later this month. The SOI was +14.12 today. The preliminary Arctic Oscillation (AO) figure was -0.340 today. On October 5 the MJO was in Phase 5 at an amplitude of 1.968 (RMM). The October 4-adjusted amplitude was 1.841 (RMM). Based on sensitivity analysis applied to the latest guidance, there is an implied 82% probability that New York City will have a warmer than normal October (1991-2020 normal). October will likely finish with a mean temperature near 62.0° (4.1° above normal).
-
Have a great birthday, too.
-
You’ve got many more winters to go, some of which will be snowy.
-
In advance, have a great birthday.

