donsutherland1
-
Posts
23,743 -
Joined
Content Type
Profiles
Blogs
Forums
American Weather
Media Demo
Store
Gallery
Everything posted by donsutherland1
-
The RGEM looks promising, too.
-
In general, a dominant first coastal low tends to pull the baroclinic zone offshore and the trailing wave further east. The NAM makes the second low the dominant low and that's the solution that would have the best chance of bringing appreciable snows to the coastal plain, not just eastern Long Island or southeastern New England. However, the NAM is just a single model and this is a single run of that model.
-
Yes. At least that's the point-and-click for now. I was just commenting on the NBM's idea.
-
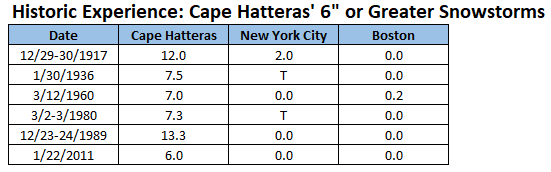
The NBM is showing a situation that would be historically unique. 1/28 13z NBM: Assuming Cape Hatteras receives 6" or more snowfall, the odds of amounts approaching 6" in New York City would likely be very low. To date, none of the 6" or greater snowstorms in Cape Hatteras saw more than 2" in New York City. While changes remain possible at the current lead time, there is no overwhelming evidence to support the historically unique solution shown on the NBM at present.
-
Little has changed since 6z. The deep 500 mb low that is forecast to develop will track through Alabama, Georgia and then out to sea. That's too far to the south to allow for an appreciable snowfall in the New York City area. A lighter snowfall remains plausible. The 12z Guidance: Some of the synoptic details are still subject to change. The guidance should be growing more skillful in resolving the synoptic details through the day today and especially tomorrow.
-
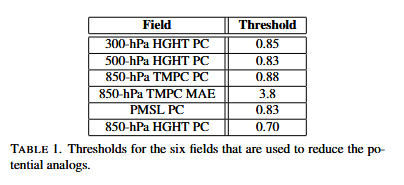
Here's the methodology from the paper that was printed when the CIPS initiative was being developed:
-
As noted earlier, the 1/28 0z EPS had about 20% of ensemble members showing 6" or more snow in New York City with about 10% having 10" or more. That's within the range of potential solutions, even as it might be a lower probability outcome right now. Going back in time, here are excerpts from two AFDs from another storm that enjoyed some ensemble support while the models were too far to the east. AREA FORECAST DISCUSSION NATIONAL WEATHER SERVICE MOUNT HOLLY NJ 616 PM EST THU DEC 23 2010 IT WOULD APPEAR AS THOUGH THE THREAT FOR SUNDAY NIGHT INTO MONDAY CONTINUES TO DWINDLE...AS THE LAST HOLDOUT FOR A SIGNIFICANT WINTER STORM HAS JOINED THE MODEL CONSENSUS THIS AFTERNOON. THE 1200 UTC ECMWF RUN HAS JOINED THE MODEL CONSENSUS THIS AFTERNOON IN ALLOWING THE MID LEVEL PHASING TO OCCUR TOO LATE FOR MUCH OF AN IMPACT WITH REGARD TO SNOW FOR THE FORECAST AREA. AT THIS POINT...A CHANCE OF SNOW WILL BE RETAINED FOR SUNDAY NIGHT AND MONDAY MORNING FOR AT LEAST A PART OF THE AREA. THIS COULD BE DUE TO A BRUSH WITH THE OFFSHORE SYSTEM (AS IT BEING SHOWN BY THE ECMWF/GFS) OR THE PASSAGE OF THE CLOSED MID LEVEL SYSTEM (A BIT MORE LIKELY). IN ANY EVENT...IT NOW APPEARS AS THOUGH THE THREAT FOR A SIGNIFICANT WINTER WEATHER EVENT IS WANING. THERE WILL PROBABLY BE SOME WIGGLE ROOM ON THE TRACK (SINCE THE SHORT WAVE PUSHING THIS SYSTEM IS OVER THE FOUR CORNERS THIS AFTERNOON.)...AND EASTERN AREAS OF NEW JERSEY COAST SEE SOME SNOW ACCUMULATION. WHILE IT IS TOO EARLY TO PULL THE PLUG ON THIS SYSTEM FOR US...IT IS LOOKING MORE LIKE A GLANCING BLOW THAN A DIRECT HIT. AREA FORECAST DISCUSSION NATIONAL WEATHER SERVICE NEW YORK NY 656 PM EST THU DEC 23 2010 ...MAIN FEATURE TO KEEP AN EYE ON IS EVOLUTION OF COASTAL STORM AND HOW IT IMPACTS LOCAL CWA SUNDAY INTO MONDAY. MUCH DEPENDS ON PHASING OF SOUTHERN STREAM SHORTWAVE AND NORTHERN STREAM TROUGH DIGGING ACROSS THE GREAT LAKES REGION AS IT HEADS TOWARD THE NORTHEAST. THESE UPPER FEATURES NOW ENTERING DENSE OBSERVATION NETWORK...SO EACH SUBSEQUENT MODEL RUN SHOULD RESULT IN BETTER CLUSTERING OF SOLUTIONS. HOWEVER...A SLIGHT SHIFT TO THE EAST HAS BEEN OBSERVED WITH THIS 12Z RUN...ALONG WITH FASTER MOVEMENT OF SFC LOW SUNDAY INTO MONDAY PER EC/GFS/NAM. INITIALLY THE NAM/WRF REMAINS MUCH SLOWER WITH SOUTHERN STREAM SHORTWAVE AS IT MOVES ACROSS THE GULF THIS WEEKEND. LOW PRESSURE DEVELOPS AND DEEPENS OFF THE SOUTHEAST COAST SUNDAY MORNING AS THE MAIN TROUGH DIGS. LATEST NAM/WRF AND GFS TRACK THIS LOW JUST SOUTHEAST OF THE BENCHMARK...WITH MINIMAL QPF ACROSS THE CWA. LATEST ECMWF HAS SHIFTED EAST...PASSING JUST EAST OF THE BENCHMARK AS WELL. AS MENTIONED...SFC LOW MUCH FASTER TRACKING TO THE NORTHEAST. ECMWF CLIPS CWA...WITH BETTER CHANCE FOR PRECIP TO THE EAST. OVERALL...PLENTY OF ENSEMBLE MEMBERS STILL FORECASTING A FULL FLEDGED SNOWSTORM. WILL CONTINUE TO LAYER POPS FROM HIGHEST SE...TO LOWEST NW ZONES SUNDAY AFTERNOON AND SUNDAY NIGHT. AS FOR TIMING...SUNDAY AND SUNDAY NIGHT WOULD BE WHEN ANY ACCUMULATING SNOWFALL WOULD OCCUR...IF IT DOES. STORM MOVES WELL TO THE NORTH AND EAST ON MONDAY. LINGERING MID AND UPPER LEVEL TROUGH ALONG WITH AMPLE MOISTURE WRAPPING AROUND THE LOW COULD RESULT IN SCATTERED SNOW SHOWERS OR FLURRIES MONDAY.
-
...on an Underwood Portable Typewriter.
-
Here' the forecast assessment for the Boxing Day Blizzard: https://www.wpc.ncep.noaa.gov/winter_storm_summaries/event_reviews/2010/December25_27_2010_Blizzard.pdf
-
Yes, during the second half of February, PNA- is better for significant or major snowfalls due to the shortening of wave lengths.
-
The 1/28 0z ECMWF develops and tracks an impressive 500 mb low in Tennessee through Alabama and Georgia and then off the southeast coast. That track would favor an out-to-sea solution, as shows up on the surface maps. Model skill in resolving synoptic details should be improving today and tomorrow. So, if these solutions begin to lock in with the improved-skill output later today and especially tomorrow, the risk of snow in such cities as Philadelphia and New York City would diminish on Sunday. It's worth noting that about 20% of individual EPS members showed 6" or more snow in New York City and just over 10% had 10" or above amounts. In short, a significant snowfall, while decreasing in probability, is still a low probability not zero probability outcome. On a separate note, temperatures have been somewhat higher than modeled yesterday and again this morning. Friday and Saturday still look to be the coldest days with highs struggling toward 20°, lows in the single digits in New York City and some subzero lows in the colder suburbs. The opening week of February will likely start off dry but still colder than normal.
-
Yes, I believe that’s the case.
-
The record is 56 consecutive days (December 24, 1947 through February 17, 1948). The 2010-11 streak was the third longest.
-
Snow Contest January 25th-26th
donsutherland1 replied to WeatherGeek2025's topic in New York City Metro
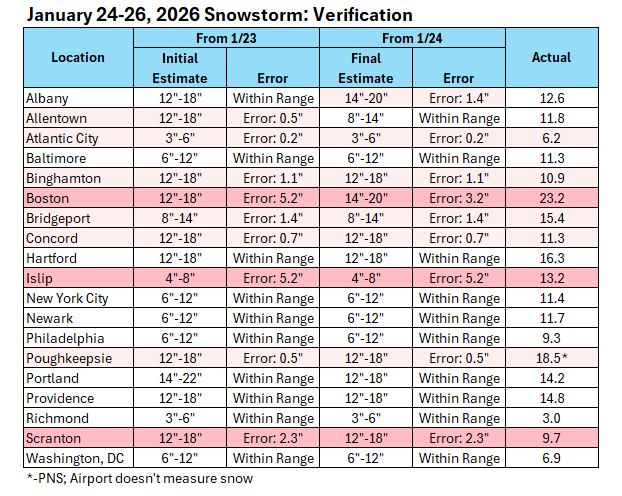
BWI finished at 11.3". -
As noted earlier, IMO writing the event off completely goes beyond what can reasonably be supported by the models and their ensembles. Indeed, there has been some improvement during the 18z cycle.
-
A number of those were high-impact storms i.e., 12/20/2009, 12/27/2010, 2/9/2013, 1/24/2016, 1/29/2022, etc.
-
That was the area I was most uncertain about. I overdid the impact of the warm air aloft. Hopefully, I'll do better next time.
-
Unfortunately, I don't have the 6z figures.
-
Looking back, my errors for the 1/24-26 snowstorm:
-
At 12z, 8 GEFS members and 1 EPS member had 6" or more snow for NYC. The EPS member in question had 16".
-
Yes, I'm aware that it's time lagged. Nevertheless, its 18z data was probably reflecting the 12z suite or perhaps slightly later. At this timeframe, the details don't matter too much. I just wanted to illustrate that there are alternatives to a clean miss. I suspect that a solution that grazes the coast might currently be the most likely scenario. That would allow for a light snowfall from Philadelphia to NYC and moderate maybe larger amounts across parts of eastern Long Island into southeastern New England. The Cape could do quite well. Having said that, it's not uncommon for model tracks to vary by 50 to sometimes 150 miles over a four-day lead time. I suspect that by late tomorrow or Thursday, we should start to be able to pin down the details with some degree of confidence.
-
Arctic air now covers the region. Highs will be mainly in the lower 20s through Friday. One or more days could see highs in the teens. The last winter with more than one high in the teens was Winter 2018-19 when there were two such days. Moreover, New York City has the potential to see the temperature dip into the single digits for lows on one or more days during this period. Some snow flurries or snow showers are possible Thursday night into Friday morning. Additional snow is possible on Sunday. However, there remains significant uncertainty about the location of the storm's development and its track. A large storm would be historic. For reference, New York City has seen just one 10" or above snowstorm one week or less following a 10" or above snowstorm: February 3-4, 1926 (10.4") and February 9-10, 1926 (12.4"). The shortest interval between 10" or above daily snowfalls is 14 days: March 2, 1896 (10.0") and March 16, 1896 (12.0"). Records go back to 1869. Overall, January 20th-February 3rd will likely be the coldest and perhaps snowiest two-week period this winter. The forecast WPO-/EPO-/AO-/PNA+ pattern is typically the coldest pattern in January and among the coldest during the first half of February. A persistently positive PNA will have above climatological risk of moderate or significant snowfalls. For perspective, the coldest two-week period this winter prior to January 20th was January 3-16, 2026 and January 4-17, 2026 with a mean temperature of 30.3°. The snowiest two-week period was December 14-27, 2025 when 7.2" of snow fell. Already, snowfall since January 20th has surpassed that figure. The ENSO Region 1+2 anomaly was -0.3°C and the Region 3.4 anomaly was -0.7°C for the week centered around January 14. For the past six weeks, the ENSO Region 1+2 anomaly has averaged -0.48°C and the ENSO Region 3.4 anomaly has averaged -0.68°C. La Niña conditions will likely continue into at least late winter. The SOI was -2.82 today. The preliminary Arctic Oscillation (AO) was -4.601 today. That is the lowest AO value since February 16, 2025 when the AO was -4.772. Based on sensitivity analysis applied to the latest guidance, there is an implied near 100% probability that New York City will have a cooler than normal January (1991-2020 normal). January will likely finish with a mean temperature near 30.2° (3.5° below normal). Supplemental Information: The projected mean would be 2.4° below the 1981-2010 normal monthly value.
-
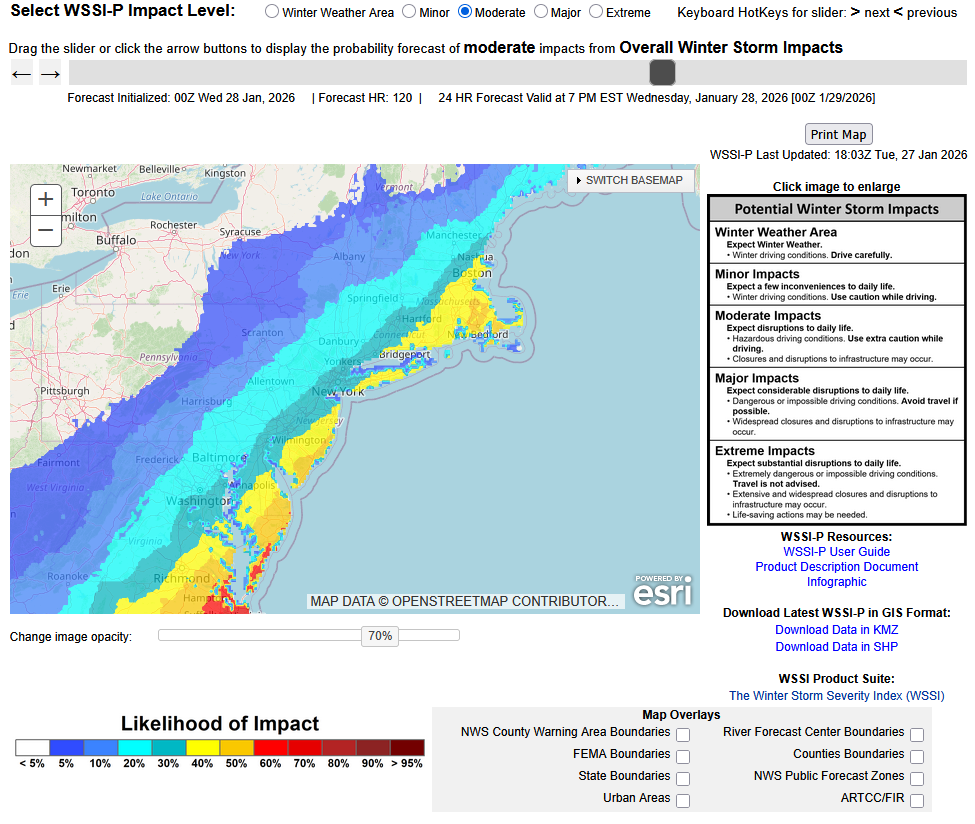
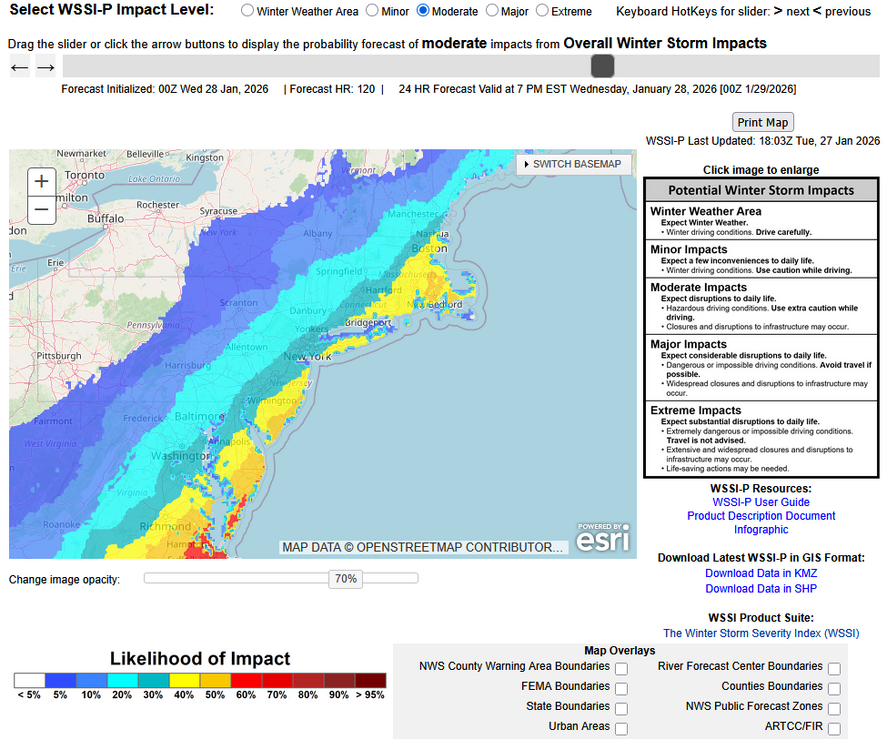
There remains potential for snowfall on Sunday in the New York City area with an even higher probability of snowfall across eastern Long Island. What's fairly certain is that a storm will develop somewhere along the Southeast coast and possibly become quite deep. What's uncertain and subject to synoptic details (the placement of vorticity maxima, 500 mb low, etc.) that the guidance can't reliably resolve at the current lead time is the exact location where the storm will develop and its ultimate track. By Thursday, the guidance should be moving into a more skillful lead time. As a result, there are varying solutions. Several models now take the storm out to sea with no impact on the New York City area. Others graze the region, possibly with several inches of snow. The 18z NBM even brings close to 0.50" QPF to New York City. This large spread reflects the degree of uncertainty that still exists. Although it looks less likely that this will be a blockbuster storm, writing the event off completely goes beyond what can reasonably be supported by the models and their ensembles. Here's the latest WPC probabilistic assessment of a moderate impact:
-
Let's see where the synoptic details are tomorrow. At 500 mb, there remain some important differences among the guidance.
-
Common theme on the 12z cycle: The GFS and GGEM have brought the precipitation farther north and west. It's too soon to write off the storm for the NYC area and especially Long Island. Details still can't be resolved reliably this far out.