EasternLI
-
Posts
3,631 -
Joined
-
Last visited
Content Type
Profiles
Blogs
Forums
American Weather
Media Demo
Store
Gallery
Everything posted by EasternLI
-
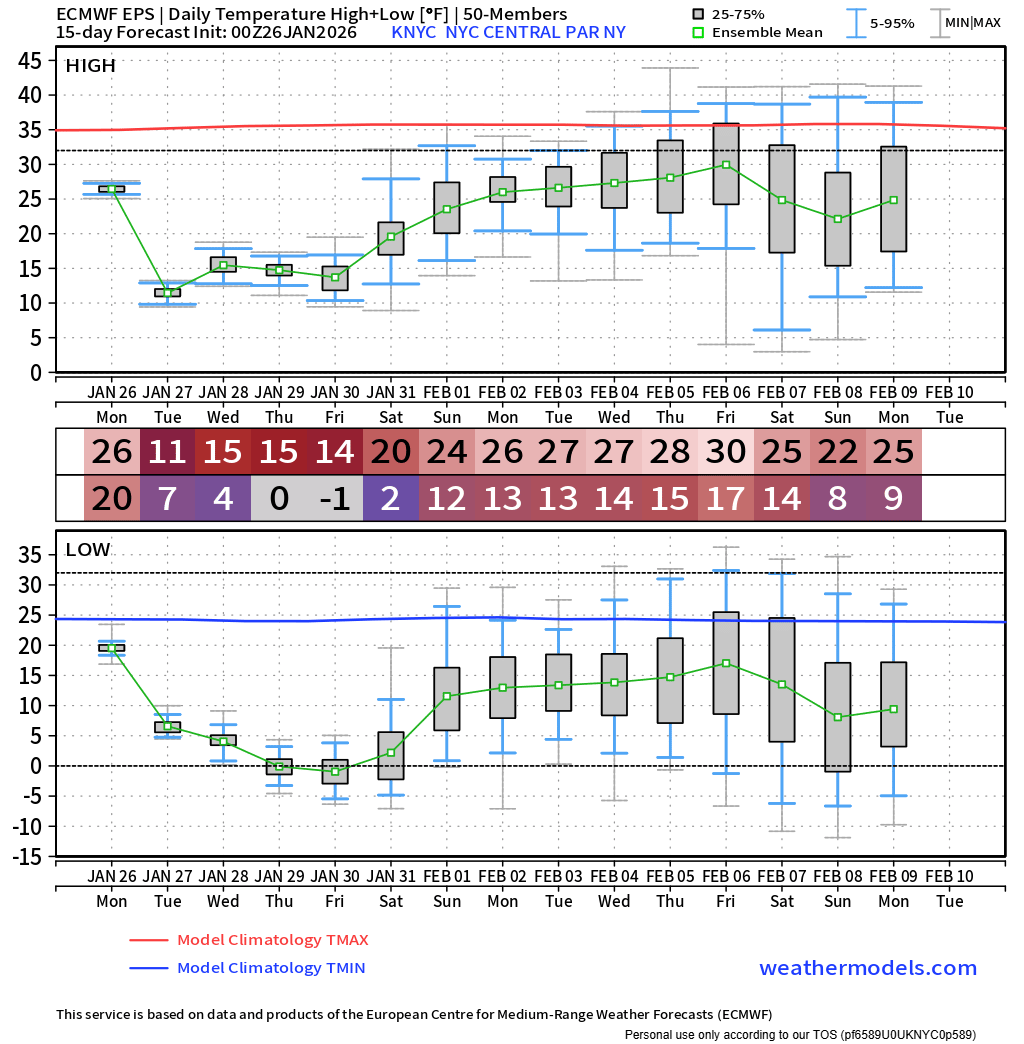
Groundhog is currently frozen. 6 more weeks of winter. Next legit threat. Big +PNA spike leading into it.
-
GEFS has been starting to come around to this idea recently too. Euro OP has looked like this for a couple of runs now also.
-
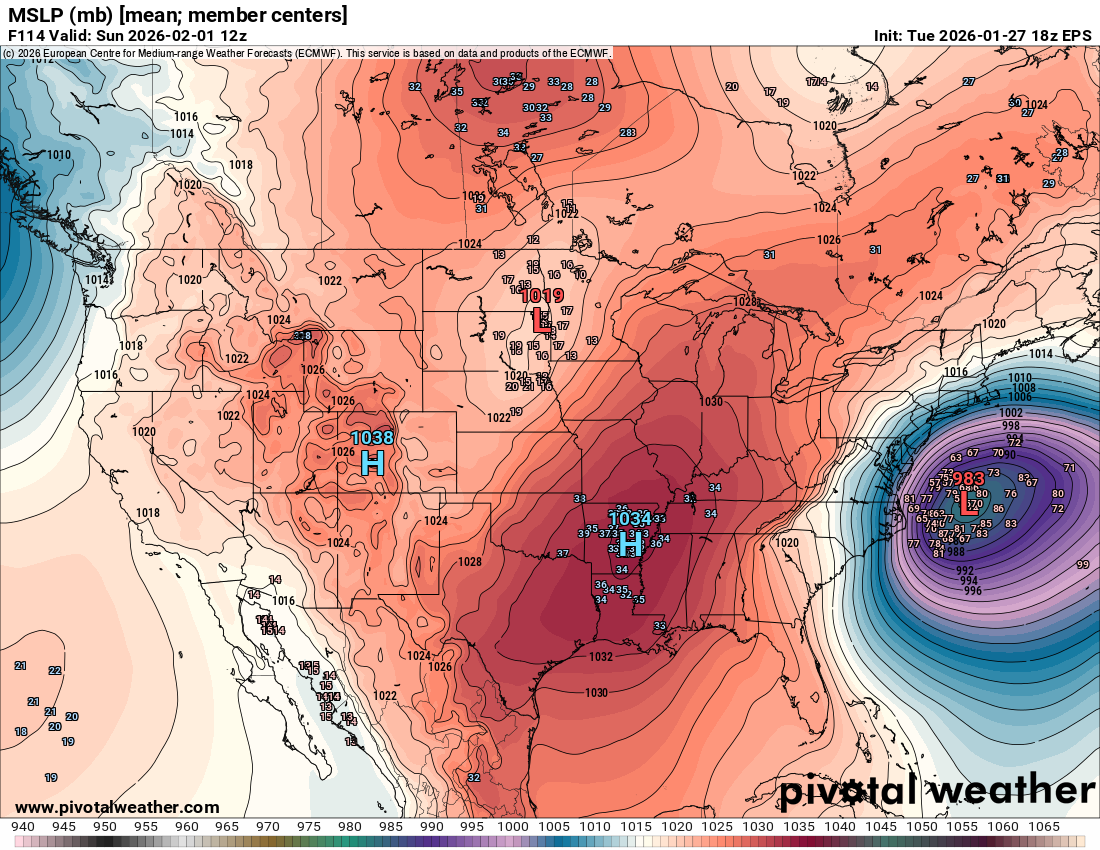
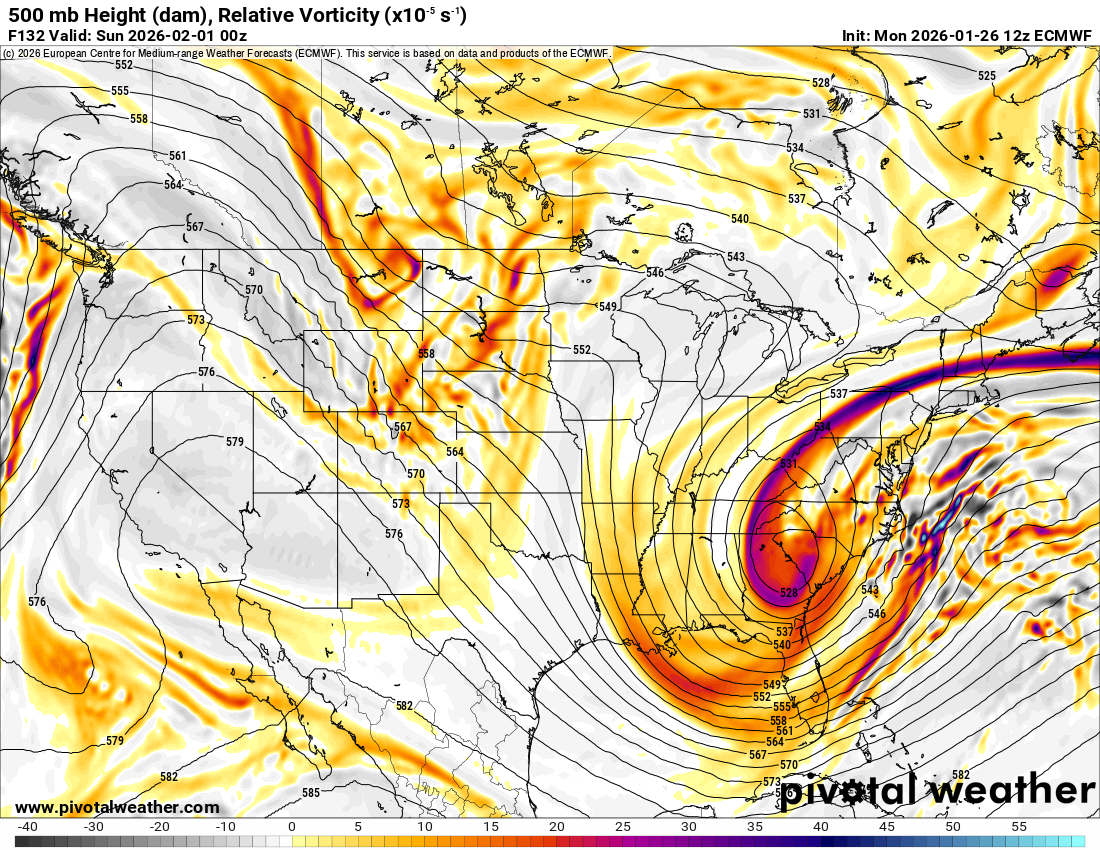
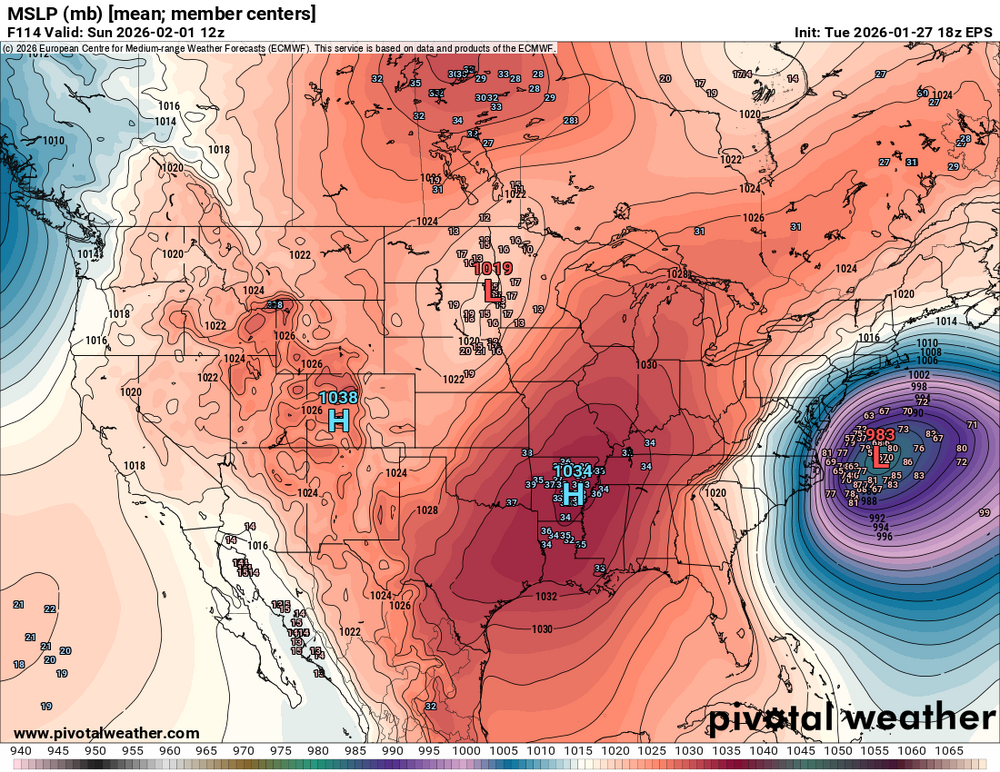
There's been this low pressure system that's bubbling up from deep in the Caribbean out ahead of this. Which is getting involved with the cyclogenesis. I think it's interfering and helping to shunt it east on guidance. So you're seeing the weird runs with a couple of lows. Wish that thing would vanish. Or get it to slingshot NW by the ULL a la 18z euro yesterday.

-
Man, IDK. The more I look things over, the more I get the feeling winter is far from done with us and could be very far. Guidance is indicating a big time -AO developing at 500mb moving forward. My guess is some MJO influence in doing that. Meanwhile, here comes some real potential of a major strat PV disruption with the AO already negative. We're accustomed to a lag time of several weeks for the strat to affect the AO if at all. However, under these particular circumstances there is a possibility of basically zero lag time to see effects. If you split the vortex with an already -AO you could instead see it quickly coupling all the way through the column. Effectively prolonging and amplifying the already -AO in place, starting almost immediately. Its a possibility to do something like that this year...
-
Today's looks a little more bullish than yesterdays.
-
It's quite interesting to me, this strat split potential. Guidance is indicating this would occur during a time where the AO is already negative. I recall reading at one time that if that happens, there may not be any lag time associated. Instead, they can couple quickly through the column and you just get it amplified and prolonged instead. Latest weeklies from today were more bullish.
-
We just had a really nice clean phase 8 look IMHO. Here's some bullet points supporting that thought from the CPC MJO update yesterday. Western hemisphere is phase 8. I think this potential will respond in kind given a little lag time. Which lands squarely on this period. There's research that supports phase 8 being the most favorable for Northeast US snow events. Beyond all of this, there is potential of a strat PV split. It's on some of the guidance. Probably at least partially due to the MJO transit through the Pacific. We just had a precursor pattern for that as well, which brought Sunday's event. So will just need to monitor developments. • Following a long-lasting, incoherent MJO, the RMM based index increased in amplitude, emerging from the unit circle in phase 6 (Western Pacific) and becoming highly amplified. • Once eastward propagation began, the signal quickly moved into the Western Hemisphere. • The signal had been showing propagation in the upper-level VP anomalies before it was seen in the RMM index and may be “catching up”.
-
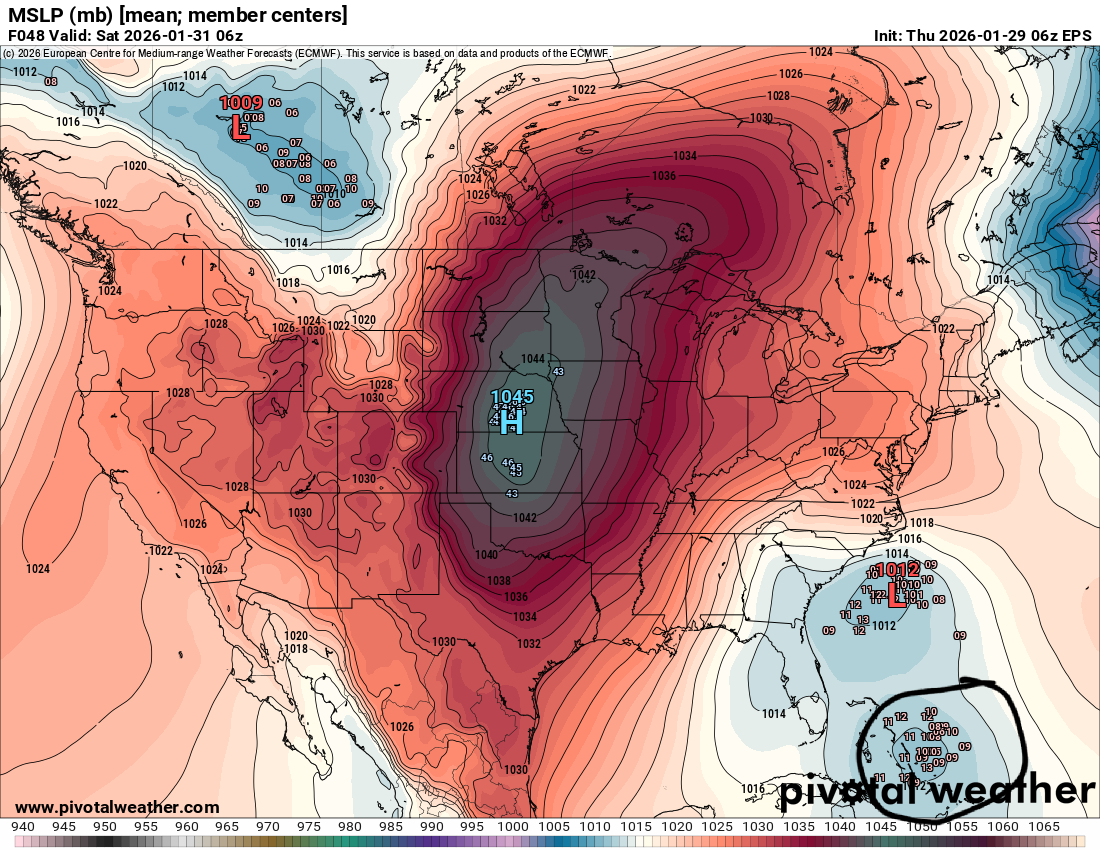
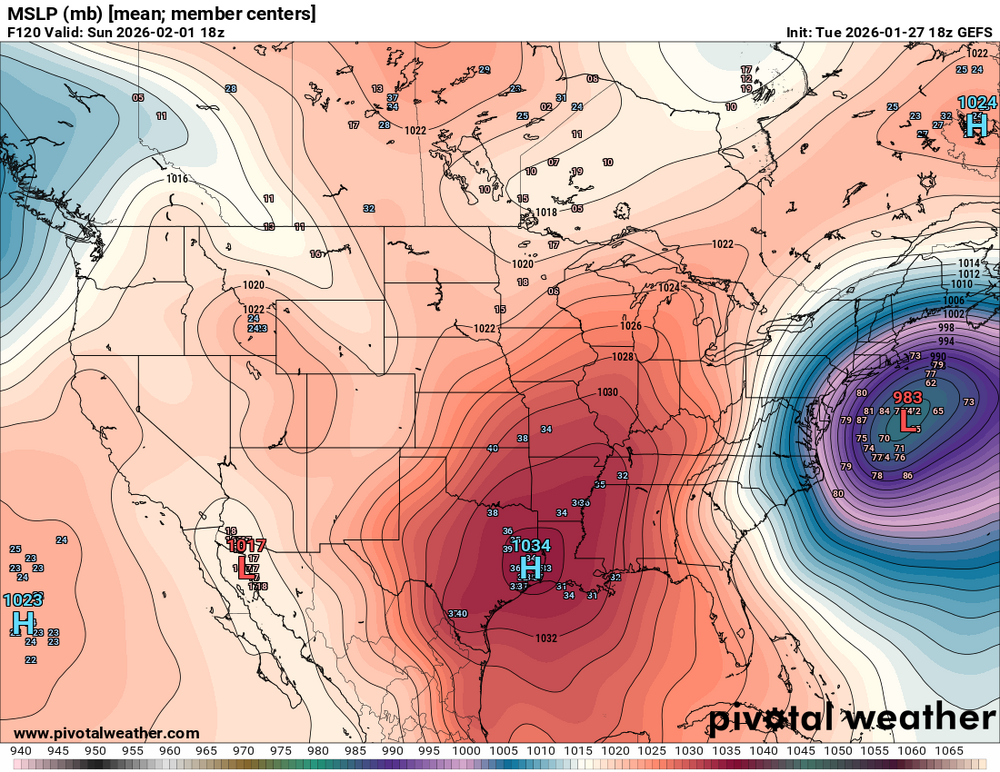
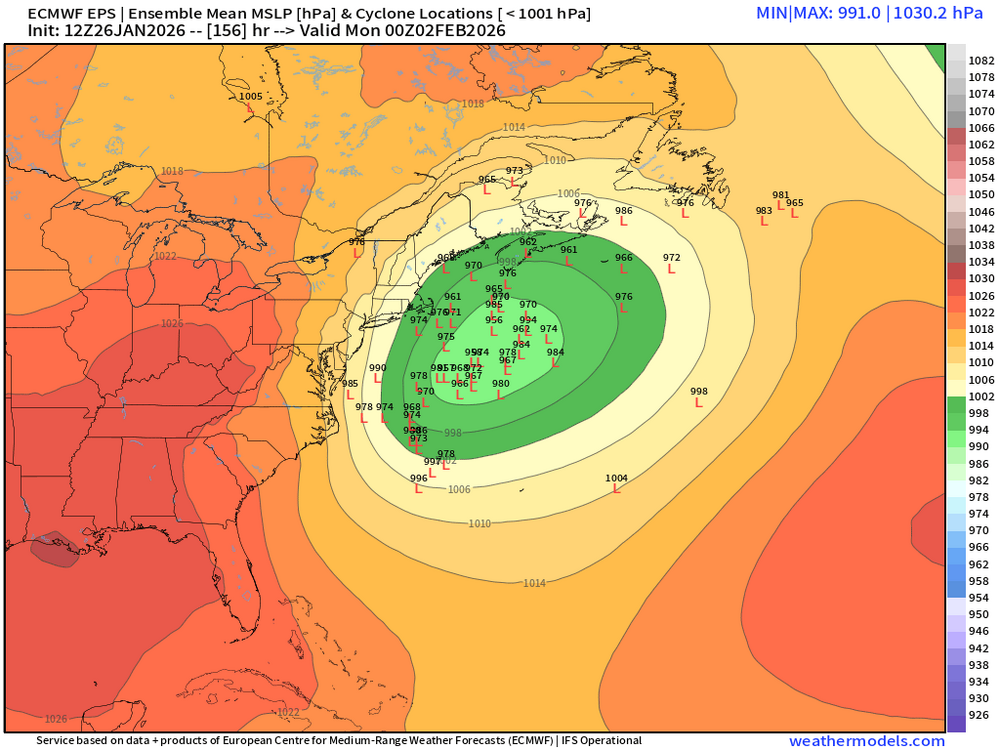
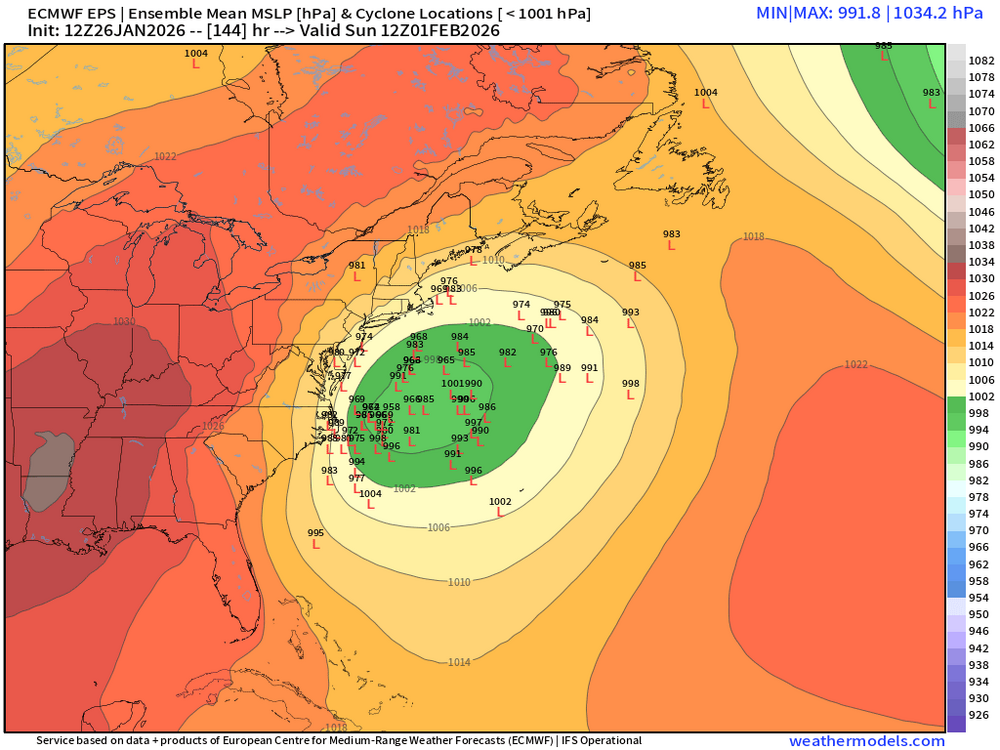
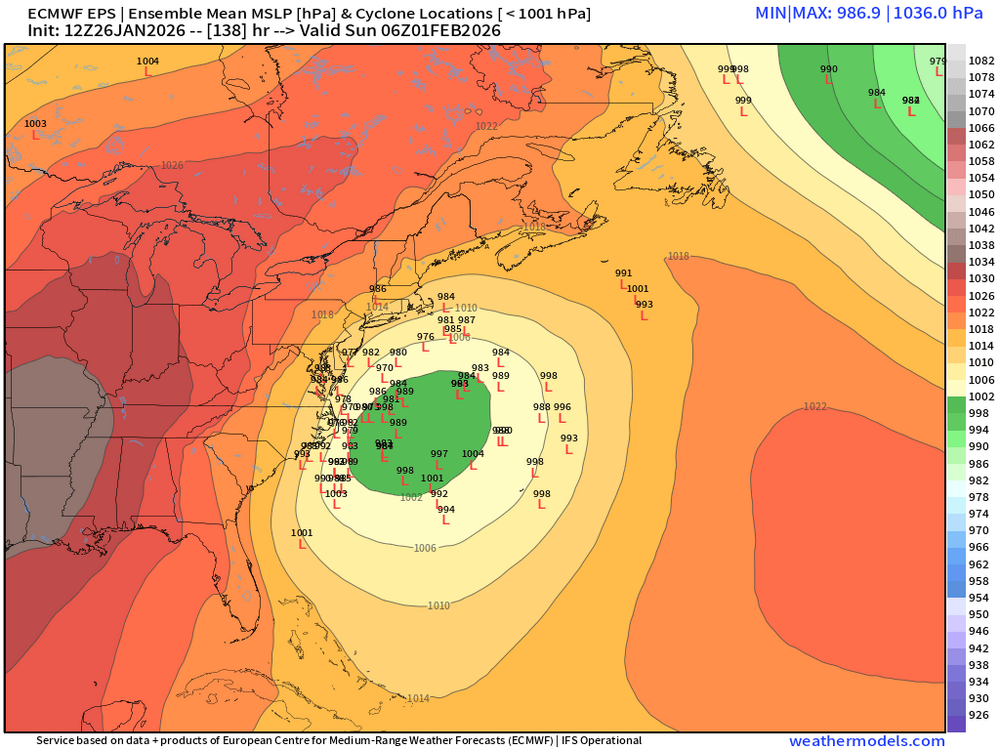
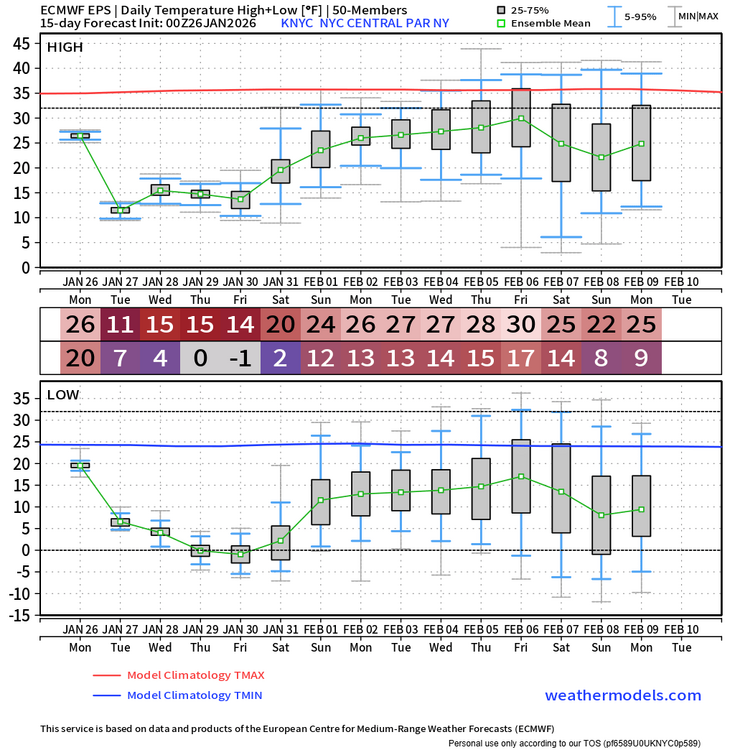
This is the best EPS run of today. Better than 00z 6z 12z.
-
Yeah, this works for now.
-
-
-
Zero complaints on the 6z GEFS. Inching closer.
-
-
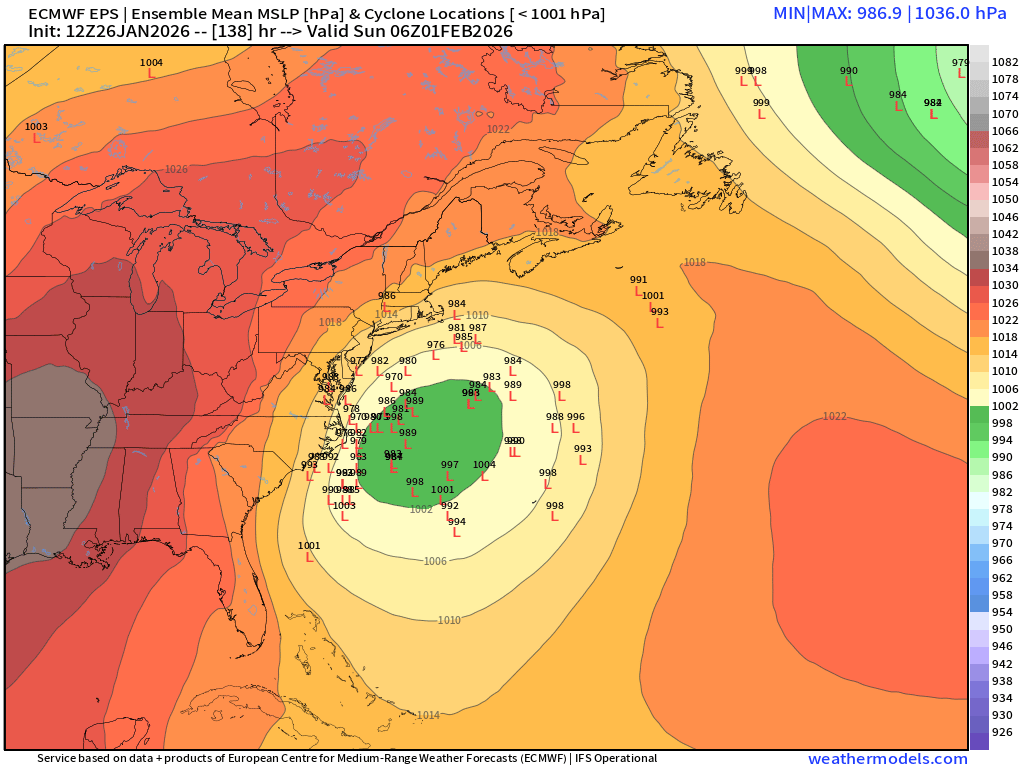
00z EPS spread is giving me the classic Hatteras to BM vibes.
-
-
-
-
I like the orientation. It's ever so slightly tilted in a way that would want to force neg tilt along the east coast naturally.
-
Just keep the looks like this showing up, for now..

-
Nice! Rjay threads are usually good luck too lol
-
24" here on the season at this point which is pretty damn good for here. With future prospects too, this is a fun winter we have going on.
-
Snow is falling again here too lol I still have to dig this out
-
I don't know. Maybe @donsutherland1 or @bluewave
-
Burial if this thing goes off. What's out there now isn't going anywhere. Might have to fire up the snowpack thread this year.
-
Including the sleet, I end up with 11" from this. Which is in line with nearby obs. Crazy event.