EasternLI
-
Posts
3,763 -
Joined
-
Last visited
Content Type
Profiles
Blogs
Forums
American Weather
Media Demo
Store
Gallery
Everything posted by EasternLI
-
Canadian amped up a bit vs 00z
-
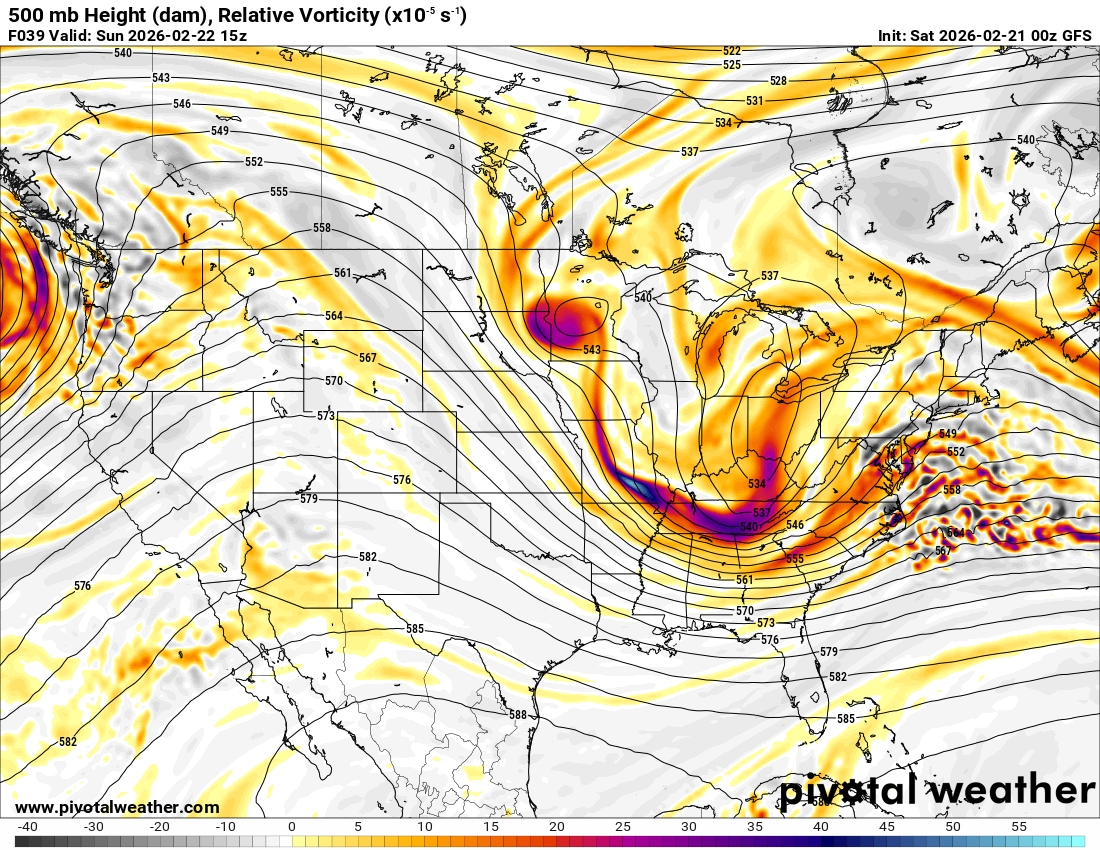
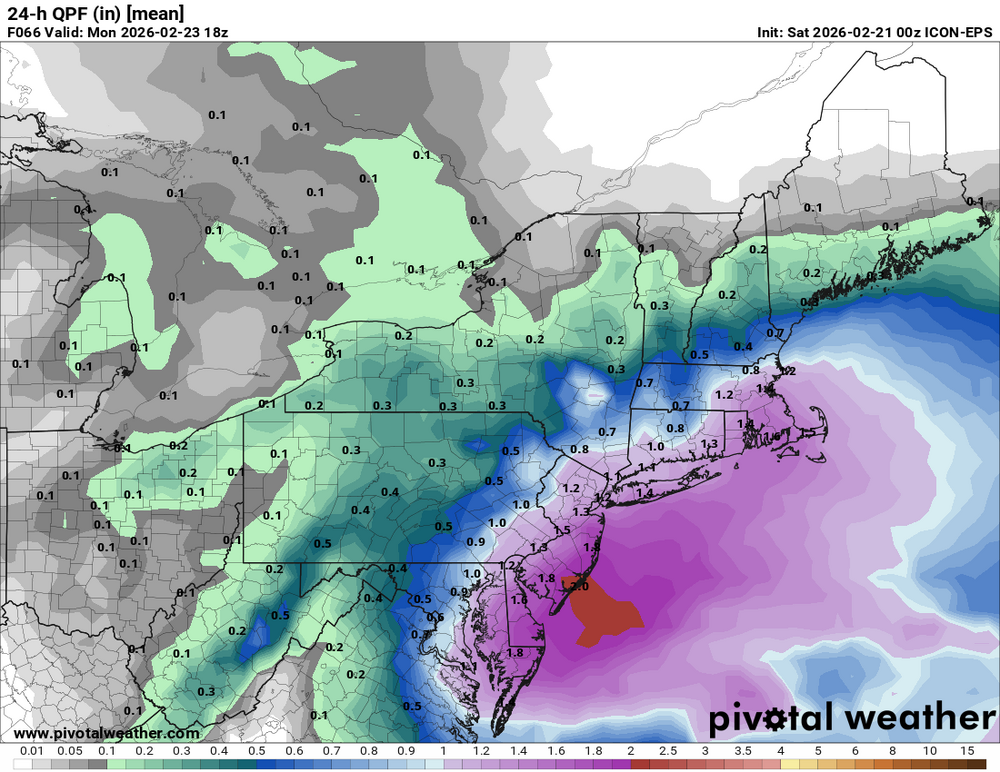
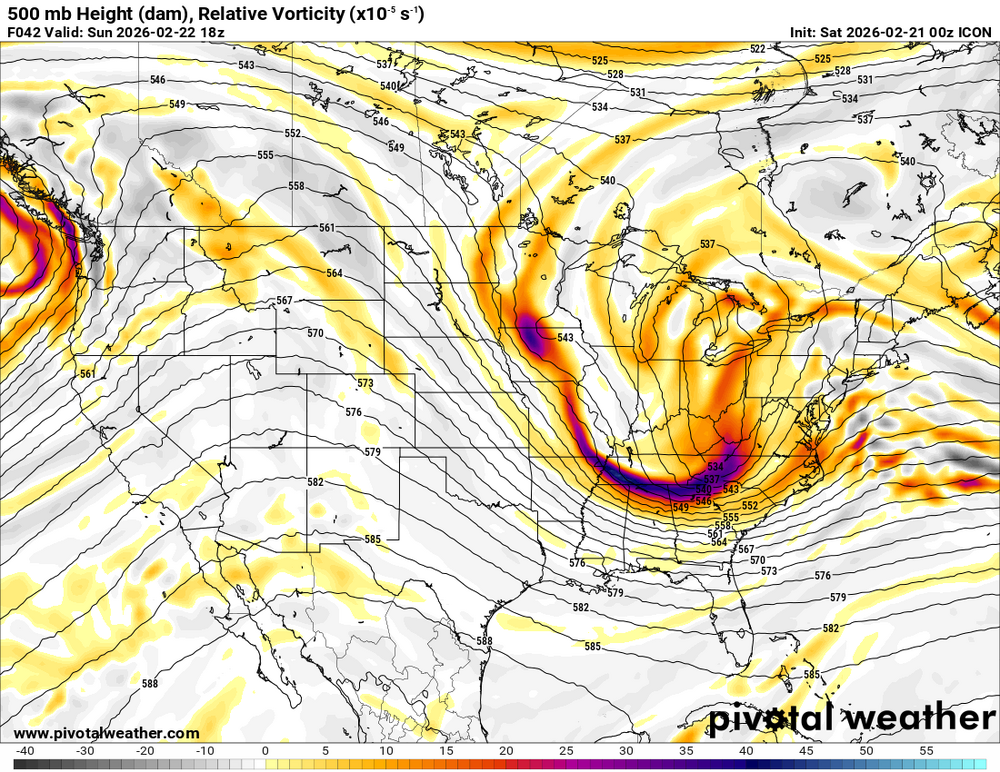
ICON is jacked up too
-
Frame it.
-
Incredible
-
wow
-
Nam is really amped
-
Crusher
-
Long range HRRR has a crusher on the 12z run
-
However unlikely this may be. If any of those insane western sref members were ever to actually take place. I'll see you all after we rebuild all infrastructure.
.thumb.png.ec76fc29cee7761faa2f5efbe02ab9b8.png)
-
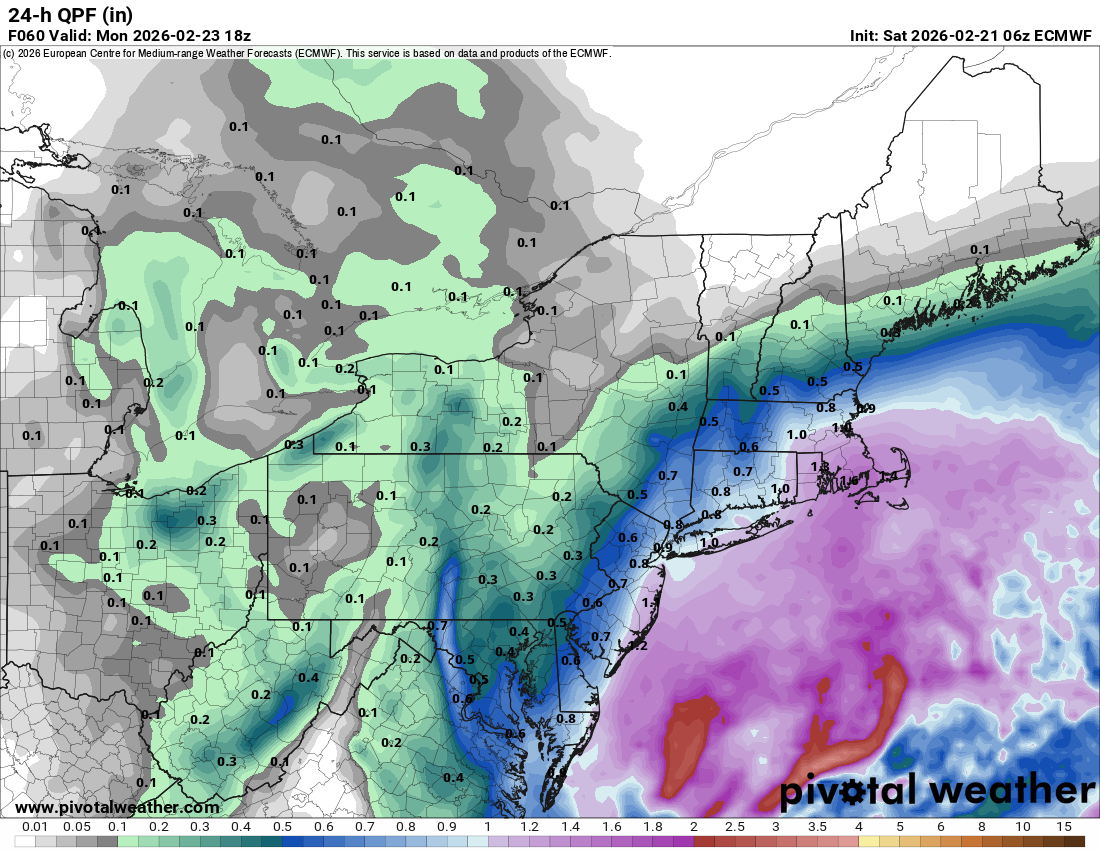
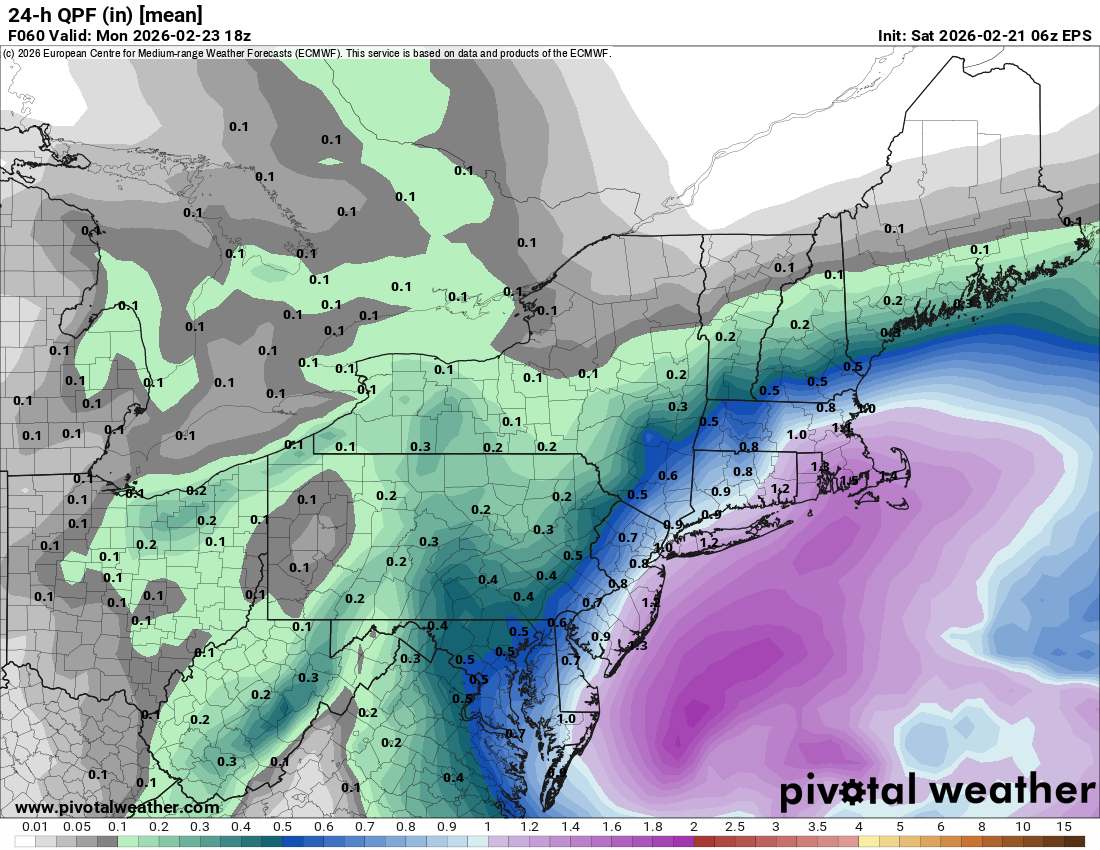
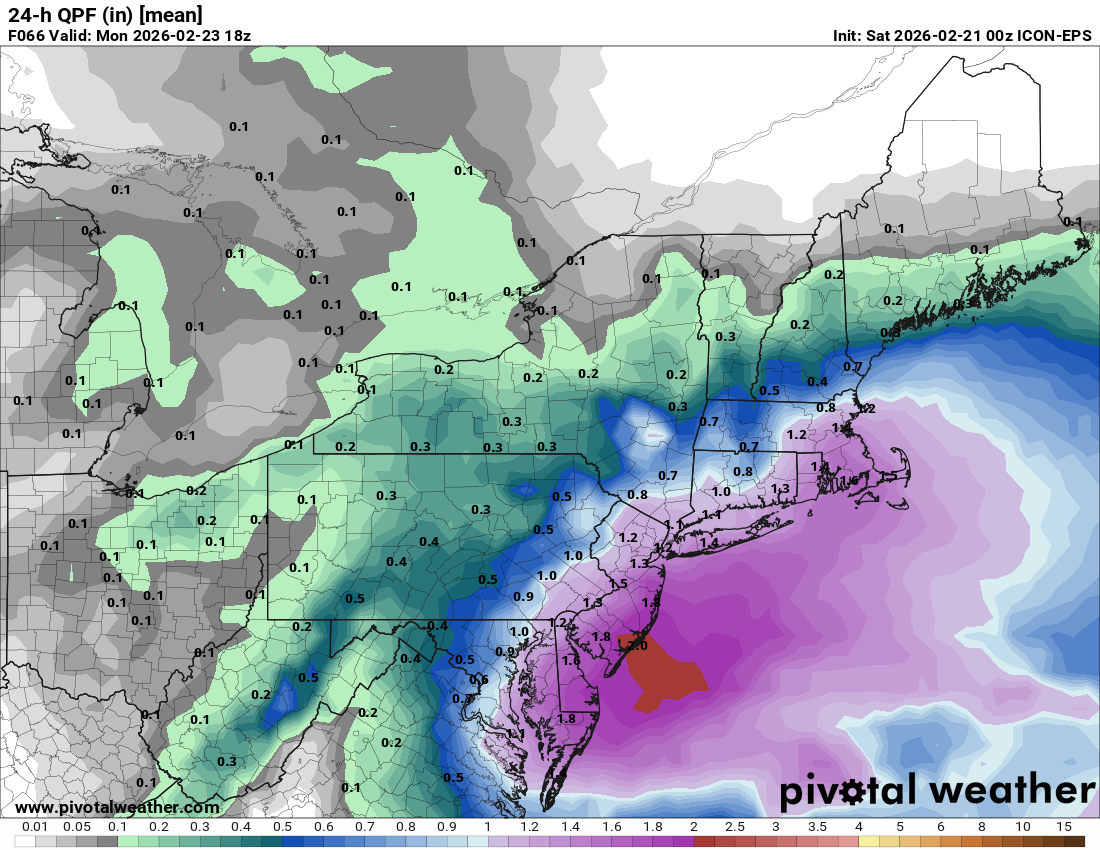
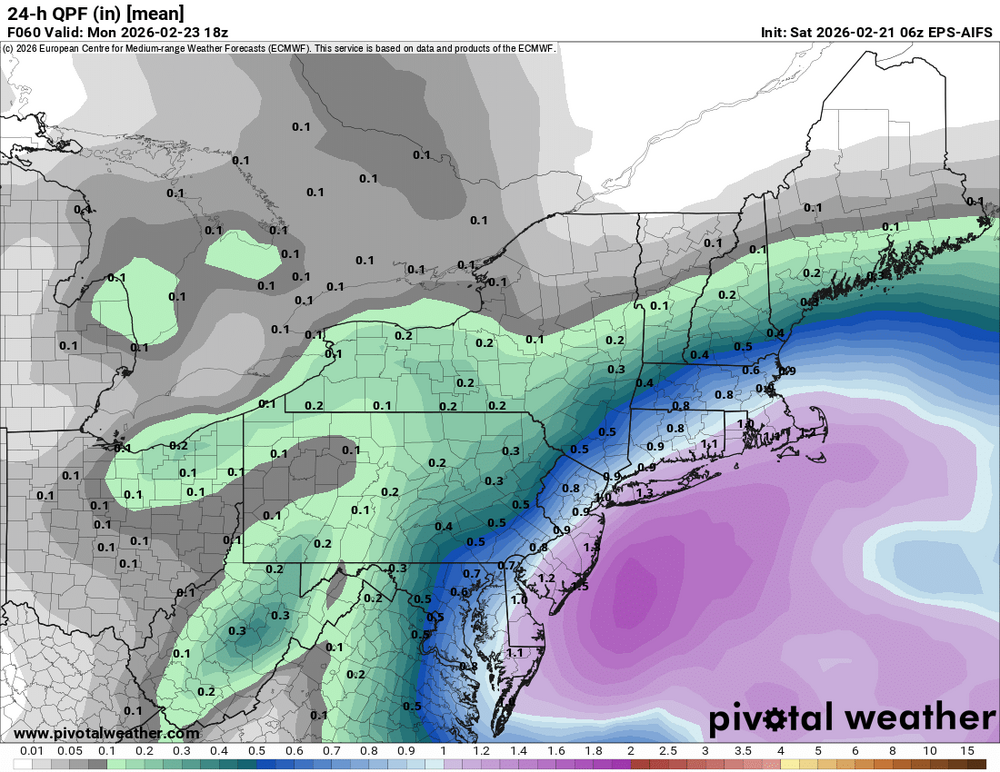
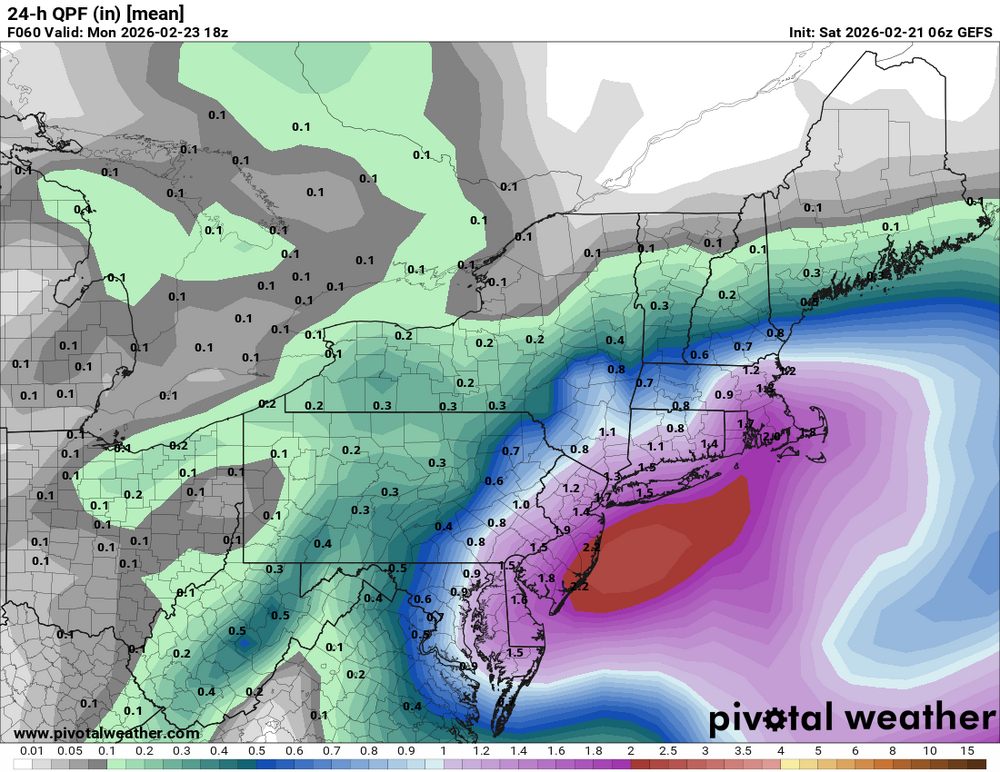
QPF 6z euro and 6z EPS standard version


-
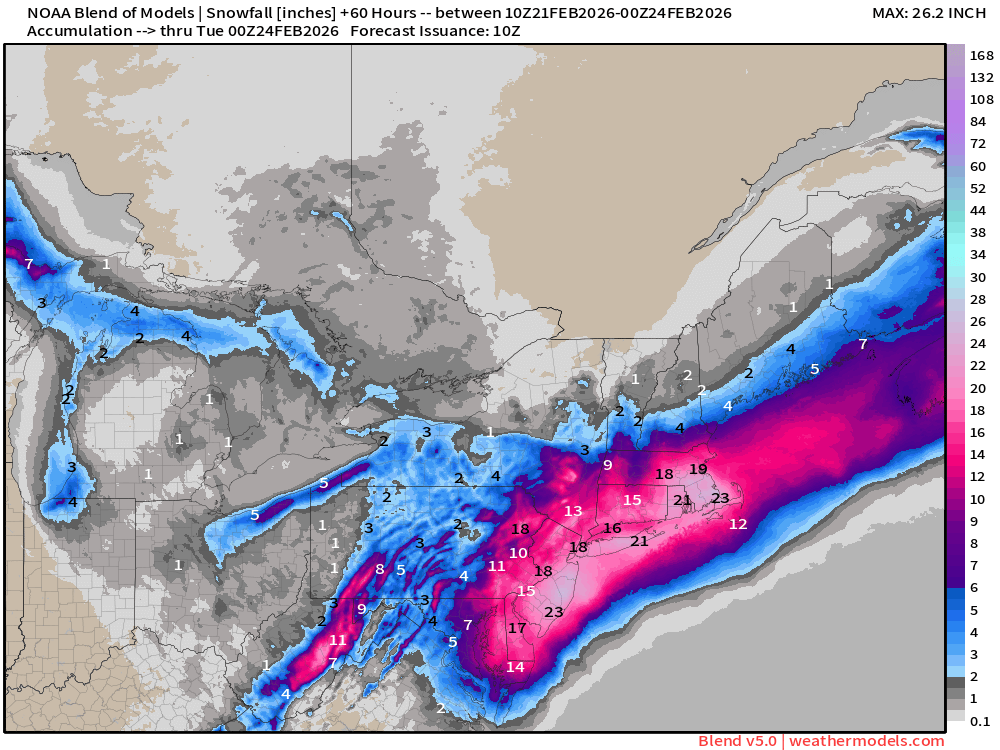
What an impressive NMB to see. And this is the more conservative experimental version 5.0
-
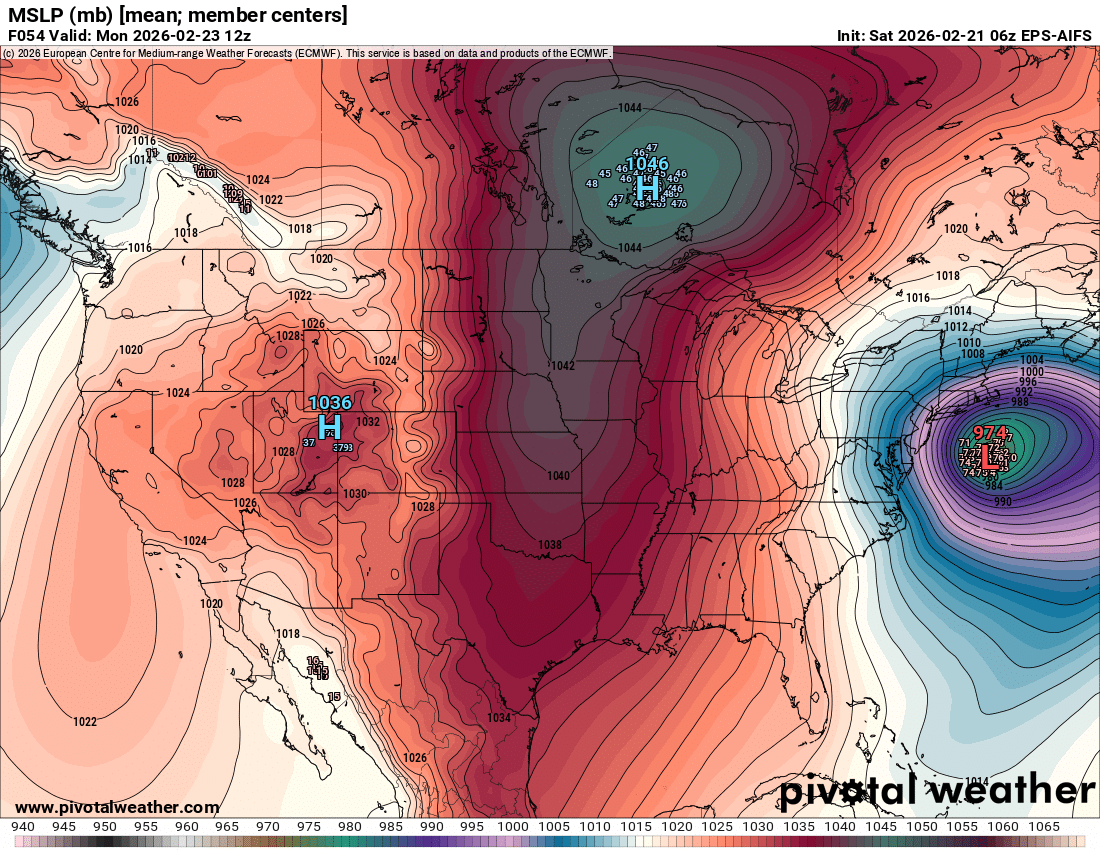
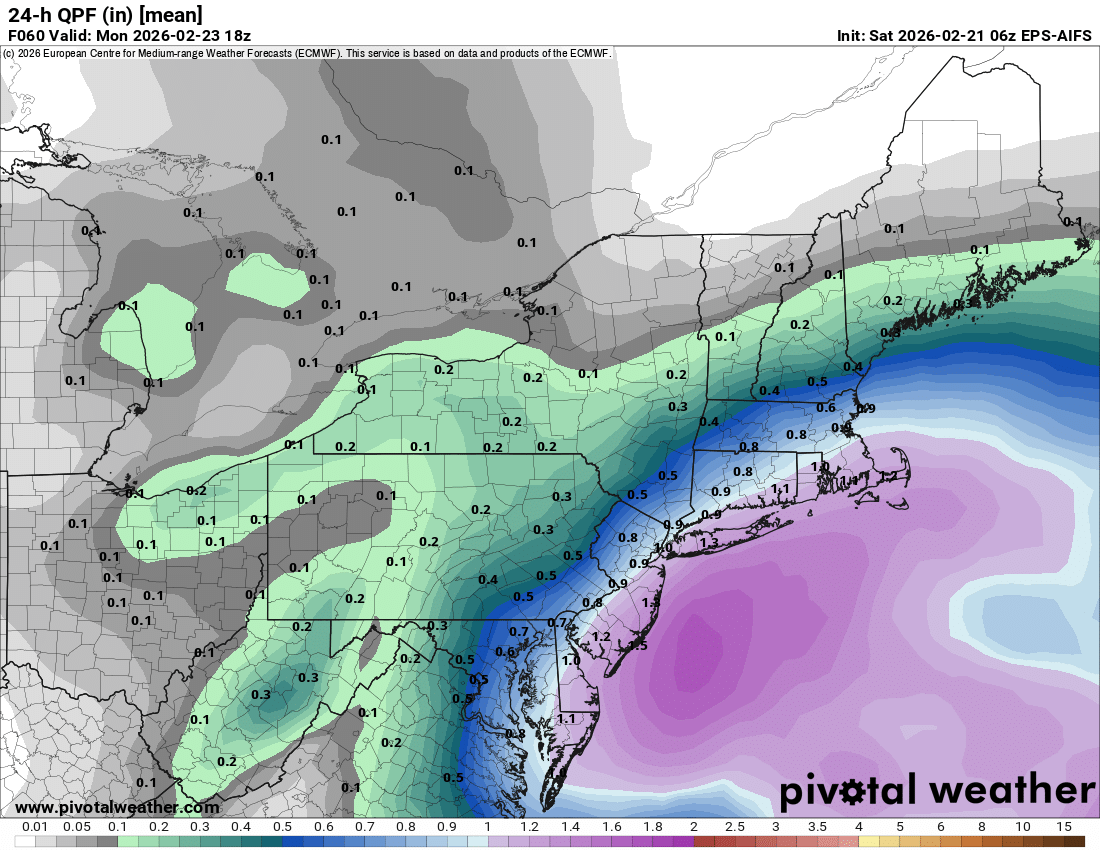
6z AI EPS is a banger
-
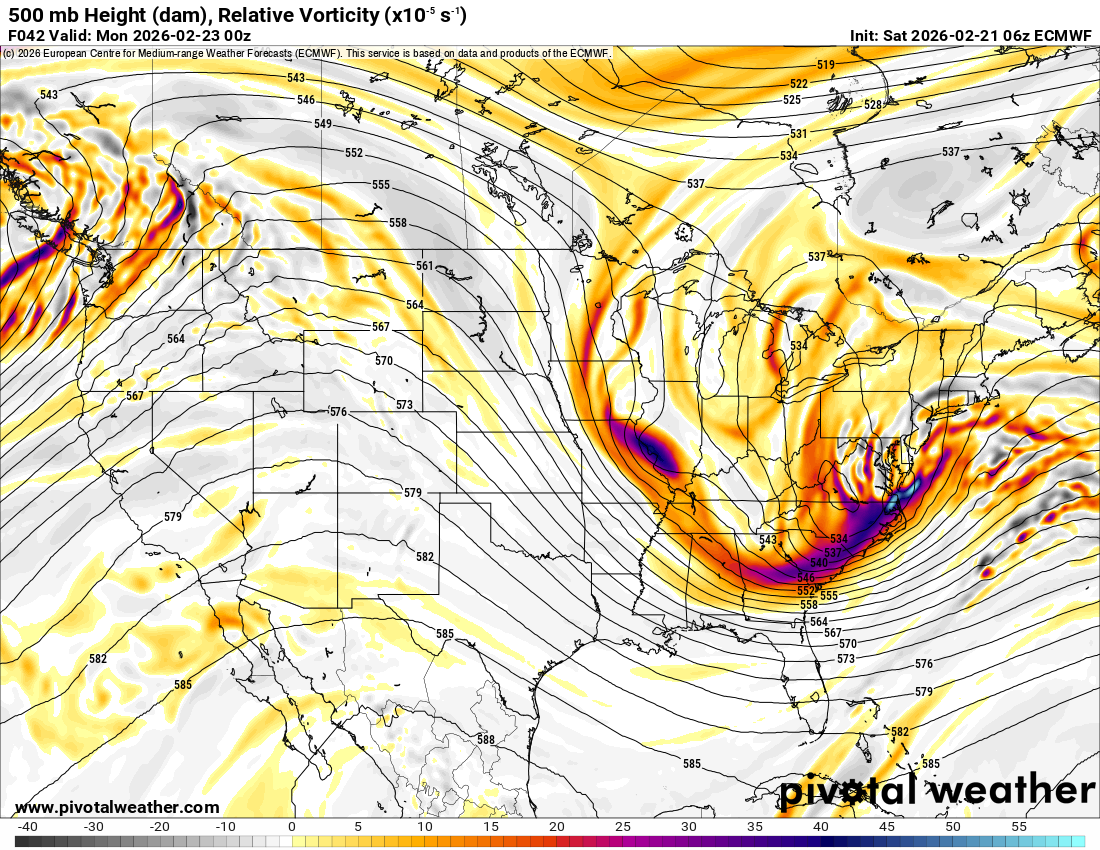
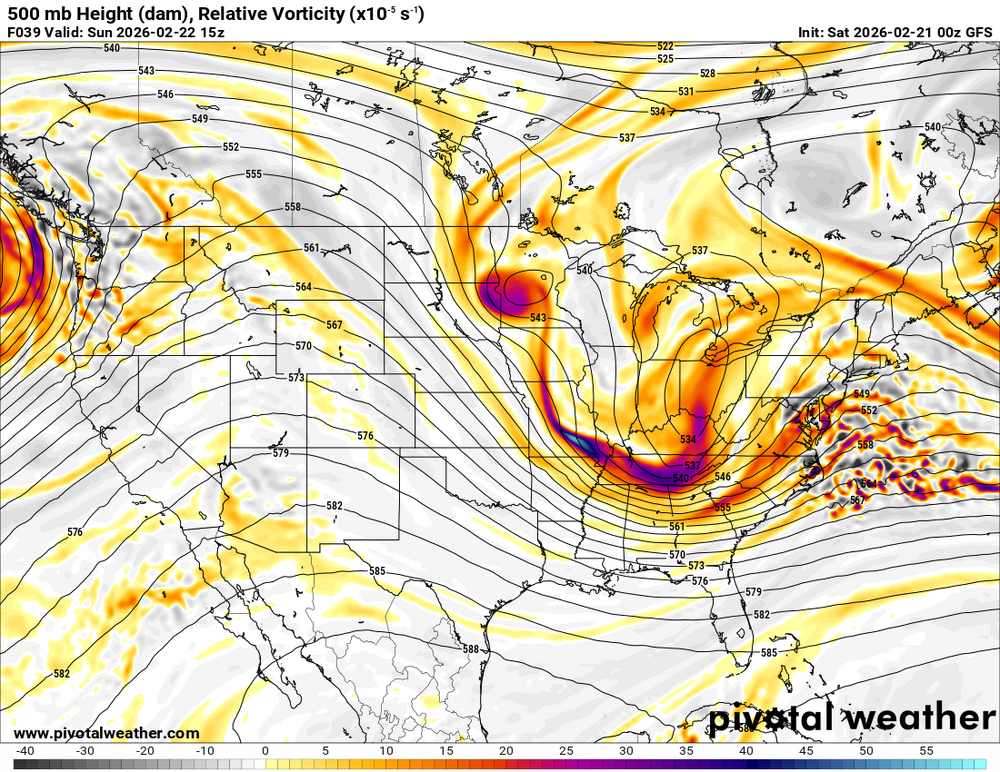
6z euro is amped
-
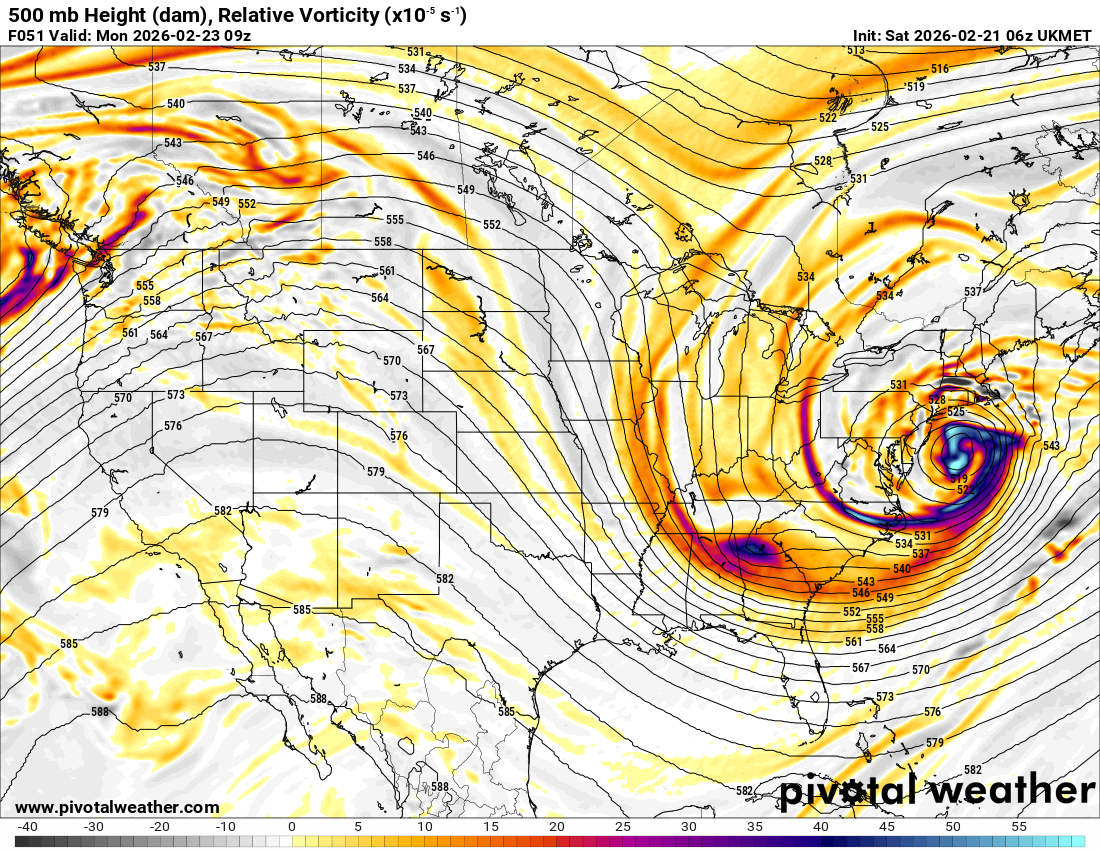
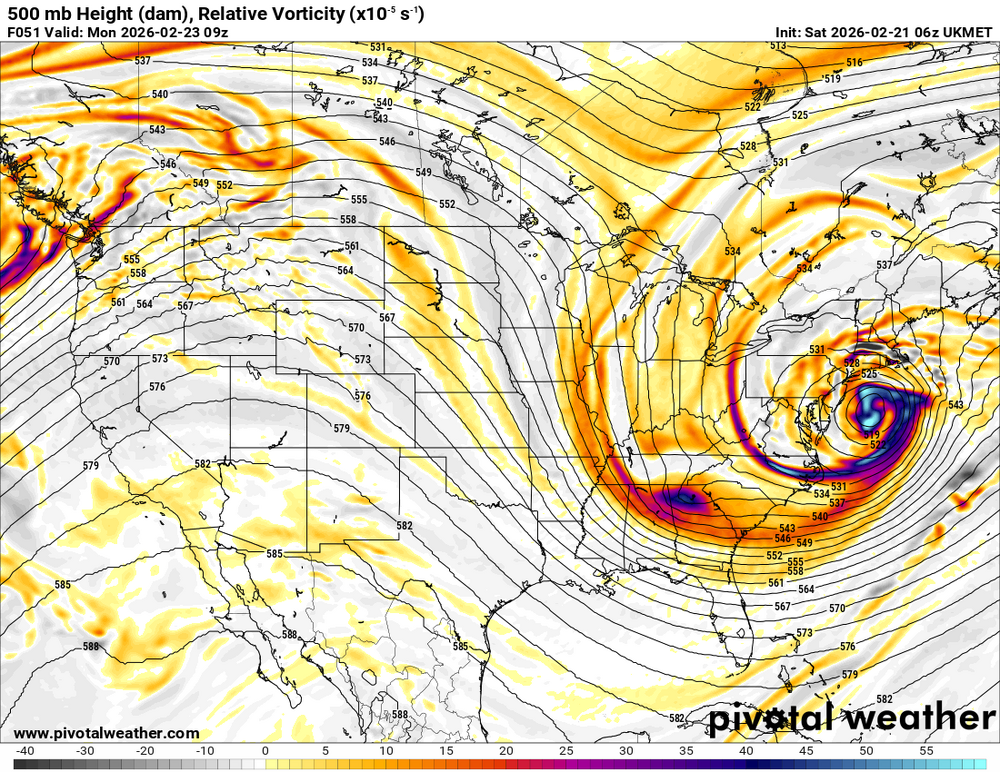
No love for the 6z UKIE?
-
-
My P&C forecast is 12-20 lmao. LFG!
-
Yeah this is much better than 12z on the canadian

-
WOW

-
This shouldn't disappoint
-
More amped lol
-
Might be blizzard of 26
-
-
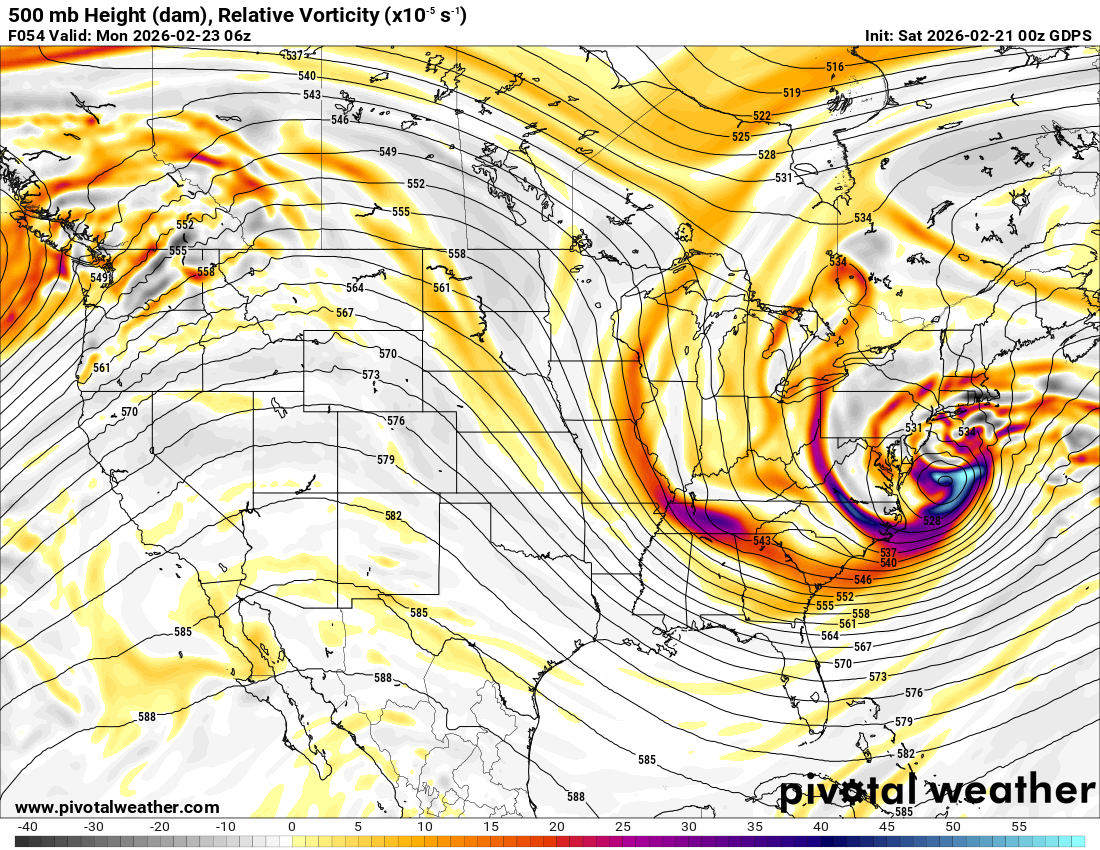
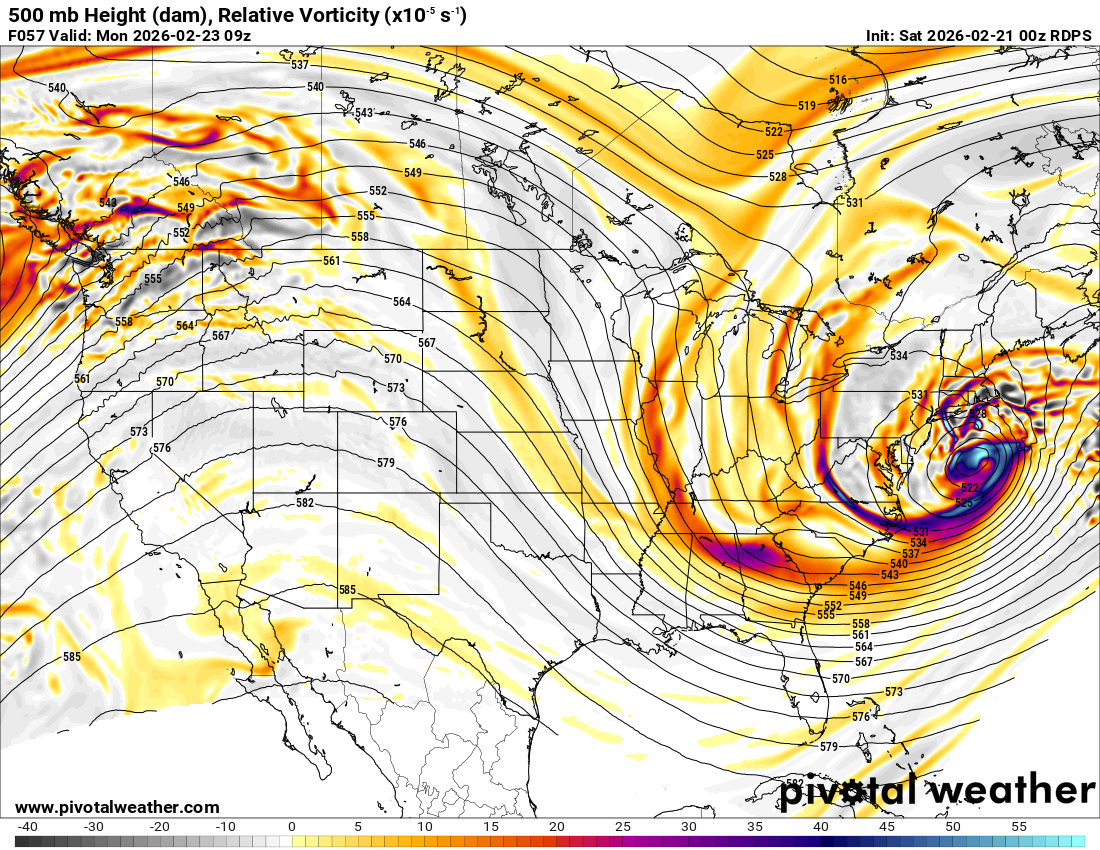
RGEM keeping the same theme as the others. Better phase and more amped.

-
Bomb inbound
-
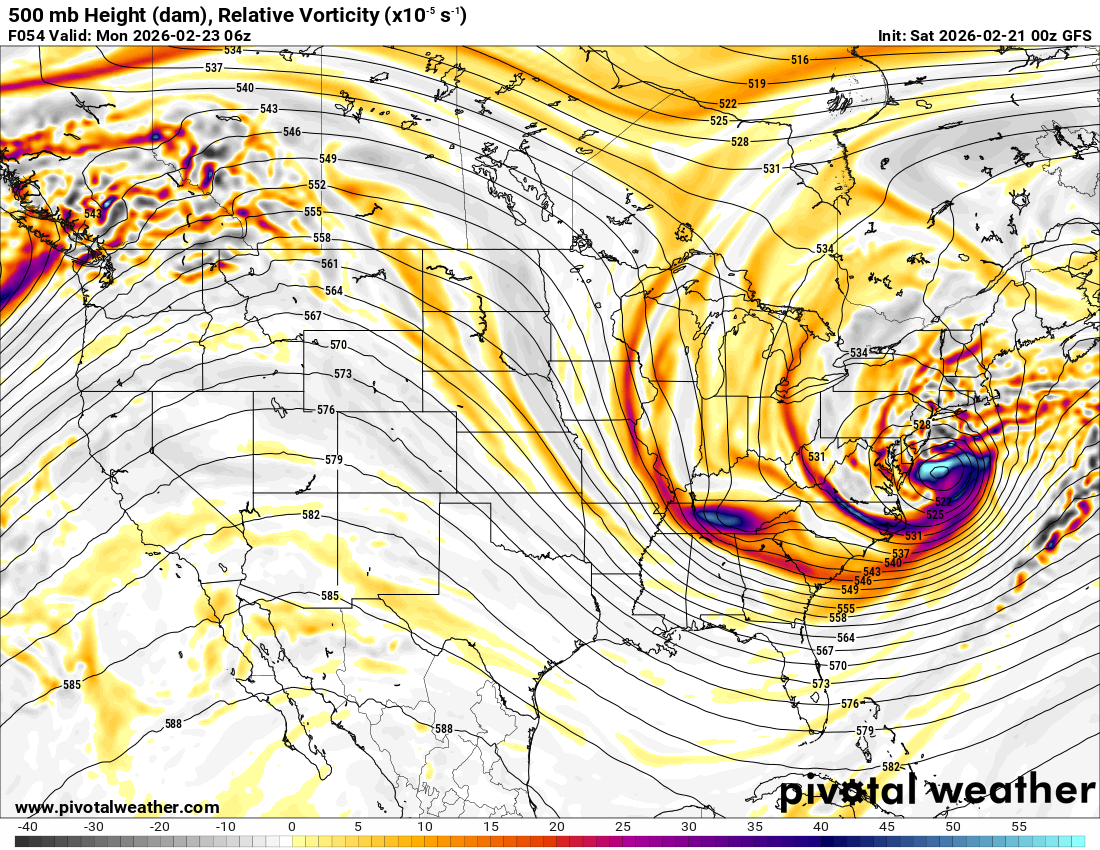
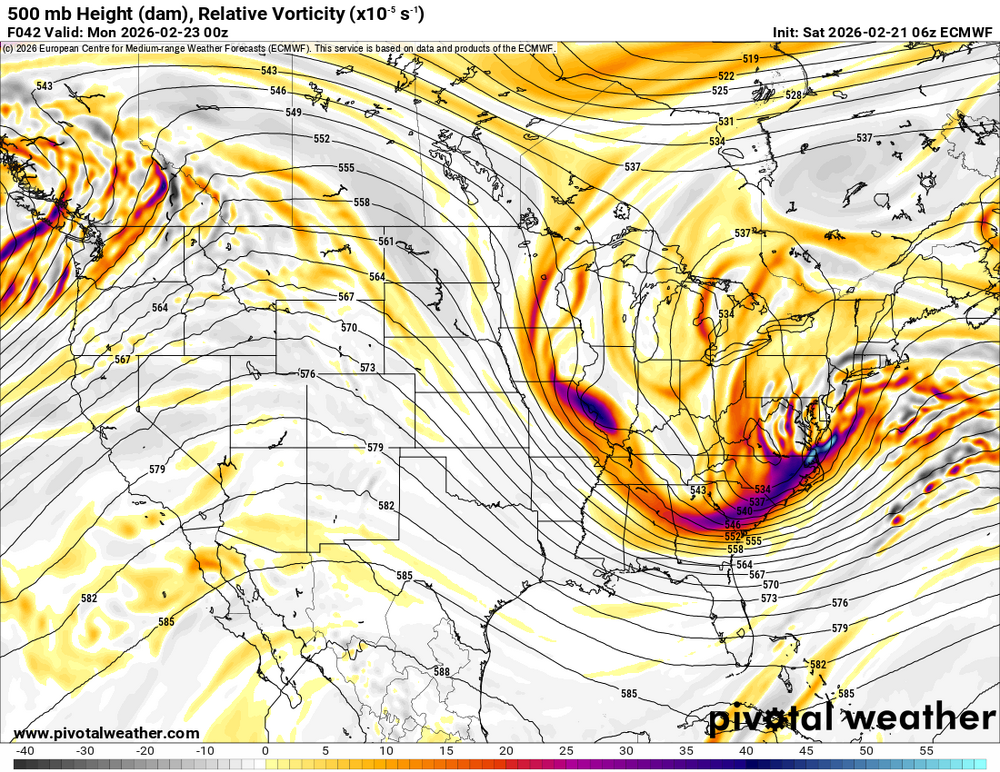
Heh, the trends towards better phasing have yet to cease...


.png.7dbf7aad302435fc8a0f655c792f831d.png)