Terpeast
-
Posts
6,682 -
Joined
-
Last visited
Content Type
Profiles
Blogs
Forums
American Weather
Media Demo
Store
Gallery
Everything posted by Terpeast
-
Feb 22nd/23rd "There's no way..." Obs Thread
Terpeast replied to Maestrobjwa's topic in Mid Atlantic
Ripping. 34. Should start to accumulate soon -
Feb 22nd/23rd "There's no way..." Obs Thread
Terpeast replied to Maestrobjwa's topic in Mid Atlantic
35 and dropping. All snow. Ripping flakes. It’s game on! -
Feb 22nd/23rd "There's no way..." Obs Thread
Terpeast replied to Maestrobjwa's topic in Mid Atlantic
Still not quite over me but great for KIAD -
Feb 22nd/23rd "There's no way..." Obs Thread
Terpeast replied to Maestrobjwa's topic in Mid Atlantic
Fatties mixing in -
Feb 22nd/23rd "There's no way..." Obs Thread
Terpeast replied to Maestrobjwa's topic in Mid Atlantic
Just saw the loop. Yes it’s a slow moving band that starts forming over me and migrates east slowly over several hours. -
Feb 22nd/23rd "There's no way..." Obs Thread
Terpeast replied to Maestrobjwa's topic in Mid Atlantic
I see flakes mixing in. About 20 minutes ahead of time? -
Feb 22nd/23rd "There's no way..." Obs Thread
Terpeast replied to Maestrobjwa's topic in Mid Atlantic
If this is correct (which is still an open question), someone in NW dc and alexandria is going to get pummeled -
Feb 22nd/23rd "There's no way..." Obs Thread
Terpeast replied to Maestrobjwa's topic in Mid Atlantic
Still rain, but down to 36 -
Feb 22nd/23rd "There's no way..." Obs Thread
Terpeast replied to Maestrobjwa's topic in Mid Atlantic
I’m under yellows per radar, but rain is not that heavy. I think there is some bright banding going on up there. It’s getting close (column is starting to cool) -
Feb 22nd/23rd "There's no way..." Obs Thread
Terpeast replied to Maestrobjwa's topic in Mid Atlantic
Over under 4”, those who get the norlun will be safely over -
Feb 22nd/23rd "There's no way..." Obs Thread
Terpeast replied to Maestrobjwa's topic in Mid Atlantic
I don’t think the globals have value at this point when calculating how much qpf falls before/after the flip and doing the math. The CAMs already account for this, they hardly have any accumulation (0.5” or less) anywhere but the high elevs until 22-23z. Even if we lop off an inch across the board due to melting, the forecast will still verify on the middle to low end. We won’t hit the 90th percentile numbers so I think we can put that to bed, but the forecast is still very much in play. -
Feb 22nd/23rd "There's no way..." Obs Thread
Terpeast replied to Maestrobjwa's topic in Mid Atlantic
Down another half degree. 37.3 -
Feb 22nd/23rd "There's no way..." Obs Thread
Terpeast replied to Maestrobjwa's topic in Mid Atlantic
Lost a degree in the half hour. 37.8 0.15” so far -
Feb 22nd/23rd "There's no way..." Obs Thread
Terpeast replied to Maestrobjwa's topic in Mid Atlantic
I’ll see your 3 miles east and then raise you another 10 miles west. May the best hand win -
Feb 22nd/23rd "There's no way..." Obs Thread
Terpeast replied to Maestrobjwa's topic in Mid Atlantic
There’s a “ridge” a mile to the west of me peaking at 475-500 ft, and I haven’t noticed any difference. But if talking about going up past the bigger hill on rt 7 west of leesburg, then yeah they’ve done better. -
Feb 22nd/23rd "There's no way..." Obs Thread
Terpeast replied to Maestrobjwa's topic in Mid Atlantic
Yes please -
Feb 22nd/23rd "There's no way..." Obs Thread
Terpeast replied to Maestrobjwa's topic in Mid Atlantic
That would be a narrow miss east from me -
Feb 22nd/23rd "There's no way..." Obs Thread
Terpeast replied to Maestrobjwa's topic in Mid Atlantic
I’m at 350, 7 miles NW of IAD. My relatively mid elevation hasn’t hurt me before in marginal events, but this time it might -
Feb 22nd/23rd "There's no way..." Obs Thread
Terpeast replied to Maestrobjwa's topic in Mid Atlantic
39/37 rain My station may actually be running a tad warm compared to neighboring pws, most are at 37 actually -
Feb 22nd/23rd "There's no way..." Obs Thread
Terpeast replied to Maestrobjwa's topic in Mid Atlantic
Before getting too excited/disappointed about the norlun placement, I want to reiterate that we won’t know where it sets up until it does set up. If you’re looking out and getting crushed under dark greens on radar, that’s when you’ll know (and those outside looking in will also know). -
Feb 22nd/23rd "There's no way..." Obs Thread
Terpeast replied to Maestrobjwa's topic in Mid Atlantic
I sure hope so, we’d be right in the middle of that if correct -
Feb 22nd/23rd "There's no way..." Obs Thread
Terpeast replied to Maestrobjwa's topic in Mid Atlantic
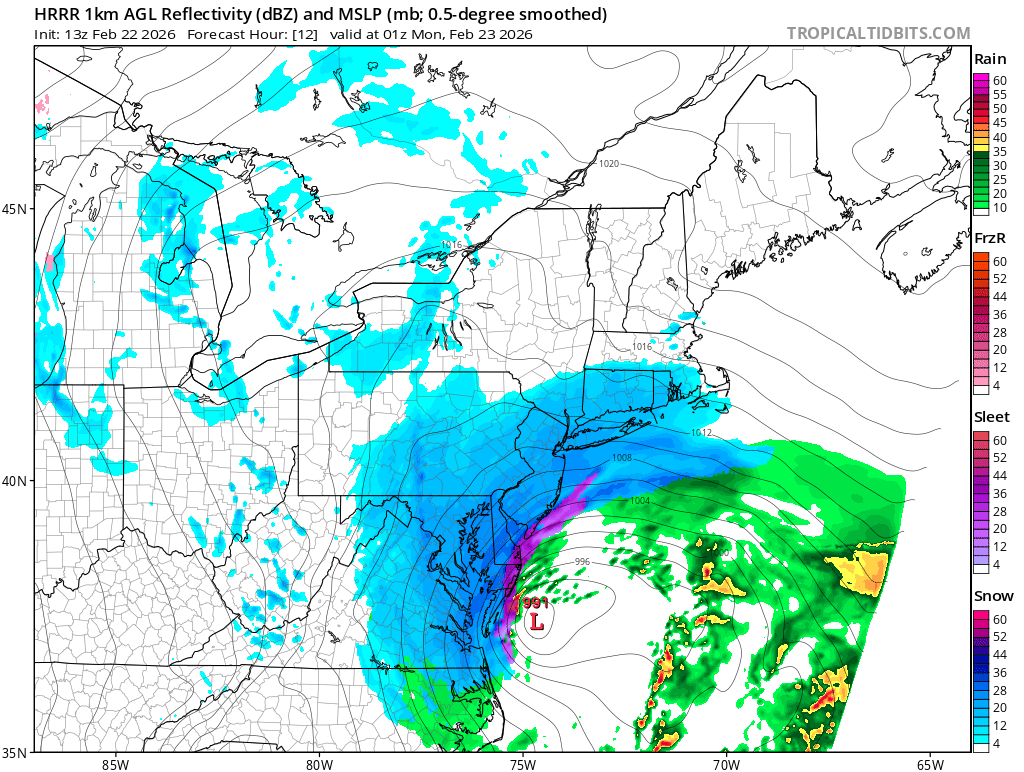
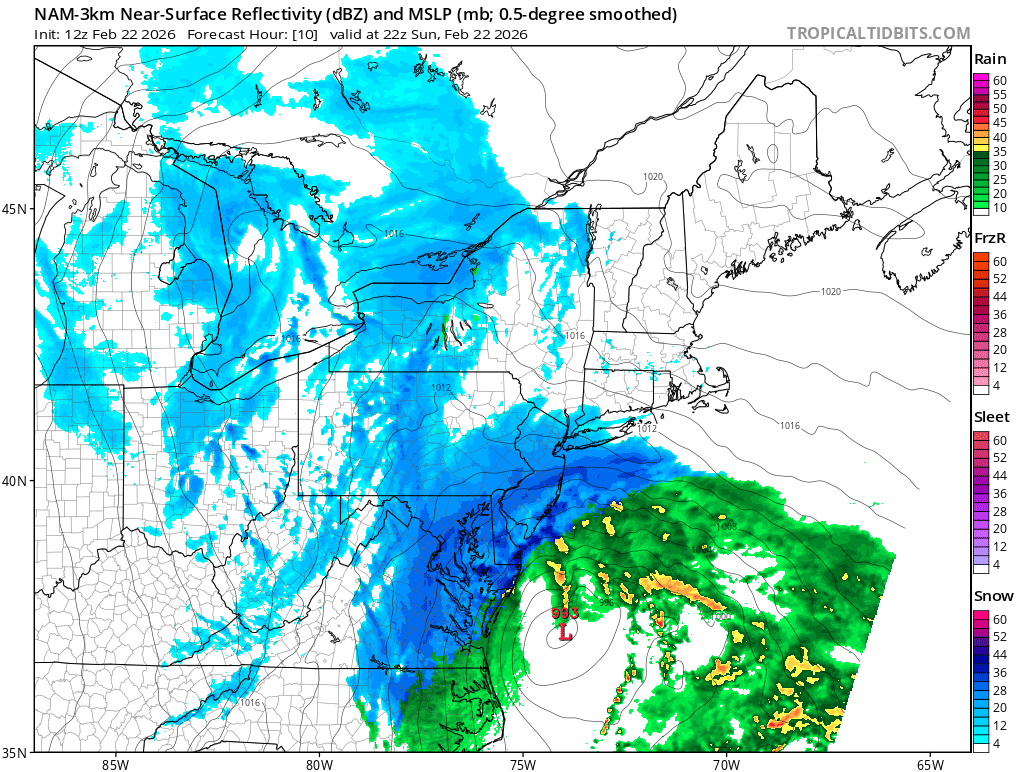
Preface by noting two different forecast time stamps. We should know where the norlun is setting up by 22z-00z (5-7 pm est) based on radar sigs from the CAMs: My guess is we will know by 5-6 pm

-
Feb 22nd/23rd "There's no way..." Obs Thread
Terpeast replied to Maestrobjwa's topic in Mid Atlantic
Yeah, even those seeing sn/rasn now probably won’t accumulate much beyond an inch until everyone flips after 5 pm still, I’d feel better if i’m at 35-36 now -
Feb 22nd/23rd "There's no way..." Obs Thread
Terpeast replied to Maestrobjwa's topic in Mid Atlantic
37.9, oof! -
Feb 22nd/23rd "There's no way..." Obs Thread
Terpeast replied to Maestrobjwa's topic in Mid Atlantic
It doesn’t flip us until 22z (5 pm) and still gives us 6” give or take