TheClimateChanger
Members-
Posts
4,025 -
Joined
-
Last visited
Content Type
Profiles
Blogs
Forums
American Weather
Media Demo
Store
Gallery
Everything posted by TheClimateChanger
-
Not to toot my own horn, but certainly some of us were noting this possibility 10+ years ago.
-
Wow, that 1886 storm is mighty impressive. Unfortunately, the records for Asheville, North Carolina are missing that month, or it would be their biggest snowstorm of record. Easily the biggest snowstorm on record at Knoxville, even today. The 14.3" storm total at Chatanooga [actually 14.5" if you include the 0.2" from 12-3] is second biggest behind the March 1993 Superstorm, which dumped 20 inches. Second highest single day snowfall at Chatanooga, and third highest at Knoxville.
-
Actually, I looked into the 1892 numbers. It seems "snow depth" back then was just a running count of how much snow had fallen during the month, so yeah that's nonsense. But even tossing out the first handful of years, the trend is down there. No idea why they stopped observing snow depth in 2004, or the trend would probably down even more.
-
Color me a little skeptical of the NOAA numbers, when these are the trends in snow cover. 1892 had 137 days with 1" or more snow cover, and 80 days with 6" or more of snow cover at Boston. Yet they claim only 50.5" fell that year. 50.5" in 1892 is not equivalent to the same amount in 2024. To quote the sitting president, c'mon man.
-
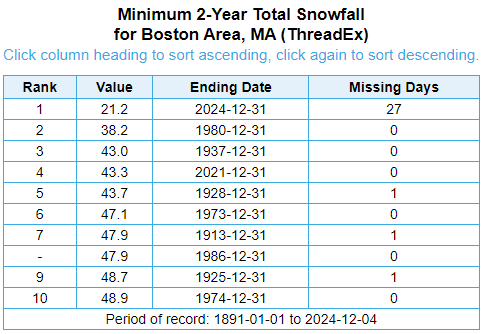
Boston is in need of 17.1" of snow by the end of the month to avoid its least snowy 2 years on record. Will be interesting to see how this plays out. If December is mostly snowless, then this record could be blown out of the water. Likely a snow drought unlike any other in the city's long and storied history.
-
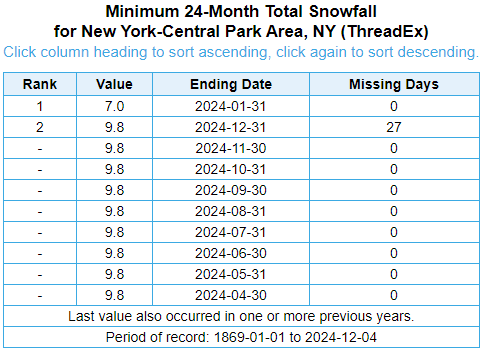
If we consider instead any 24 month period without regard for the calendar year, but ending at the culmination of a month, then the least snowy 2-year period is the 2 years ending January 31, of this year. Only 7.0" of snow fell at Central Park in that interval. Definitely a snow drought without parallel in the history of the city.
-
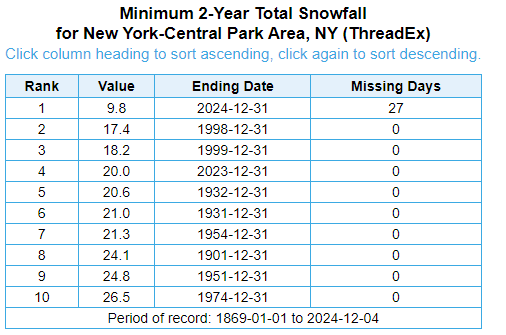
The Big Apple is in need of 7.7" by the end of the month to avoid the least snowy 2-year period in its long and storied climate history. Odds of a record?
-
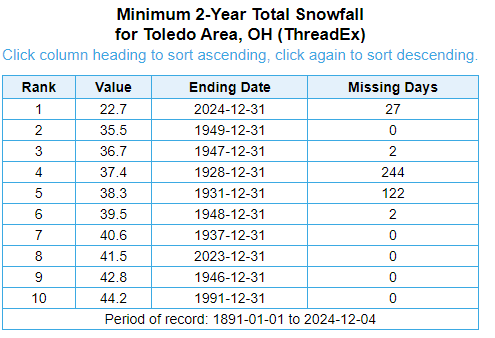
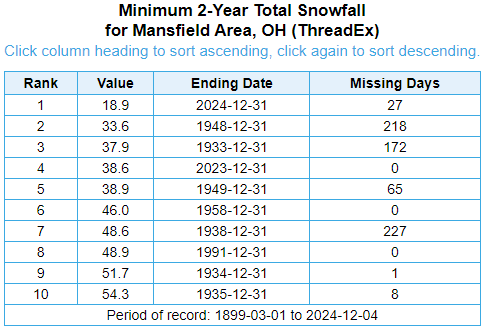
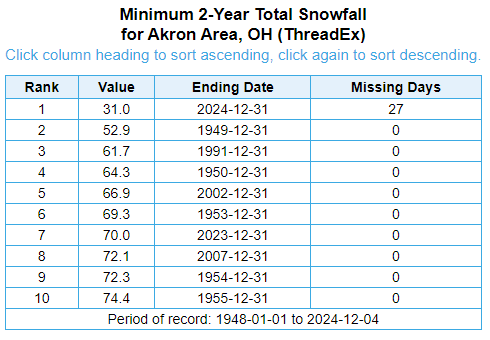
Will be interesting to see where we end up on these futility lists? Currently, many areas are undergoing a 2-year snow drought without historical precedence. Toledo needs 12.9" or more of snowfall by the end of December to avoid the least snowy 2 year period on record. Mansfield needs at least 14.7" to avoid the least snowy 2-year period on record [among 2-year periods using a very liberal 300 missing days limitation]. There are quite a bit of missing days for the second and third place years. Typically, if it's a multiple of 30/31, it's because they simply didn't record snowfall in the summer and early fall, and it's being interpreted as missing data [even though it obviously didn't snow]. But these are not multiples of 30/31, suggesting some data quality issues. They would need 20.1" to beat last year, which is the lowest 2-year period with no missing data . Canton/Akron Airport requires a whopping 22.0" the rest of the month to avoid the least snowy 2-year period on record. Simply amazing.
-
Pittsburgh/Western PA Winter 2024-2025 Thread
TheClimateChanger replied to Rd9108's topic in Upstate New York/Pennsylvania
Not even the dirty 30s from "dahn" in the city can approach these levels of futility. Truly incredible stuff. -
Pittsburgh/Western PA Winter 2024-2025 Thread
TheClimateChanger replied to Rd9108's topic in Upstate New York/Pennsylvania
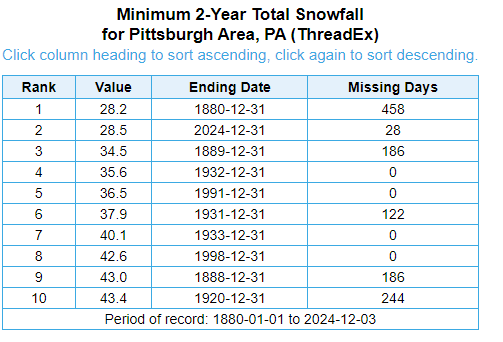
At this point, I'm rooting for futility. If we get 6 inches of snow or less the rest of December, it will be the least snowy 2-year period on record. The 28.2" from 1880 is only for 1 year, as snowfall records did not exist prior to 1880. -
November 2024 General Discussion
TheClimateChanger replied to SchaumburgStormer's topic in Lakes/Ohio Valley
They fixed it now. It was a dynamic link, just in case anyone is wondering. -
Looks like a decent snowfall out there in eastern Tennessee this morning. Was just viewing the Ober Gatlinburg webcam. Definitely blowing the snow out, but also plenty of natural flakes flying in the air.
-
So far, so good from Lake Erie. I wonder how this event compares to significant lake effect snows in November 1996 & December 2017.
-
Scattered lake effect snow showers and flurries continue downwind of the Great Lakes. Rochester had its latest first trace of snowfall (December 1) and matched its second latest first accumulating snowfall on record (December 2) on record at that location. The record for latest accumulating snowfall is December 10, 1948. Also, the streak of 240 days without measurable snowfall is the third longest stretch on record behind 1952 (260) and 1931 (254). 1st November of record without at least a trace of snowfall Latest 1st accumulating snowfalls on record
-
November 2024 General Discussion
TheClimateChanger replied to SchaumburgStormer's topic in Lakes/Ohio Valley
Something looks off with those Kalamazoo numbers. -
Pittsburgh/Western PA Winter 2024-2025 Thread
TheClimateChanger replied to Rd9108's topic in Upstate New York/Pennsylvania
I was hoping for a little snow on Saturday as well. Recent model runs had the system well north of us though. -
Pittsburgh/Western PA Winter 2024-2025 Thread
TheClimateChanger replied to Rd9108's topic in Upstate New York/Pennsylvania
Looks very likely that 2024 will go into the books as the warmest year on record. December would have to average somewhere in the range of 24-24.5F, or more than 9F below normal, for that not to be the case. The only real question is the margin of victory. A cold December isn’t enough to prevent a record. It would need to be among the coldest of record to not break the record - which would be a massive change from the blowtorch of the first 11 months. -
Central PA Autumn 2024
TheClimateChanger replied to Itstrainingtime's topic in Upstate New York/Pennsylvania
-
2024-2025 La Nina
TheClimateChanger replied to George001's topic in Weather Forecasting and Discussion
No problem, Don. Also, of note, the 22.6" officially recorded at ERI yesterday was just 2.2" shy of the entire seasonal total from last winter... which, incidentally, was the 4th lowest of record. The graphic below shows it as 6th; however, there is missing data for the winters of 1942-43 & 1943-44. If you cross-check the missing days from the climate reports using NCEI IPS, you'll see the seasonal total was over 48 inches in 1943-1944 and over 40 inches the preceding winter. The missing count for 1918-1919 & 1897-1898 appears just to correspond to months where no snow fell. No snowfall data was reported, which was interpreted as "missing" by the algorithm. And, of course, this ignores changes in snowfall measurement procedure which likely make the earlier data lower than it would otherwise be if the procedures were the same as today. -
Nobody uses BlueSky. Garbage X knockoff app.
-
2024-2025 La Nina
TheClimateChanger replied to George001's topic in Weather Forecasting and Discussion
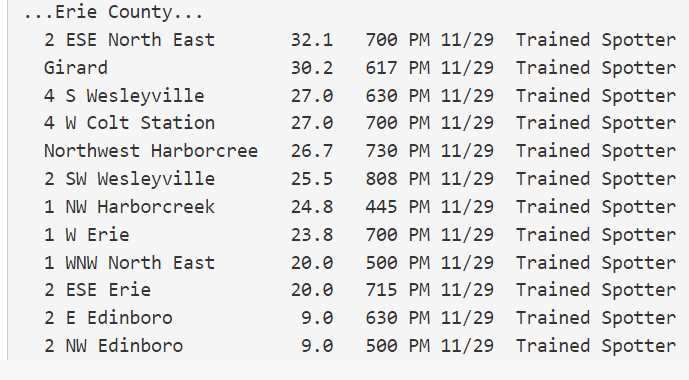
Highest amount [as of 7 pm yesterday] was 32.1" 2 miles ESE of North East, Pennsylvania, with another report of 30.2" from Girard, Pennsylvania shortly after 6 pm. No doubt well over three feet totals since that time. -
November 2024 General Discussion
TheClimateChanger replied to SchaumburgStormer's topic in Lakes/Ohio Valley
22.6" officially yesterday, nearly matching the total snowfall of 24.8" from last winter. In fact, with the snowfall this morning, it's probably already gone over last winter's total. Unofficially, up to 30 inches in some places in northwest Pennsylvania yesterday.


