vortex95
-
Posts
2,211 -
Joined
Content Type
Profiles
Blogs
Forums
American Weather
Media Demo
Store
Gallery
Everything posted by vortex95
-
Thanks. I do worry at times my posts (rants) go overboard. I like to delve into deeper issues within the profession, like how we calculate and measure it all. Sometimes we can take that for granted, or get so deep into debate/discussion, we forget the basics or to take a step back and look at the big pix! I also enjoy the social aspects of meteorology, as that explains a lot as to how we and the general public react and perceive things. As I think I have said before, the fcst science is not really an issue/problem as much given all its advances, it is sorting it all out, interpreting it, and communicating it that is an immense challenge. And social media, for all its positives has it share of negative. I like forums like this -- "old SKEWL social media!" Posts can be short or long form, and stay specific w/ solid moderation and not be at the whims of large social media companies.
-
Would you prefer the NAM? Can't have it both ways!
-
FWIW, overall the CG counts has not been that crazy so far. So in that regard, not much to "miss!" Cells themselves have not been that impressive structurally as a whole as well. Misery loves company! Maybe we can pull it off later as stronger forcing comes in.
-
Ugh. What a waste of awesome CAPE if it can't be realized. I do not like the mid-level anvil precip to our W. How often do sig storms fire when that is already in place?
-
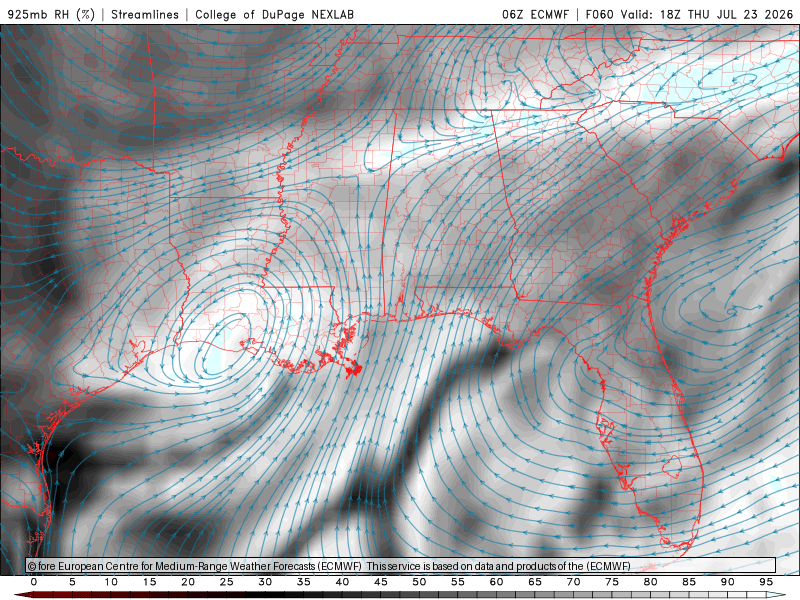
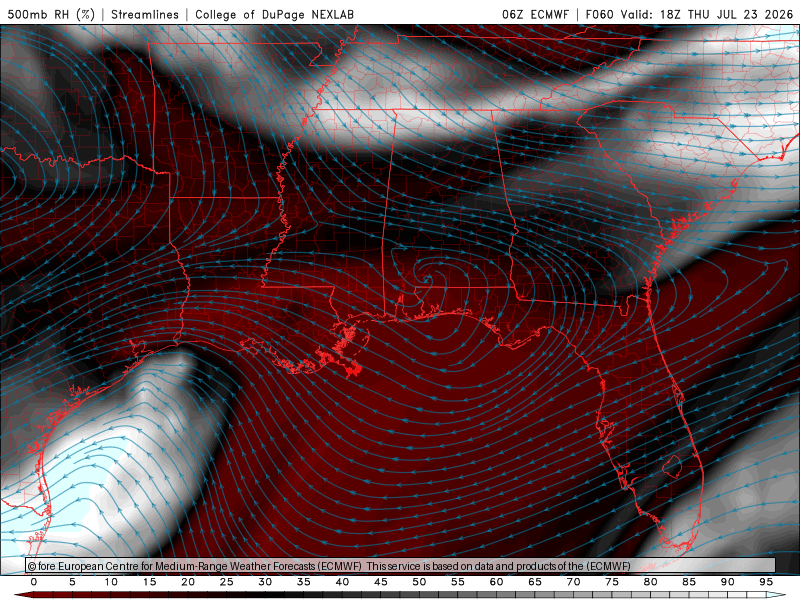
The storm is more sheared today than ydy, yet it is stronger, likely b/c the LLCC is larger, more coherent/tight. Ydy, it appeared we had more than one LLCC. The winds in sheared systems can be tricky, and I wonder how strong NHC would have Bertha if it was far at set and no recon. Probably no more than 40 kt. Just from empirical obs alone, I think sheared systems in the absence of recon are often underestimated Given the large LLCC, it may well stay intact all the way to GLS. However, look at the 06z ECMWF 925 vs. 500 RH/streamlines fcst hr 60. Quite a disconnect from NE shear! Probably just a low-level swirl w/ small bursts of convection.
-
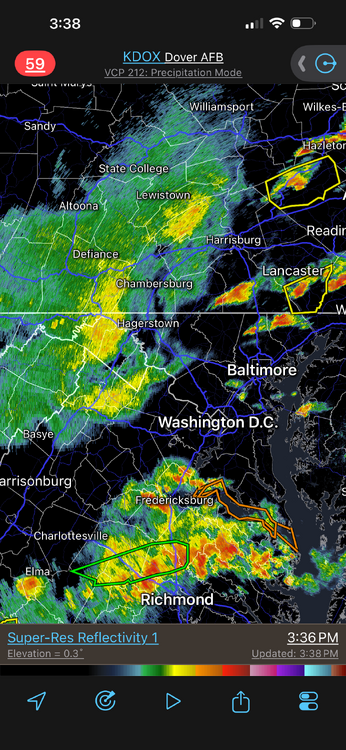
Yes, I do not like to see a big cluster of storms S of an area of interest. It seems more often than not, that means the area to the N is ripped off!
-
I.m little concerned about the immediate DC area. Seems like the "split" is already evident on radar w/ the large area near RIC and the isolated cells along the PA border. A lot of clouds now before we get any solid storm development! What the 15z HRRR fcst for 19z for the DC metro is *way* off. Storm cluster fcst vs. zip! That being said, isolated discrete storms are starting develop now in the area, so that's what was shown last night and then big line in the evening is still fcst. So it may yet work out? Only got a svr box, no tor box, despite 5% tor probs. Usually w/ 5% tor probs we get a tor box. Perhaps SPC did that b/c they noted what I pointed out above (too much cloud cover in the risk area)?
-
I'm not sure there will be much left to track after about 60-72 hr as the entire circulation gets sheared apart. HAFS-A/B do have any coherent sfc center by 72 hr. You can see the deformation pulling it apart well at 850, 700, and 500 on the ECMWF RH/streamline fields. NHC showing a trackable center from their 03z advisory at 96 and 120 hr seems optimistic IMHO.
-
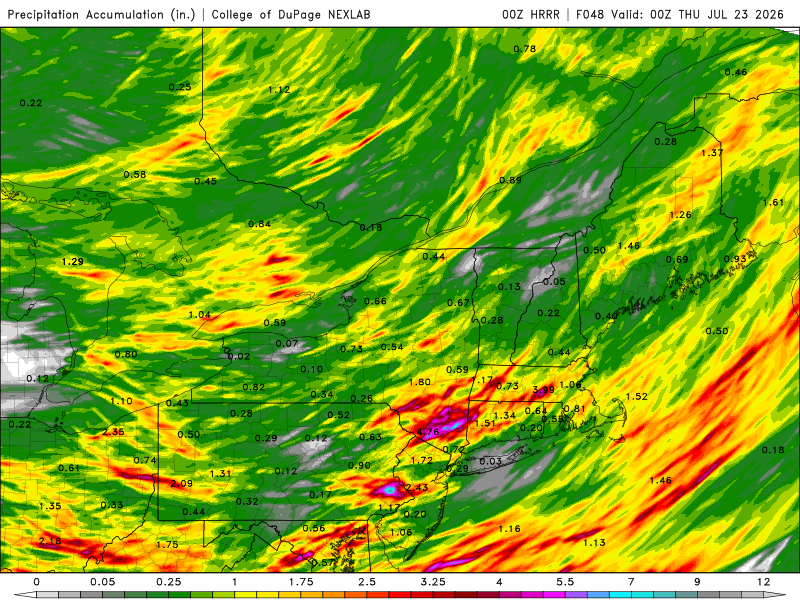
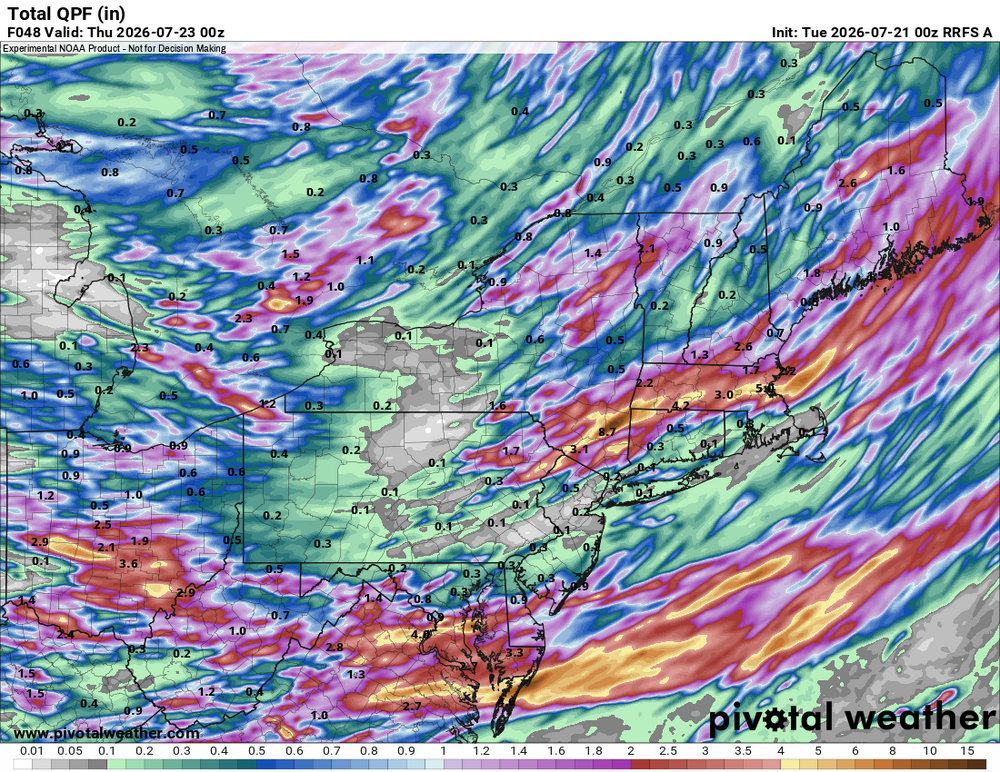
00z HRRR and esp. RRFS go big w/ the QPF Tue and Wed. Sern NY bulls-eye again! Tor risk wrn sections today and entire area in MRGL Wed. Quite the 500 trough for July to impact the region and it just doesn't quickly swing through. Train echo tstms likely. And hardly any talk here? Wxwiz, I am disappointed! CoastalWx probably "MEH!" And work more on this drought. You'd think its so bad from the MSM when VT has no drought, much of NH nothing, and the same for ME. Since the start of the year, the DSCI has dropped from 137 to 70 for the Northeast and Mid-Atlantic, but do you ever hear about that? "Oh, but ern MA is in severe drought!" Local drought is not the same as widespread drought.
-
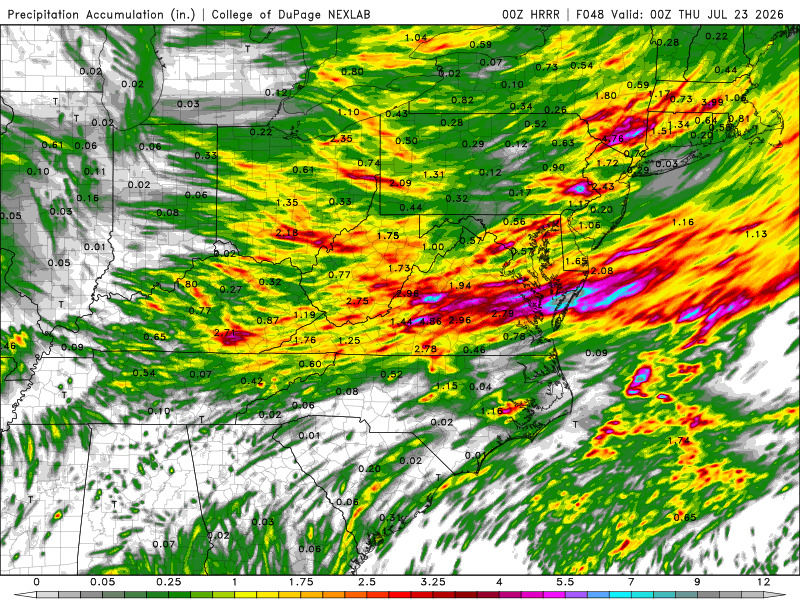
Wow. You get the classic "discrete cells ahead of line" which you always have to watch closely for tor potential, then big clusters w/ training psbl and FF threat. And now much of the DMV could do well on Wed as the front gets hung up w/ more training and FF threat. The 00z HRRR is really big for QPF. 48 hr totals 5" max just NW of DC and a whopping nearly 12" max near WAL! Well, we do need the rain. 00z RRFS is very similar to the HRRR for big QPF w/ the 5" max just S of DC and an 11" max near WAL. Winds aloft look better than the last event for svr wx. I esp. like the 250 mb speed max approaching late in the afternoon, so discrete supercells should sustain better. Tor threat is there but not high-end.
- 2,604 replies
-
- 4
-

-
- severe
- thunderstorms
- (and 7 more)
-
I *never* get sick of +CGs, even when they do not strike close. One time, I had one strike about 6 mi from me about 1 hr before sunset, and even though I did not see the bolt, the flash was unusually bright and "encompassing" (meaning it was bright all around me, not a flash in the distance) for the daylight hours, and I go, "ooo, there is going to be big thunder." And I counted, 30 sec later, a really deep THUD! The acoustics can be really bizarre!
- 2,604 replies
-
- 1
-
-
- severe
- thunderstorms
- (and 7 more)
-
Or the Ivan tor day in Sep 2004? What, like 40 tors in VA alone, and many clustered right up to the MD/VA border just W of DC! I think that day is the only SPC MDT ever issued for a TC tor event. There were so many tors in VA that day, that if you look at a map for the CONUS showing which month tors are most common for each state, VA says "September" -- all b/c of that Ivan tor day! It shows how a single outlier event can skew climo big time.
- 2,604 replies
-
- 1
-
-
- severe
- thunderstorms
- (and 7 more)
-
I noticed that this year. 45% for wind is being issued more often E of the Mississippi. It can be misleading, esp. when doing stats over time for trends. Our standards are practices change, and the fcst science advances. It reminds me of when MRGL and ENH was added. You get more of a "bulls-eye effect" now when you have a sig svr wx outbreak fcst, but it does not mean things are more amp'ed or intense for sensible wx, just we can just be more precise w/ outlooks given better modelling and knowledge.
-
One thing w/ the WBZ, if you can get a stout supercell w/ intense mid-level meso, the WBZ means little b/c hailstones get so large and fall so fast, little melting occurs upon their final descent. Also, such large, cold ice masses actually can continue to grow upon their final descent since drops are freezing upon contact of the mass. The best is when directional shear is huge. It really strings out of hodograph and increases the residence time in the HGZ. You get more "twisty" updraft spirals. It's one reason why hail is so common in the Front Range, lee troughing promotes backed low-level winds and you have W or NW flow at 500, so at times literally 180 deg turning sfc-500! Also, don't need very strong winds. You can have SE winds at 20 kt at the sfc, and 20 kt out o the NW at 500,, that equates to 40 kt deep layer shear, and you have enough for supercells despite winds aloft not standing out.
- 2,604 replies
-
- 1
-
-
- severe
- thunderstorms
- (and 7 more)
-
From a satellite presentation, I agree w/ the NHC upgrade to TS at 00z, sheared as it may be. Look at the last VIS, it seems one LLCC is moving farther away from the convection to the N, and it looks like there may be another LLCC to its WSW that is drifting SSW. This is common for broad, nascent TCs -- more than one LLCC. For a sheared system, I am surprised the convection on the downshear side is not more intense. It has struggled to get to -75 C for cloud tops. Often, sheared TCs have much colder convective tops (<-90 C) than even a mature hurricane as wind shear actually promotes more intense convection from dry air mid-level and better lapse rates hence stronger tstm updrafts. Not the best looking TC on sat or radar, but they come in all sorts of types. A spectrum, not one-size-fits-all! Such a formatiom outside the MDR/deep tropics) is consistent for a strong El Nino year.
-
This is a case where the shear is not from a trough, but the E side of a strong upper-level ridge. In these cases, the TC can be forced to the S, which is a motion that TCs most often do not respond to well. Convection gets sheared away in short order and you are left w/ an exposed LLCC the moves more w/ the low-level flow.
-
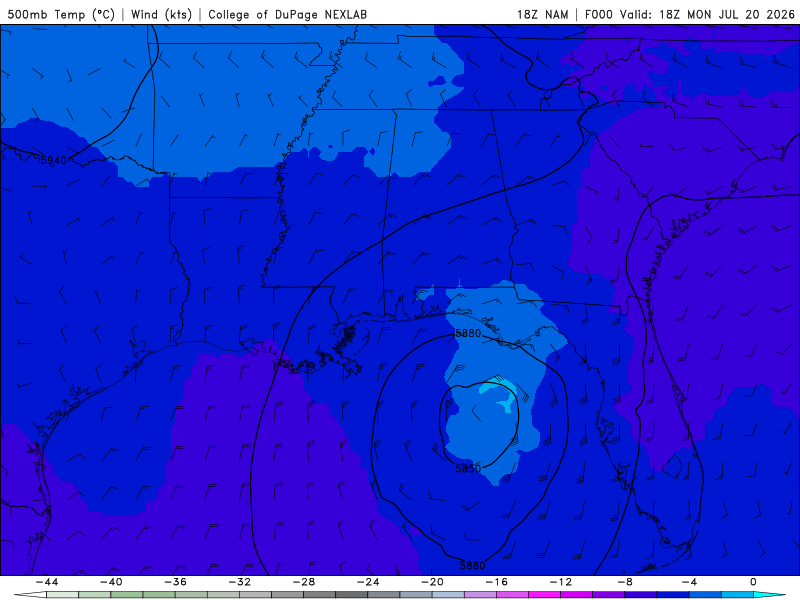
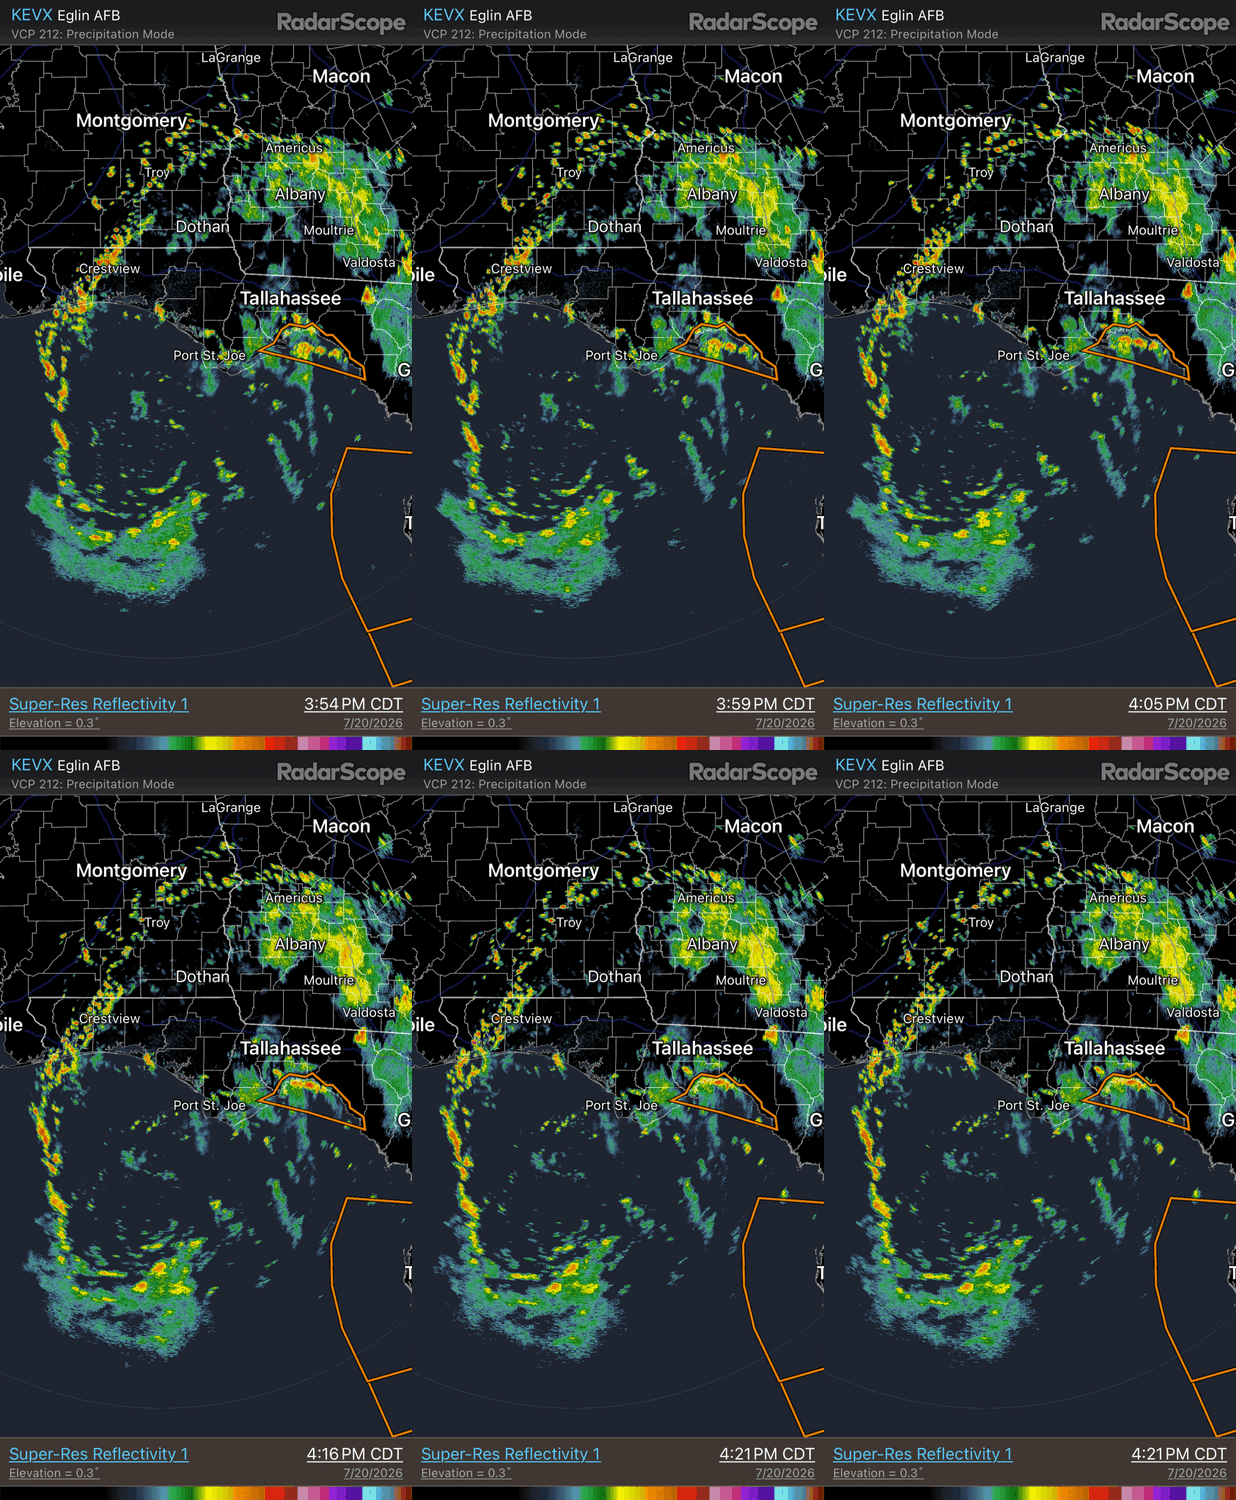
It became more warm core faster than expected. 500 analysis 18z NAM shows warm core at 500 w/ temps to -2 C (attached). HRRR the other day showed the gradual organization well and the broad skeletal structure w/ the banding. See radar loop attached. Being so broad and dry air issues, it likely going to have problem tightening up, and by 36 hr, the ECWMF shows the 500 low getting sheared apart from deformation. GFS does not show this nearly as much, but I trust the ECMWF more there. Also the GDPS is similar to the ECMWF. The LLCC looks to eventually accelerates W after its gets to the LA cost, which is generally not good (too much shear) for a weak system in in tropical easterly flow. Sharp asymmetry fcst w/ all the heavy rain sheared to the S of the LLCC. Just an empirical observation over time, NHC seems to intensity too quickly nascent systems that are broad and not in the best overall environment In the first advisory ydy at 15z, they had it a 35 kt TS by 12z today. Second advisory 35 kt TS by 18z today.
-
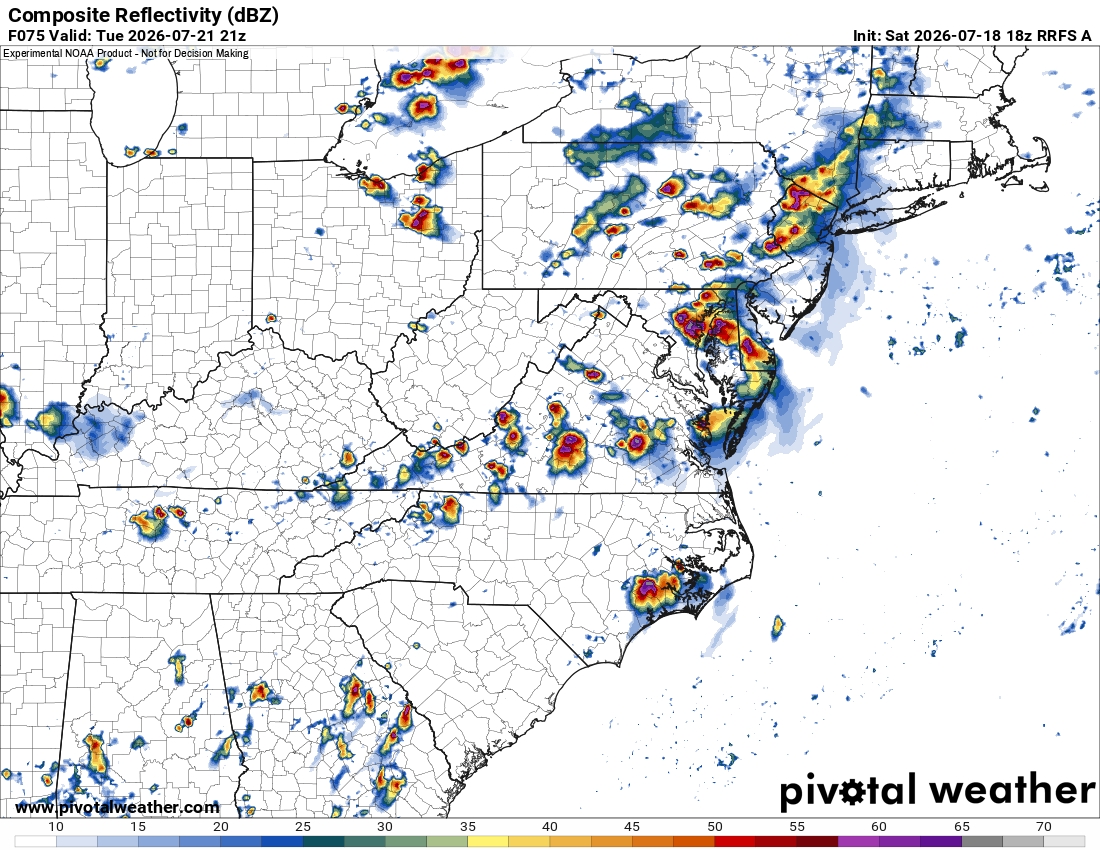
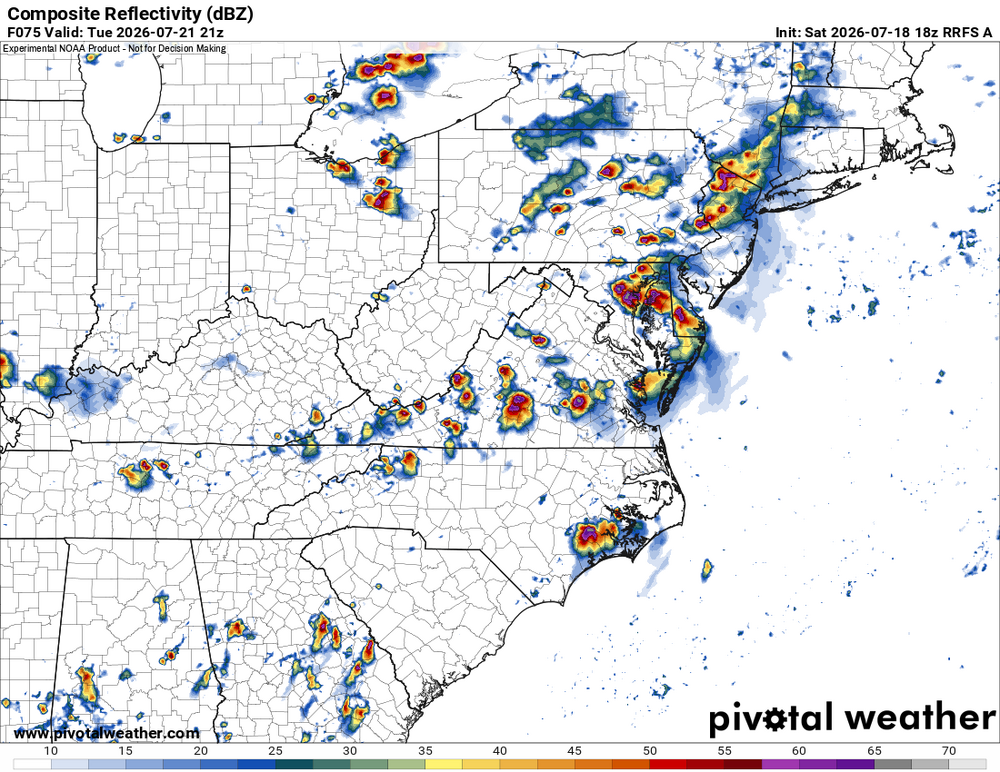
RRFS valid 21z Tue looks promising. Quite strong 500 trof for this time of year. Solid jet dynamics appear likely so supercells. Now, tor potential, that's an entirely different story and we'll have to wait until much closer to the event for things to become clear.
- 2,604 replies
-
- 2
-
-
- severe
- thunderstorms
- (and 7 more)
-
2026 Atlantic Hurricane Season
vortex95 replied to Stormchaserchuck1's topic in Tropical Headquarters
I don't know if the RRFS can handle TCs properly. This is a good question for the modelers. The NAM never was designed for TCs we know. The RRFS seems overdone, esp. given by 72 hr a strong deformation shear zone get established along the nrn Gulf Coast, and the system gets torn apart aloft. The HRRR through 48 hr does show it becoming a TD, but again, I am not sure how good mesoscale models not specifically designed for TCs, such as the HAFS and HWRF, do here. The 2m wind field looks choppy and pock-marked on the HRRR by 36 hr. The HWRF from 18z today shows sig development having is 992 mb by 60 hr, but that appears overdone. GFS/ECMWF suggest weak TD status before the environment becomes unfavorable. -
That is an exceptional amount of CAPE (nearly 6000) for a location on the East Coast. I am surprised there were not more svr hail reports. Low-level shear is weak. 0-6 km shear 37 kt so there is your supercell support. I think the storm coverage was a bit too much and that is what precluded more sig svr wx overall. A bit stronger capping probably would gone a long way.
- 2,604 replies
-
- 2
-
-
- severe
- thunderstorms
- (and 7 more)
-
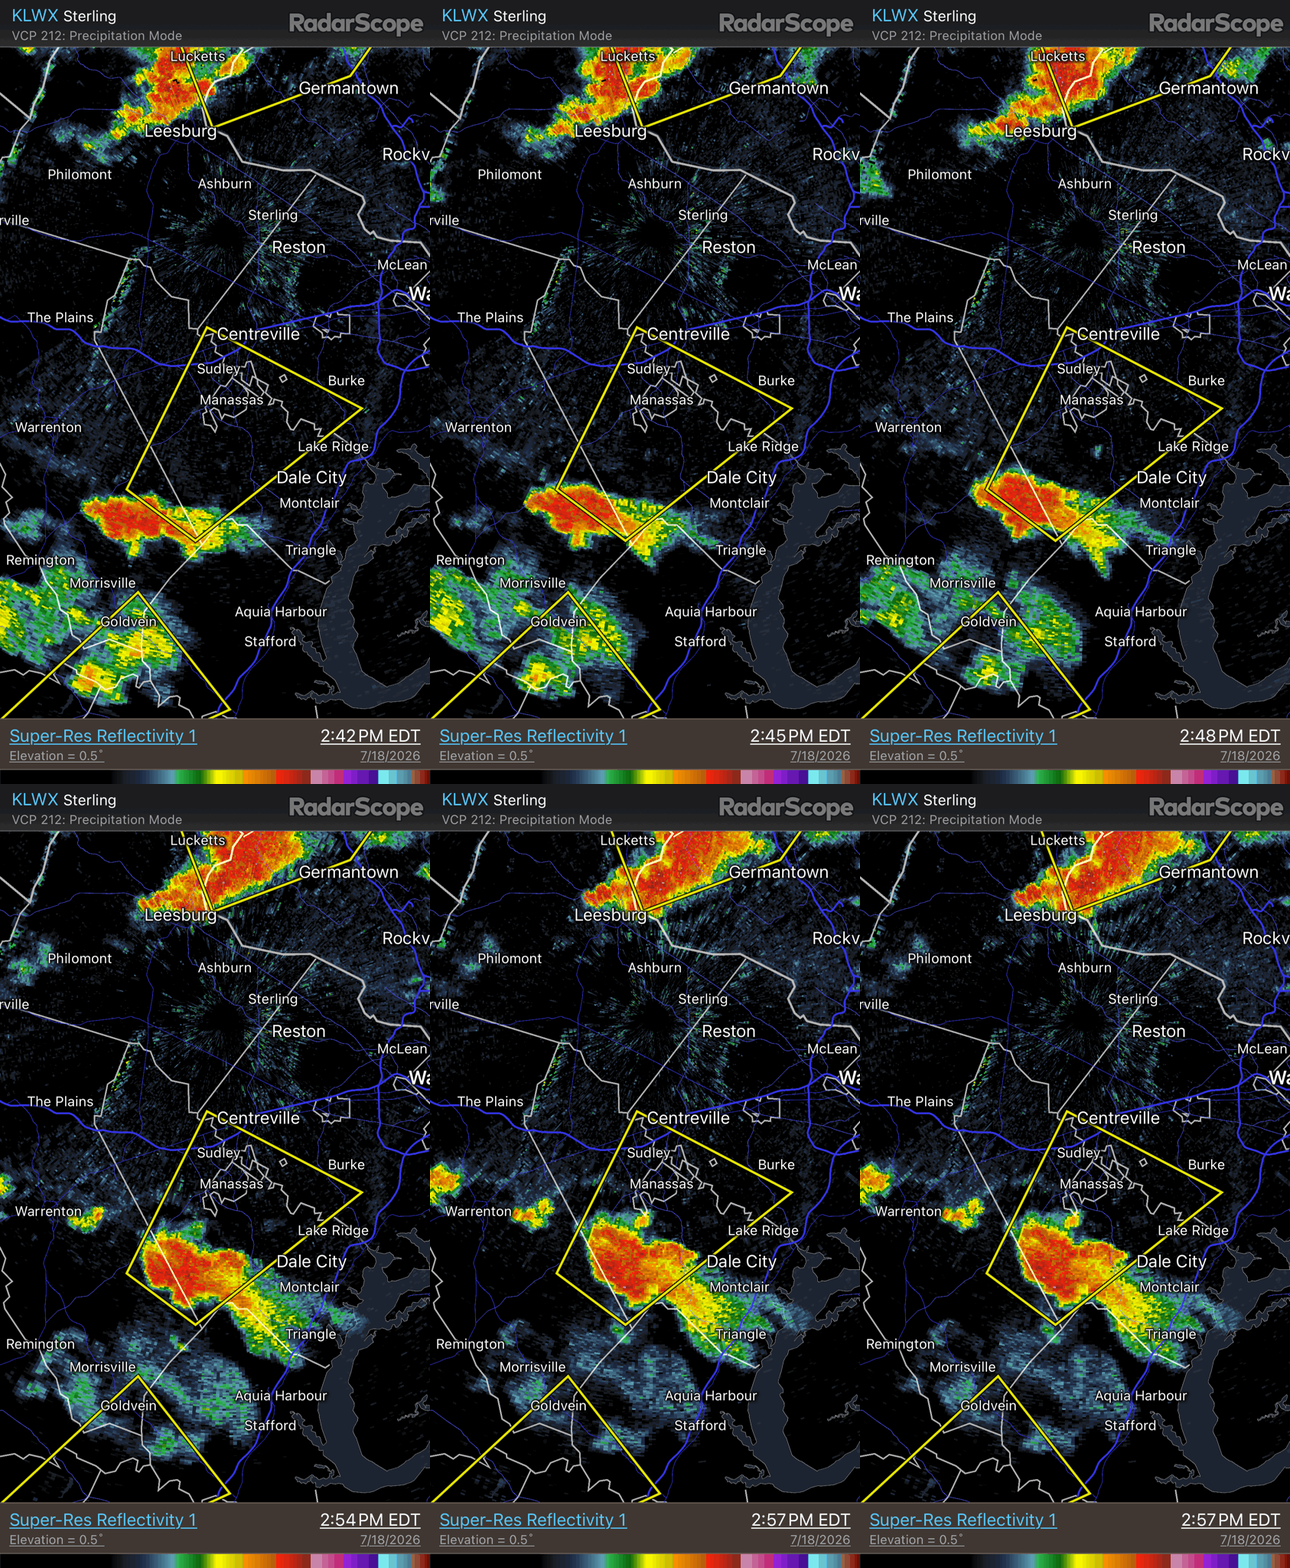
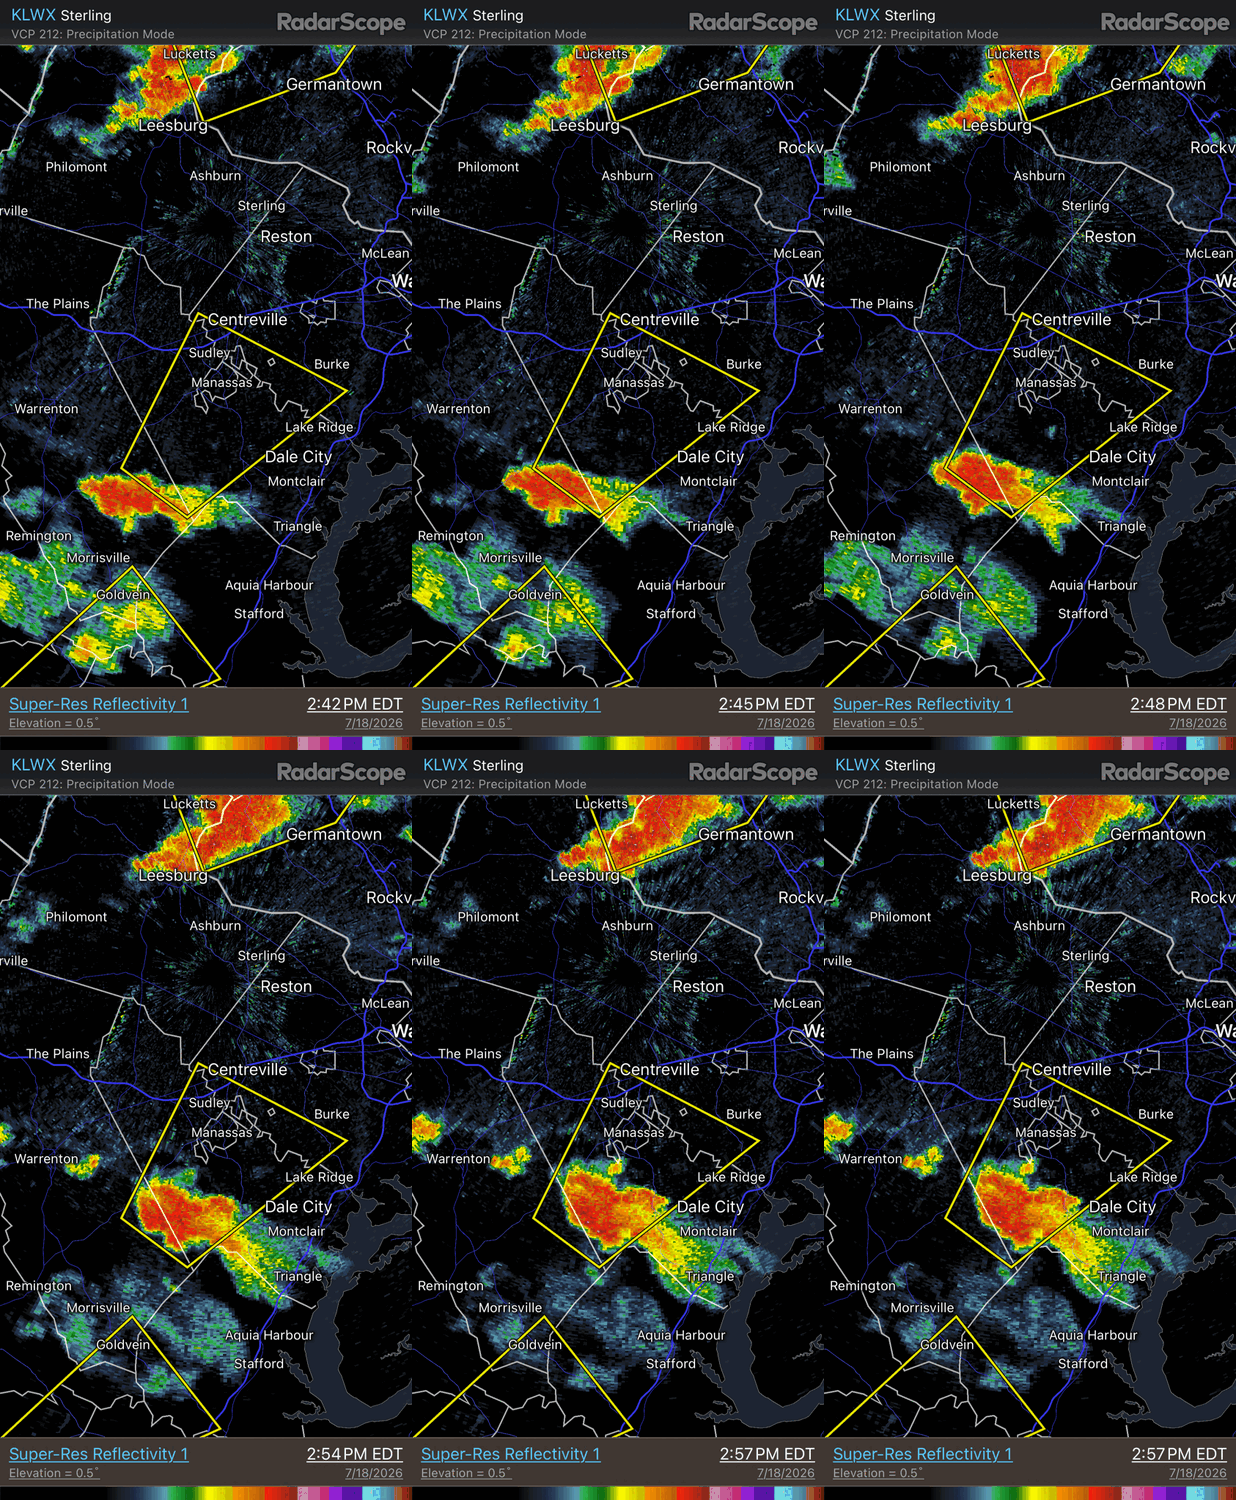
You had this left mover (anticyclonic supercell) near Manassas earlier. You do not even have to look at the velocity to know this. The storm is deviating to the left of the mean flow and it has the flared NW to SE structure w/ the anvil streaming to the SE despite the storm moving NE! When storms rotate, it becomes complex as to the total motion vectors acting on the storm. Anticyclonic supercells rarely produce tors (in the NHEMI), but giant hail and microbursts are just as likely as w/ cyclonic supercells
- 2,604 replies
-
- 4
-
-
- severe
- thunderstorms
- (and 7 more)
-
More days than not when svr wx occurs and it is favorable for supercells, deep layer (0-6 km) shear is good/great, but low-level (0-1 km) is weak. So you can get intense supercells w/ a nasty mesocyclone at mid-levels, but no real signature for rotation or a TDS at low-levels, and thus no tors. I've seen storms like this before in the Plains, You'd think there would be at least be an organized wall cloud for such an intense mesocyclone aloft, but just ragged, disorganized scud. Yet the storm is dumping giant hail and has incredible structure! A rule of thumb I look at for a basic start for a decent tor day is winds at least 30 kt at 925 mb. That gets you your low-level speed shear, which is important. Next, is there any veering of the winds sfc to 850? Low-level directional shear is paramount, esp.for sig tors. Is there a warm front involved? We are taught the cold fronts are the big tstm producers, and they are, but some of best intense tornadic supercells are those that form on or very close to a warm front, and ride along it. Winds locally are backed at the sfc just ahead of a warm front, but veer quickly aloft, so localized shear/helicity can be much higher than the environmental shear/helicity. Typically in most supercells, the mesocyclone (lowest pressure), is at mid-levels, the if conditions are right, the low-levels can organize for solid rotation. The exception is for TC environments. Supercells are often very low-topped, (might not even be 15,000 ft!), and deep layer shear (0-6 km) is not that great, but low-level shear (0-1 km) is excellent, owing to the strongest winds in a TC often found 925 mb to just a few 100 ft above the sfc. So you can get tors in swarms (look at what the remains of Ivan did in VA in Sep 2004), but most are weak, even a higher percentage from their continental counterparts b/c you don't have much CAPE in a TC environment, so updraft acceleration typically can't support strong/intense tors.
- 2,604 replies
-
- 6
-
-

-
- severe
- thunderstorms
- (and 7 more)
-
And memorable is relative and location specific. Short distances when it comes to tstms can be huge. Ever happen to get a storm that just maxes out over your location w/ crazy CGs so close and relentless for like 5 min, and you are ducking for cover even indoors b/c the thunder so atypically loud and you are literally hearing electrical click/pops before or during every strike? And then after it is like, "whoa, best ever!" But is a very localized experience, esp. when it comes to close lightning strikes and how loud the thunder is. Still, when it happens, it is awesome! Gets the adrenaline pumping! I can never get enough of such experiences. Give me tons of LTG!
- 2,604 replies
-
- 2
-
-
- severe
- thunderstorms
- (and 7 more)
-
Storm coverage was better than fcst than either the HRRR or RRFS had ydy. Some supercell structures as well, but they had tough time sustaining for very long. Looking at the radar loop, things got messy very quickly w/ storms moving in various directions due to outflow and rotation, colliding w/ each other. This probably limited the svr wx b/c no one storm could sustain for long, so we got a lot of pulse svr storms, despite the decent wind shear and a lot of CAPE. Maybe if the smoke hung around thicker longer, that would have meant less storms, but any storm would have had a better chance to sustain and rotate? The balance when it comes to the mesoscale is tricky. Small differences can be huge as to storm mode, coverage, and severity, often you don't know it until it is happening. This unknown factor has it appeal. We are still "surprised" at times (June 5, 2024 being among the best recent example), and things can look exactly alike on paper for a setup on two days, but what actually happens as to sensible wx can be a lot different. You still get tstms and svr wx, but it goes far beyond that. Will the storms train/backbuild? How intense (frequency) will the CGs be? (that varies a lot it seems). Discrete cells, a SQLN, or clusters? And who exactly will get crushed? So localized in many cases!
- 2,604 replies
-
- 2
-
-
- severe
- thunderstorms
- (and 7 more)
-
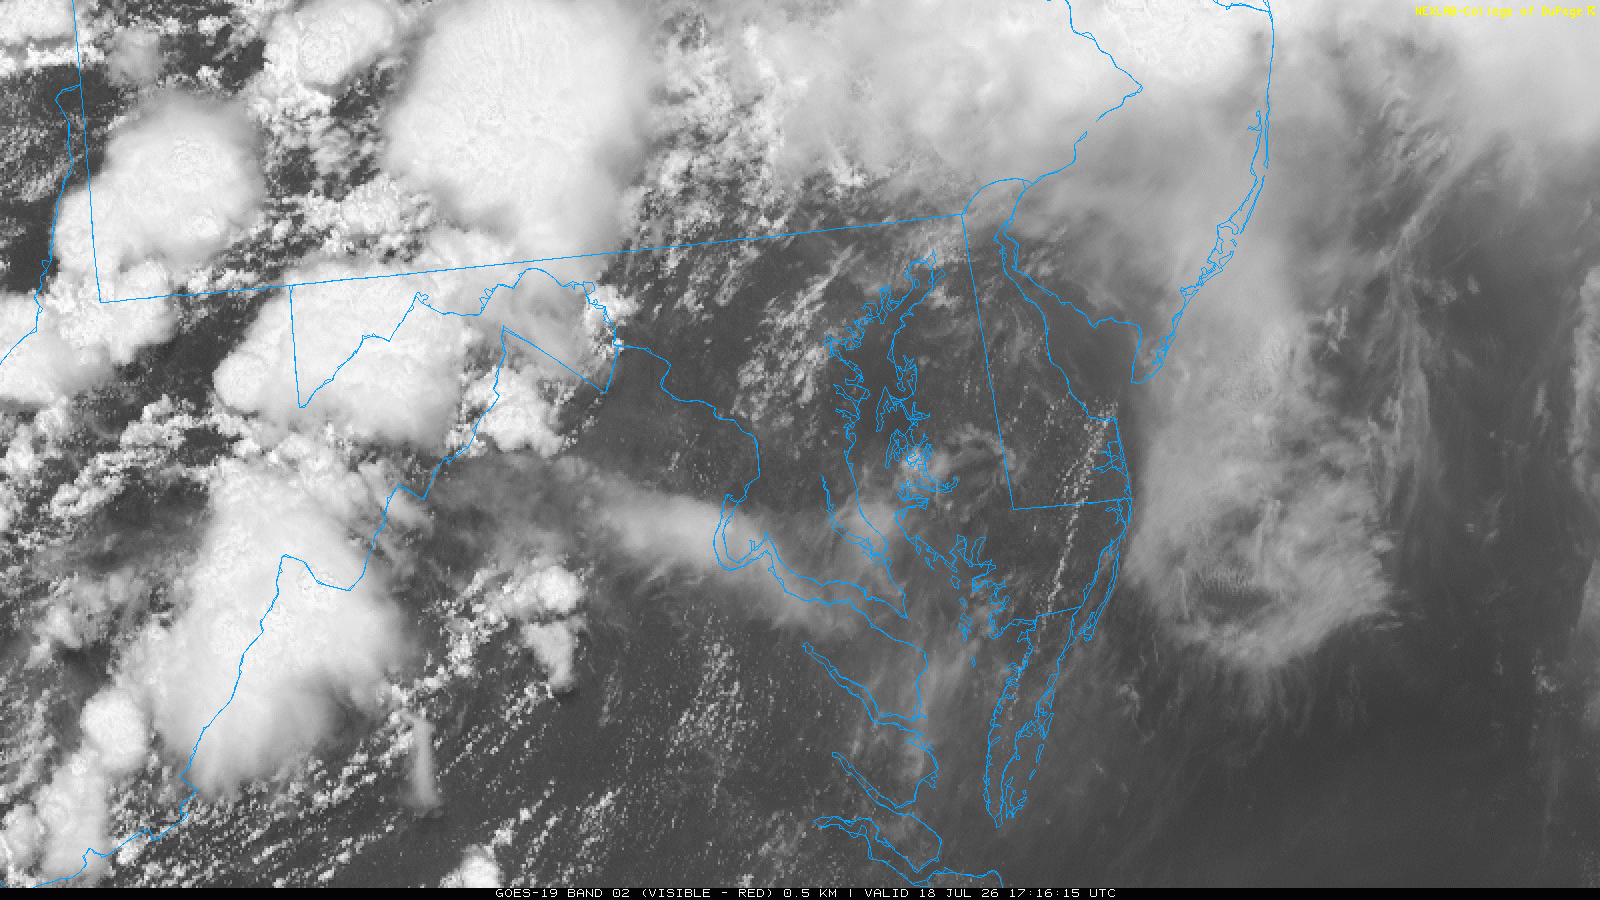
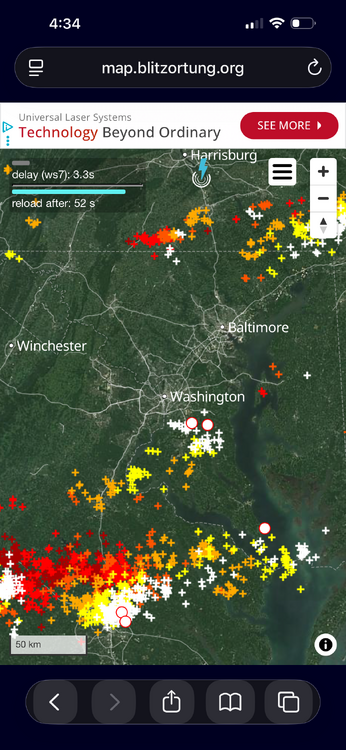
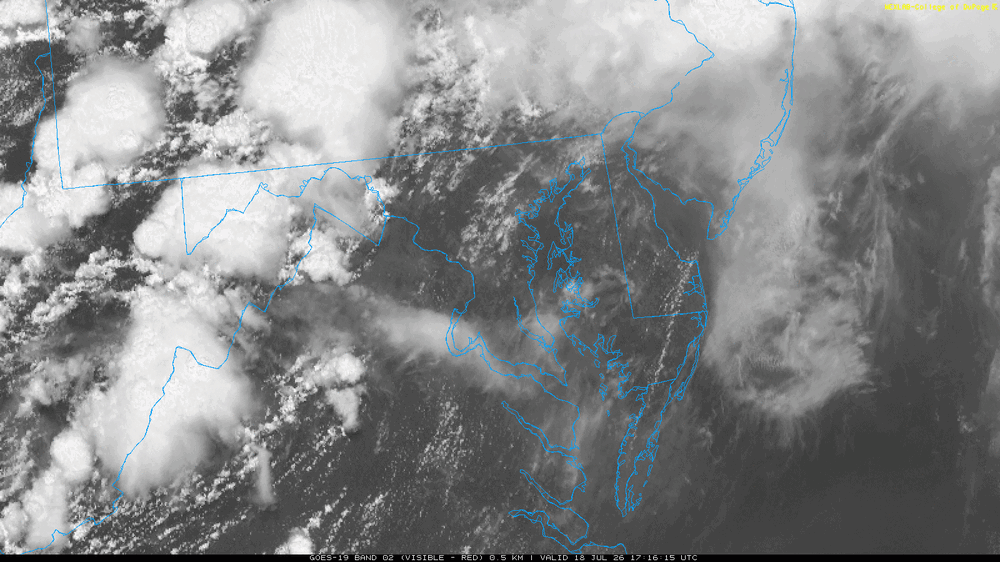
I attached the VIS image at 1716z (13:15 EDT on the image is 1:15pm EDT, right?) Was this CG verified? Sometimes isolated strikes are misplotted when there is a lot of activity. No anvil overhead or close to Damascus, but +CGs has been known shoot out laterally up to 10 mi from a CB. And when a storm, esp. a supercell, has a thick anvil streaming well downwind (can be well over 100 mi when winds aloft are strong), you can get CGs out of the anvil 50+ miles away. Farthest I have seen reported and verified is 90 mi from the parent cell core out of the anvil (storm near Enid OK and strikes far NW OKC)!
- 2,604 replies
-
- 1
-
-
- severe
- thunderstorms
- (and 7 more)