ORH_wxman
-
Posts
93,110 -
Joined
-
Last visited
Content Type
Profiles
Blogs
Forums
American Weather
Media Demo
Store
Gallery
Everything posted by ORH_wxman
-
Playing on Tuesday for the first time this year. Only played once last year too. Either playing Juniper Hills (Northborough) or Shining Rock (Northbridge)
-
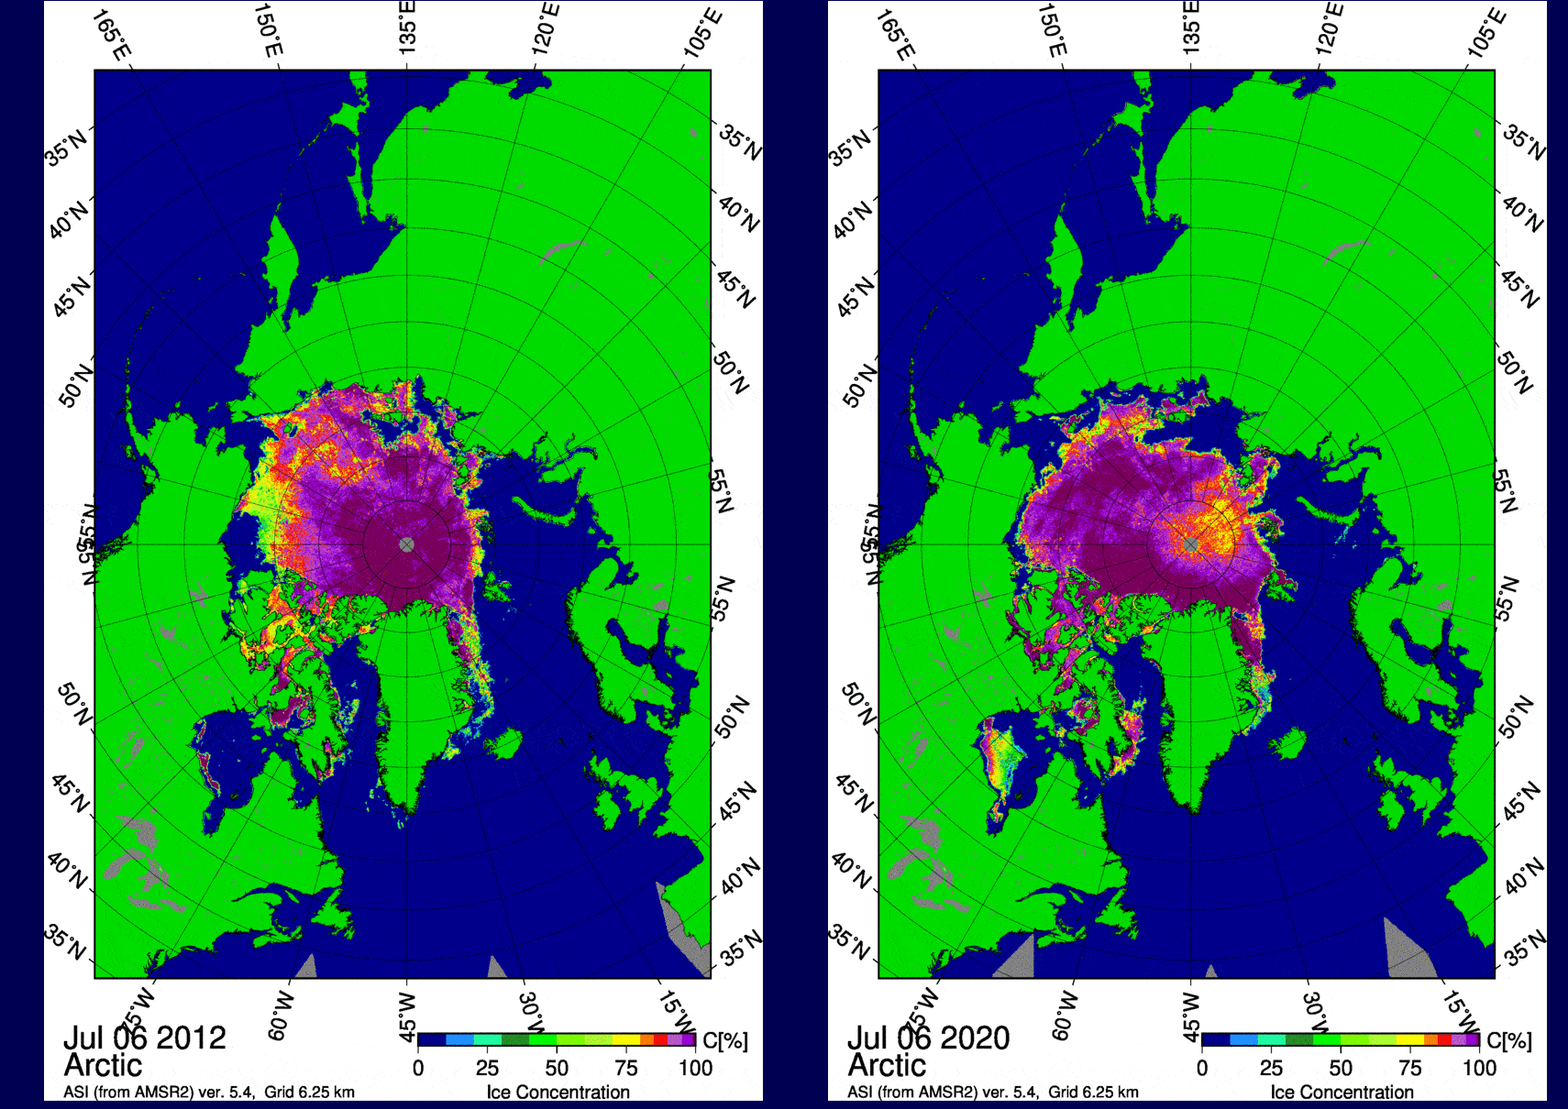
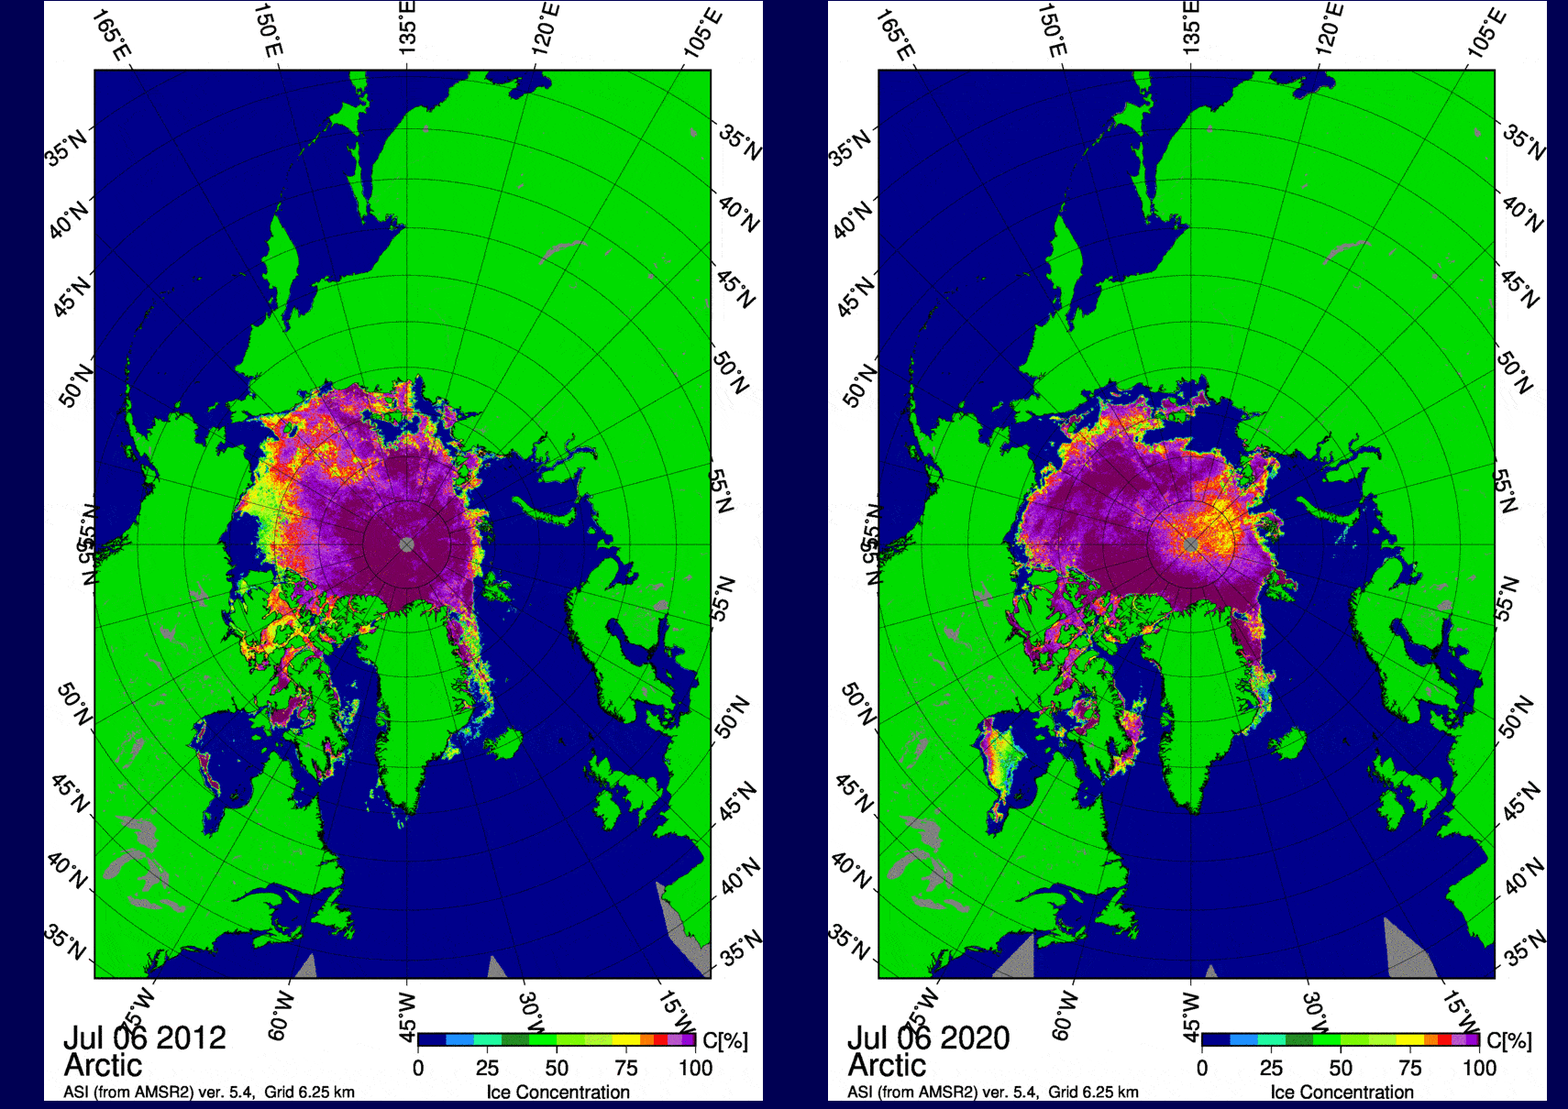
I think we'll want to see a big CAA/Baffin or greenland high at some point to have a legit chance. The ice in the Beaufort/CAA is lagging 2012 significantly and the high rotting on the Asian side of the CAB is keeping the ice flowing toward the Beaufort. The Laptev and adjacent part of ESS is trying to make up for it, but I don't trust counting on huge losses close to the pole as we get into August....2012 had an amazing advancement of open water via the Beaufort/Chukchi/ESS sector.
-
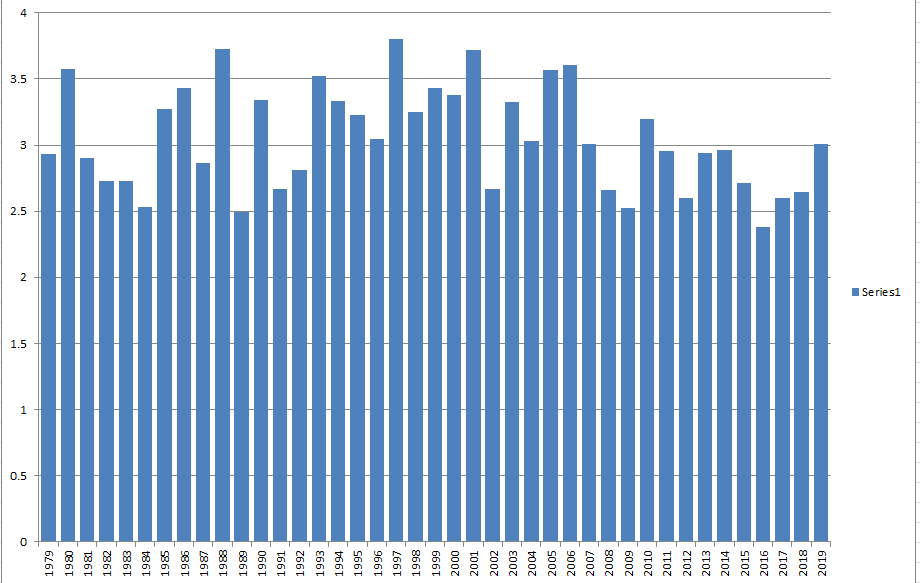
We have the final June numbers in....here's the breakdown of what the minimum in 2020 would be if we followed the same path as every other year: So if we followed the same path that 2019 followed after 6/30, we would finish at 3 million sq km of sea ice area. The post-2007 average path followed is 2.78 million sq km which is what I will use as my baseline. However, there are two factors that will cause me to lower this baseline a bit. First, is that we had a 340k(!!) loss on 7/1....and second, we have a very hostile pattern for the ice. We're currently into a nuclear dipole pattern which would continue to assault the ice for the next week. This will help increase melting and melt ponds while the sun angle is still pretty high in the arctic. Normally, I would put the chances of passing 2012's minimum of 2.228 million sq km at close to 0% based simply on the chart above. But I'll give it an outside shot of happening this year given the current pattern and the huge loss on 7/1. My prediction will be for minimum sea ice area in 2020 is 2.5 million sq km +/- 300k. A minimum of 2.5 million sq km would be 3rd lowest. The top two are 2012 (2.228) and 2016 (2.463). Sea ice extent is a little more fickle since it can depend on compaction vs area which is very straight forward. But for the minimum daily NSIDC sea ice extent, I'll go with 3.8 million sq km +/- 500k. I use larger error bars on the extent due to the much higher standard deviation.
-
We've slowed down recently from the reverse dipole.....2020 now trails 2019, 2012, 2010, and 2007. Though not by huge amounts, so a top 3 melt season is still very much possible. We'll see if the area losses pick back up as the reverse dipole weakens.
-
Massive losses in area from the dipole pattern that just happened.....we now only trail 2012 for lowest area on this date. 2007 and 2010 (and to a lesser extent 2016 and 2019) lose huge area though over the next week, so the question is whether we can stay in the top 3 or top 5 as the weather goes to a reverse dipole over the arctic basin.
-
Time to bump the sea ice tracking for 2020....we're coming off last year's top 3 finish for both area (3rd lowest) and extent (2nd lowest). 2020 is off to a slower start than 2019 was, so it will need to catch up some more to get into contention. 2020 started off fast in May with extensive meltponding (most on record), but that trend reversed near the end of the month and early June when extensive refreezing of melt ponds caused the area to stall. We've been falling faster again recently. For those who follow this thread regularly, you know I like to track NSIDC area in late June because it is the most accurate predictor of minimum area/extent later in the season. Here is where we currently stand on area vs other years (i.e. 2019 had 250k less area than this year on this date) 2019: -250k 2018: +300k 2017: +230k 2016: -150k 2015: +90k 2014: +340k 2013: +390k 2012: -600k 2011: +120k 2010: +150k 2009: +860k 2008: +410k 2007: +10k As you can see, we're running somewhat low in the post-2007 world, but not as low as several years. You'll also note that some years like 2011 which finished very low were not standing out yet. There is still time for things to change in either direction which is why I usually start tracking closely in mid-June through the end of the month when I make a prediction based on the month-end values. There is currently a hostile pattern over the arctic for the ice which is aiding some big numbers right now, but the forecast looks to go toward a reverse dipole pattern by the end of the week and stay there all of the next week if ensemble guidance is correct....so that would likely slow down the losses. I'll update this tracker every few days until month-end....probably doing daily updates in a final few days of the month.
-
I’ve played both Putnam and Thompson but it’s been a while. Good courses. One of them was pretty long...I think Putnam? I only got out once last year but somehow shot 83.
-
May 8-9 mid-spring rain, snow, cold, wind obs
ORH_wxman replied to CT Valley Snowman's topic in New England
It’s an annual occurrence according to Cranky. -
May 8-9 mid-spring rain, snow, cold, wind obs
ORH_wxman replied to CT Valley Snowman's topic in New England
He said we only got highs in the 40s last May so it’s NBD. Im guessing he completely ignored the low temps. -
May 8-9 mid-spring rain, snow, cold, wind obs
ORH_wxman replied to CT Valley Snowman's topic in New England
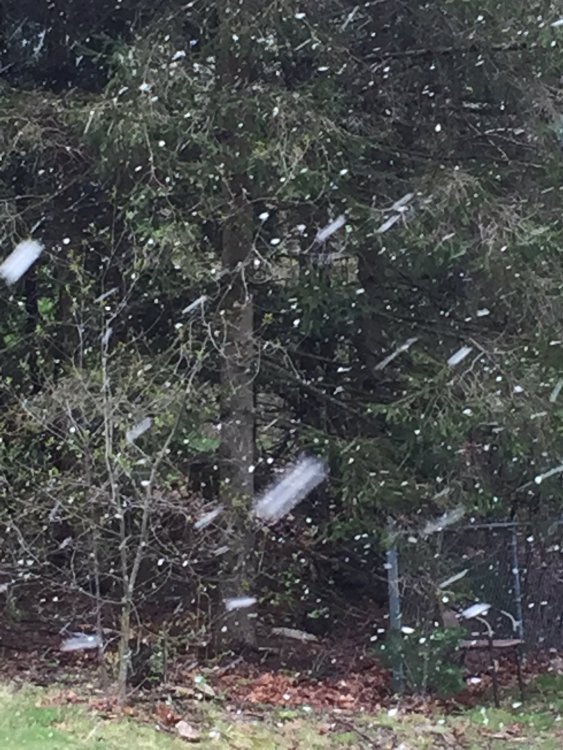
This feels like late November or early December with this airmass and popcorn squalls under a ULL. Yet we’re 6 weeks from the solstice. -
May 8-9 mid-spring rain, snow, cold, wind obs
ORH_wxman replied to CT Valley Snowman's topic in New England
Chris I think that was this one...incoming for ORH now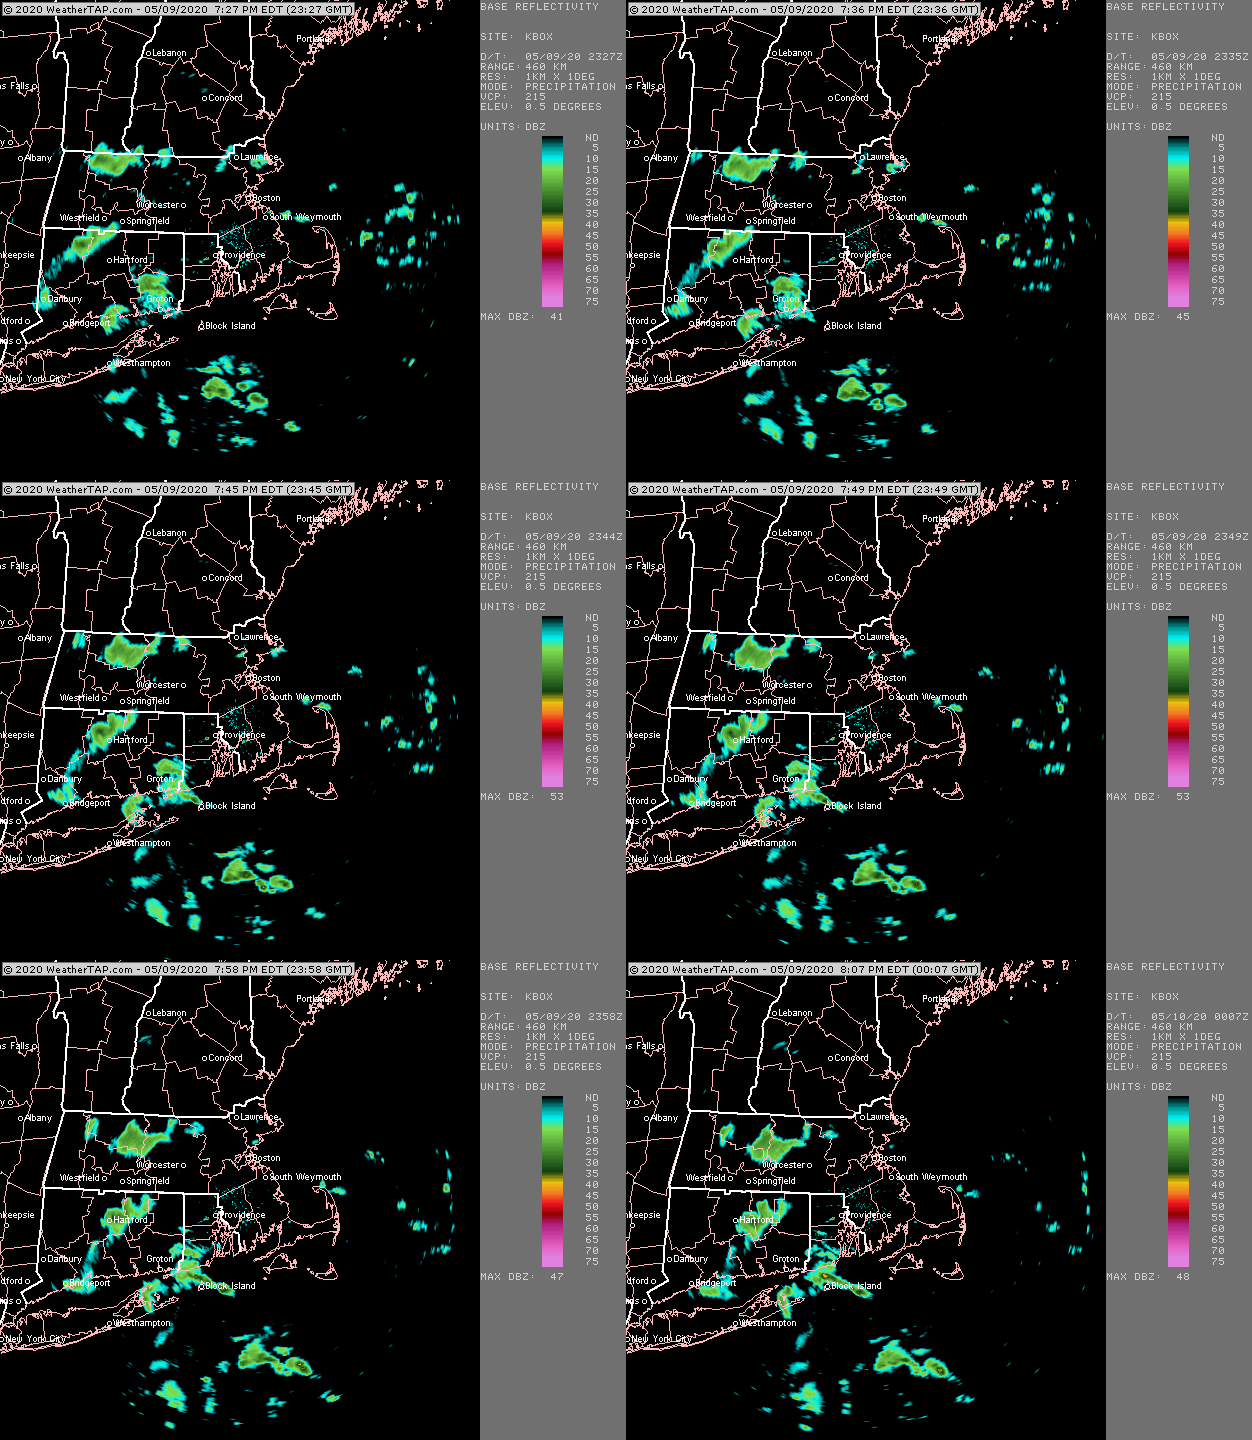
-
May 8-9 mid-spring rain, snow, cold, wind obs
ORH_wxman replied to CT Valley Snowman's topic in New England
It’s really just the annual May cold snap. -
May 8-9 mid-spring rain, snow, cold, wind obs
ORH_wxman replied to CT Valley Snowman's topic in New England
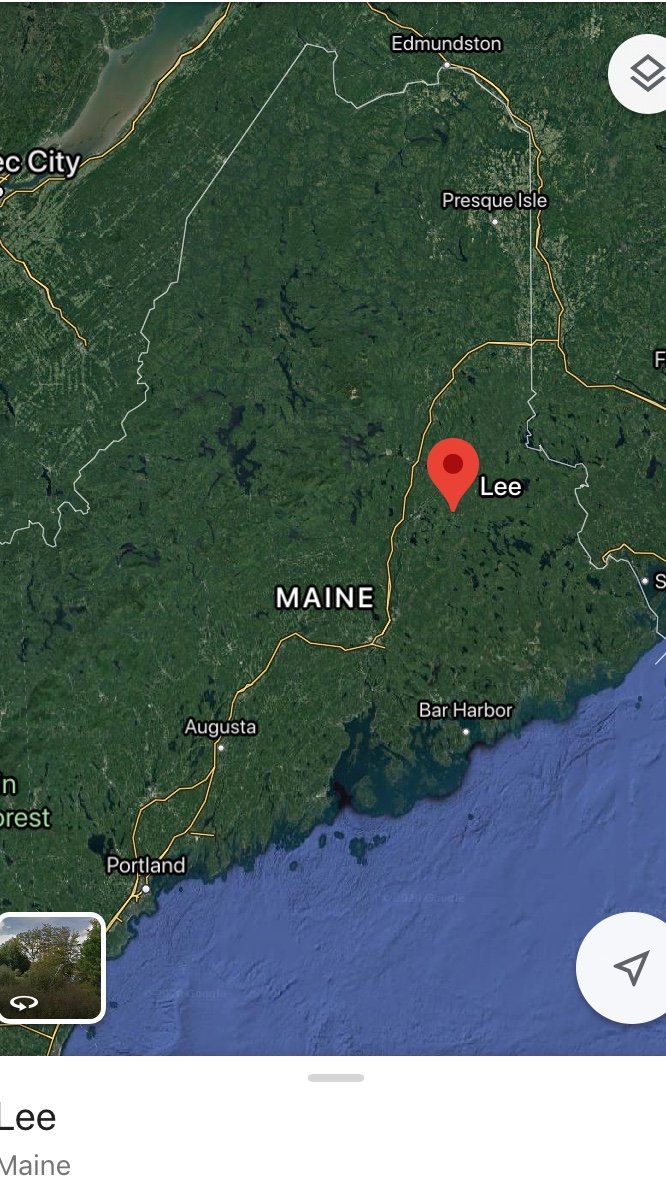
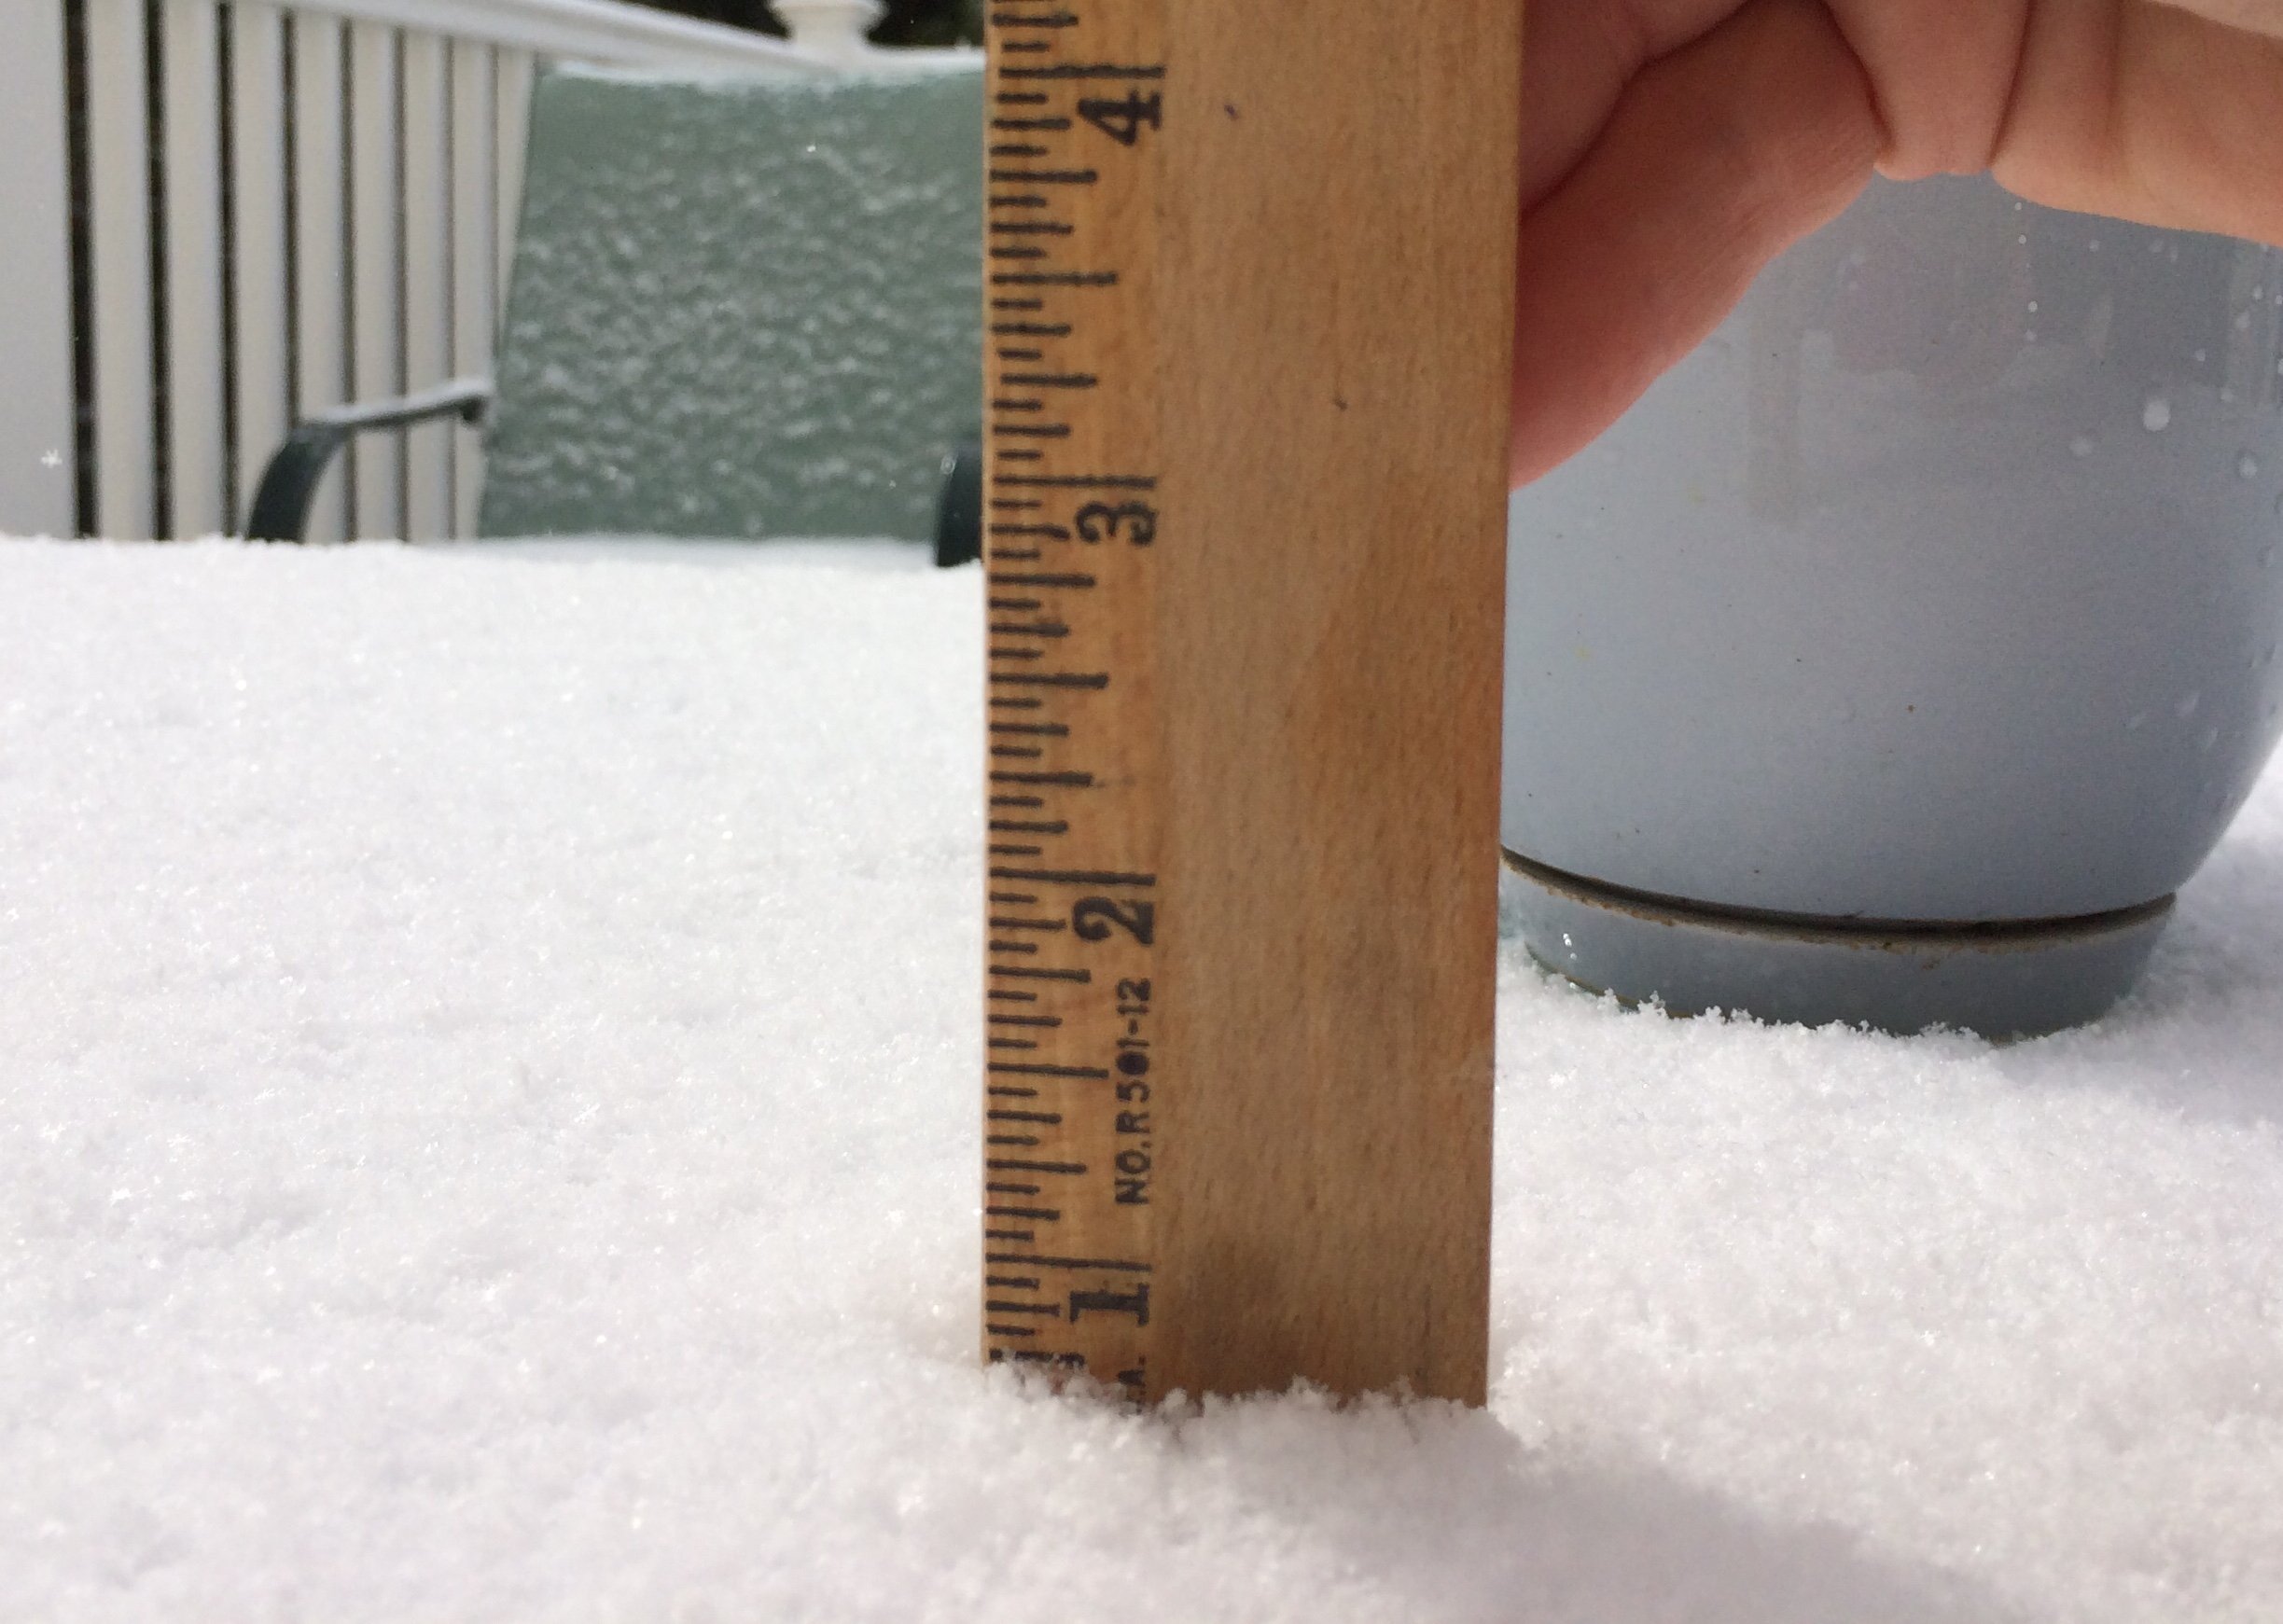
Wow that’s awesome. It’s not even up by CAR and it’s mostly under 500 feet. For those wondering where Lee Maine is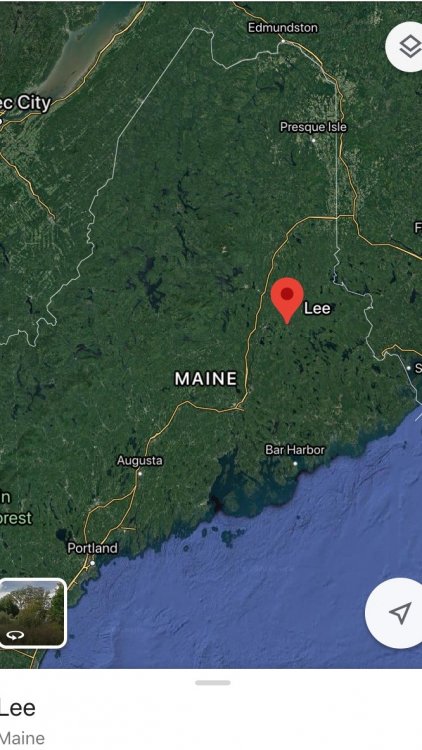
-
May 8-9 mid-spring rain, snow, cold, wind obs
ORH_wxman replied to CT Valley Snowman's topic in New England
Nah, you had a high of 45 last year on east winds with sheet drizzle. It’s the same thing. Annual occurrence. -
May 8-9 mid-spring rain, snow, cold, wind obs
ORH_wxman replied to CT Valley Snowman's topic in New England
ORH sitting at 37 /15 at peak insolation in 2nd week of May. -
May 8-9 mid-spring rain, snow, cold, wind obs
ORH_wxman replied to CT Valley Snowman's topic in New England
Maybe he shops at whole paycheck? I’ve seen some hefty bills there. But yeah, I’ve been going every 7-10 days and it’s comes out to around 150-200. You can tack on another 25 for a produce pickup we do at a food distributor every week. Those are actually pretty cool...they have all this extra inventory they usually ship to restaurants but obviously aren’t doing much of that right now. So you can order boxes for 25 bucks that have a ton of produce. Def would cost 40-50 at a supermarket. -
May 8-9 mid-spring rain, snow, cold, wind obs
ORH_wxman replied to CT Valley Snowman's topic in New England
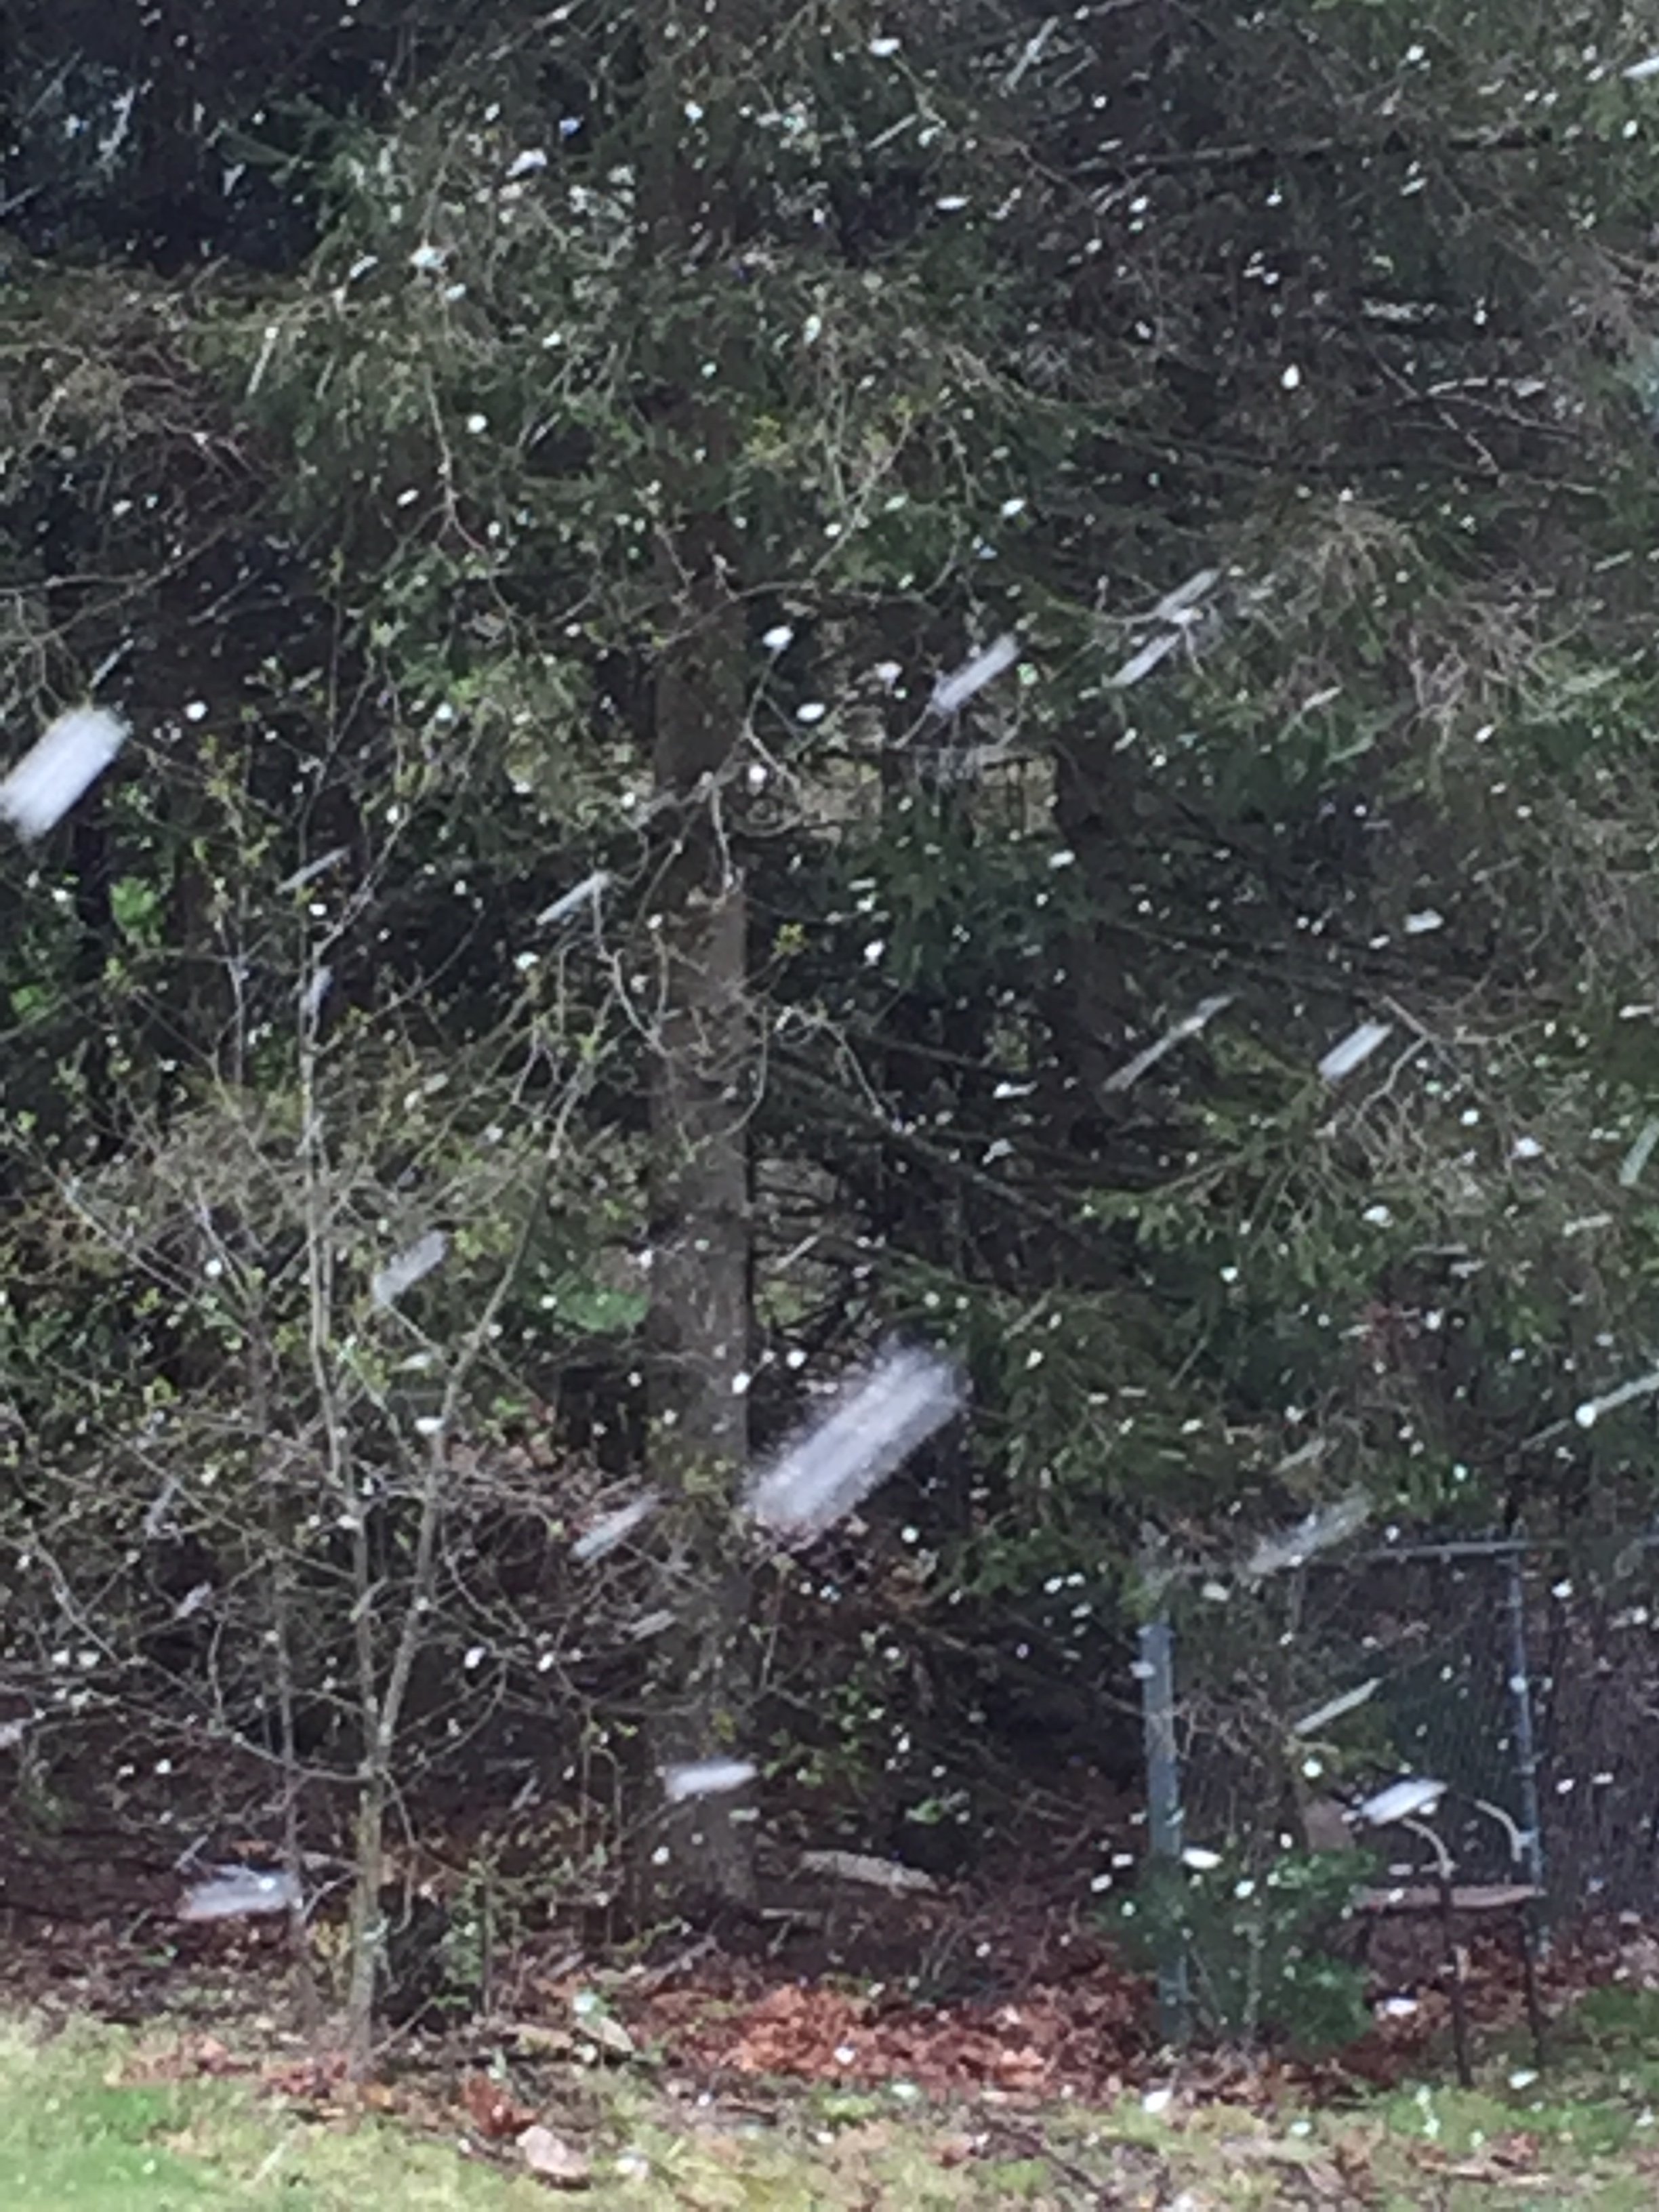
Just had some flurries move through. Didn’t matter that the temp was 40F. Straight flakes falling into that faux sfc warmth. -
May 8-9 mid-spring rain, snow, cold, wind obs
ORH_wxman replied to CT Valley Snowman's topic in New England
Yeah he’s trying to move the goalposts based on some moron media members playing up a historic snowstorm angle. He’s totally ignoring the airmass part now. He will likely try and claim that when it hits mid-40s for a high, that the same thing happened last year even though it was onshore flow and sheet drizzle (and will ignore the low temps). -
May 8-9 mid-spring rain, snow, cold, wind obs
ORH_wxman replied to CT Valley Snowman's topic in New England
All in the last hour -
May 8-9 mid-spring rain, snow, cold, wind obs
ORH_wxman replied to CT Valley Snowman's topic in New England
Measurable on winter hill from the heavy snow last hour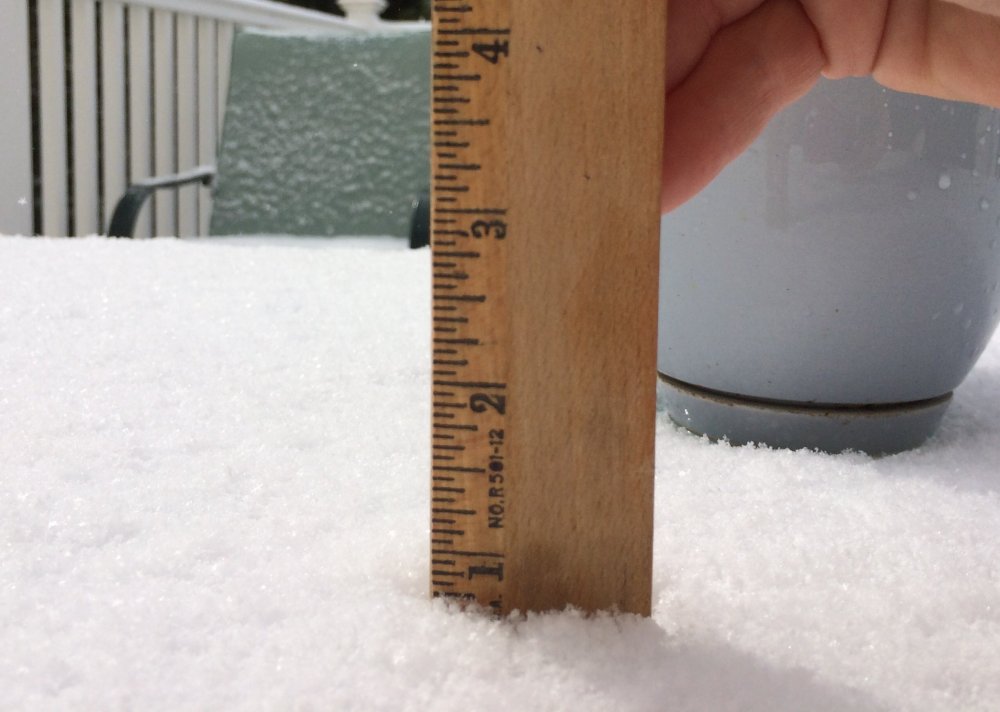
-
May 8-9 mid-spring rain, snow, cold, wind obs
ORH_wxman replied to CT Valley Snowman's topic in New England
Typical May observation. Not sure what all the fuss is about KORH 091248Z 29022G32KT 1/4SM R11/2400V4000FT +SN FZFG VV009 M01/M03 A2953 RMK AO2 PK WND 29032/1247 P0000 -
May 8-9 mid-spring rain, snow, cold, wind obs
ORH_wxman replied to CT Valley Snowman's topic in New England
We tried to tell him -
May 8-9 mid-spring rain, snow, cold, wind obs
ORH_wxman replied to CT Valley Snowman's topic in New England
Just your normal below freezing snow ob at ORH. Typical Annual May occurrence. -
May 8-9 mid-spring rain, snow, cold, wind obs
ORH_wxman replied to CT Valley Snowman's topic in New England
KORH 091238Z 28016G25KT 1/2SM R11/4000V5000FT SN FZFG VV012 M01/M03 A2953 RMK AO2 PK WND 28027/1211 P0000 T10061028 -
May 8-9 mid-spring rain, snow, cold, wind obs
ORH_wxman replied to CT Valley Snowman's topic in New England
Ripping fatties in this band