


ORH_wxman
-
Posts
93,110 -
Joined
-
Last visited
Content Type
Profiles
Blogs
Forums
American Weather
Media Demo
Store
Gallery
Everything posted by ORH_wxman
-
May 8-9 mid-spring rain, snow, cold, wind obs
ORH_wxman replied to CT Valley Snowman's topic in New England
Too bad this CCB couldn’t wrap up like we saw on some runs a couple days ago. Legit cold to tap. -
May 8-9 mid-spring rain, snow, cold, wind obs
ORH_wxman replied to CT Valley Snowman's topic in New England
Snowing here. Nice. Lol -
Too early to get a good handle on the low. We need to wait until mid/late June. Jaxa (and Area) at this point in 2012 was higher than 1996 (the highest min year on record).
-
One of the all time greats in interior MA. Had around 27” in ORH but officially I think the airport reported 22”...but that was during their ASOS outage snow disaster years...their final report came like 12 hours before the snow ended. Lol. Despite that, it was actually a mild underperformer if that’s possible. Mets were going 3 feet plus here. Still, can’t complain about a storm that breaks 2 feet.
-
DMI volume is a bit suspect....I'd prob use PIOMAS and then definitely Cryosat2 when that updates more fully later this spring. PIOMAS has volume currently 5th lowest. Still low, but not dead last like DMI. 2017 is pretty far alone in last place at this point.
-
There's plenty of peer review research to read that will argue humans aren't responsible for the increase in CO2, but in reading them, you'll note that they don't hold up under scrutiny as time passes and other papers rebut them and they aren't able to counter those rebuttals. So they are fewer and fewer these days. I would suggest reading literature across all spectrums and not try and muck up the thread by insisting you know more than these papers.
-
They didn't attempt to quantify the non-climate factors though which was a bit frustrating in reading the study. I just finished reading it and they sort of just decide that VPD fits well enough that it is dominant. That might be true but it would have been nice to try and isolate it from the non-climate factors which they admitted is something they weren't doing in the paper...so we could see numerically how dominant it actually is.
-
It's actually not clear at all for "the current event" given that the autumn attribution is extremely weak to non-existent. It seems the trends are stronger for summer. From the most recent paper you linked: This is the problem with some of the attribution studies that are in a shorter time span. Esp starting in the middle 20th century.
-
I'm not going to go down the political rabbit hole of discussing capitalism vs socialism in this forum but the nuclear energy part is spot on. It is hard to take any person or any group seriously that say they believe climate change is a dire emergency and also will not consider nuclear power.
-
Most politicians aren't really that serious about climate change anyway. Even the ones who claim they are. There are some exceptions of course. But we see something like the Paris accord being touted by politicians as this crucial thing when in reality it is non-binding and even if it wasn't, the commitments through the end of the accord in 2030 would do very little to change the longer term outcome of climate change...especially if one believes that we are closer to the "worst case" scenarios of higher climate sensitivity. The difference is something like a couple tenths of a degree Celsius or even less. If you are generous and make a bunch of assumptions like everyone continues to ramp up their cuts beyond 2030 like I've seen done in some analysis, then you can maybe add several more tenths. But that's a big assumption. It comes across as something for politicians to pat eachother on that back about to make them feel as if they are tackling the problem when they really aren't. This probably isn't the thread for such discussion, but a far more efficient way to attack the issue would be to invest most of the money into R&D for green energy.
-
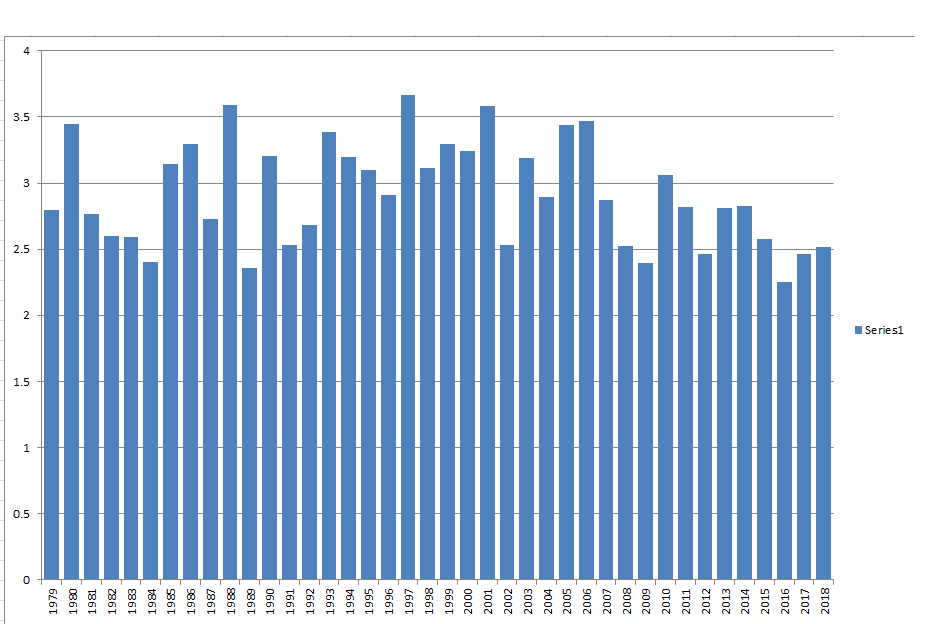
I should update this in that the NSIDC minimum extent dropped a bit further to 4.09 million sq km....still outside my range but a bit closer than the 4.23 initial value I posted above. Doesn't change the analysis above in any material way. The area minimum hasn't been matched again and will remain at 2.87....we're now over 300k sq km above the 9/4 area min so that won't be caught again. We'll see if 4.09 million sq km is the final minimum extent....still a chance it could fall back below that from the current 4.17 million sq km value, but it's getting very late now to significant drops.
-
Time to verify this prediction based on the data at the end of June. Assuming we have reached the minimums for both area and extent on 9/4 (looking more and more likely), then both of these fell outside my range, albeit not by much. The final minimum area was 2.87 million sq km and the final minimum extent was 4.23 million sq km. These are both NSIDC numbers. The predictions were looking excellent through mid-August until we had an unprecedented slowdown in late August that has leaked into early September. So I ended up making predictions that were slightly too low compared to reality. I was correct in identifying the very strong chance of a top 3 finish (and also being skeptical of challenging the top spot), but I really needed to bump my middle numbers in the range up about 100-200k. Overall, I think this was a decent prediction compared to what we see on the Arctic Sea Ice outlook that gets published by NSIDC....but I am still disappointed I could not get it within my range. It might be that 200k error bars are just too small to consistently hit on predictions when it comes to sea ice. Using 400k error bars would have this method hit every year I've done it with the exception of 2016. But I will probably try to continue to use 200k error bars....and maybe see where the method can be improved.
-
The daily area did start falling again....but it was only 18k. Down to 2.981 million sq km....the min so far was 2.877 on August 24th.
-
That's the 5-day mean, the daily area actually increased 20k to 2.999 million sq km. Not that the area matters much anymore for ranking purposes...this season will rank 3rd lowest for area behind 2012 and 2016.
-
There is no way the min would be that early.
-
I was looking at JAXA when I made the comments about extent. I agree NSIDC extent looks a bit less likely to finish 2nd but it wouldn't surprise me either. It only needs to have slightly above average losses...though the shape of the ice pack doesn't look as favorable for losses compared to years like 2016 when there was a lot more vulnerable ice left.
-
Area is very likely to finish in 3rd place given the path of 2016 from here on out. Extent is still looking like 2nd place is the most likely but the recent stall has made 3rd or 4th place more possible than it was a week ago.
-
Melt ponding is supposed to occur more readily on first year ice than multiyear according to the literature but let's say that is flawed analysis....if melt ponding was truly getting harder because first year ice is somehow getting so bad and other factors now contribute more to melting because of this, then we would expect the NSIDC area in late June to significantly over-predict the amount of ice left at the end of the season. We haven't really seen that in recent years....except 2016. But it didn't happen in 2017 or 2018. It doesn't look to happen in 2019 either unless something pretty crazy happens in the next couple weeks. The late June area data (which is a proxy for melt ponds) told us that we had a good chance for 2nd lowest but not a good chance for lower than 2012's record. There's nothing glaring that says that data missed some sort of smoking gun on additional melting.
-
The role of the cyclone in 2012 is overstated imho. The ice was in terrible shape before it hit. I'm not really convinced it added that much to the losses. Maybe a couple hundred thousand sqkm or something. 2012 already had the highest percentage of melt ponds by the end of June suggesting a new record was likely. It was significantly lower on SSMI/S area than other years including 2019...it's the main reason I didn't think we'd set a new record this year despite this being the most favorable melt year in a while. It just didn't quite stack up to 2012's early melt ponding.
-
The NSIDC data I'm using is from their satellite dataset. Specifcally the SSMI/S satellite. Jaxa and U Bremen use the AMSR2 satellite, which is highest resolution of the two. SSMI/S is useful though because it has a pretty homogeneous dataset going back to 1979. IMS uses both satellite and human augmentation of the data based on visual shots of the ice. Here's the FAQ from MASIE/IMS site: https://nsidc.org/data/masie/masie_faq
-
It will be interesting to see if this product stays below 2012....I suspect it will not, but we'll find out in about 2-3 weeks. NSIDC area is now favored to finish 3rd lowest...we're only 90k lower than 2016 now and 2016 loses about 400k in the next week. So this year needs to kick-start again on area loss to stay pace. Extent is still favored to finish 2nd lowest behind 2012 on NSIDC, Ubremen, and Jaxa.
-
2019 ENSO
ORH_wxman replied to AfewUniversesBelowNormal's topic in Weather Forecasting and Discussion
Yep...there was plenty cold over the CONUS, just not for most of the posters in here....pretty classic gradient with SE ridge in the east actually.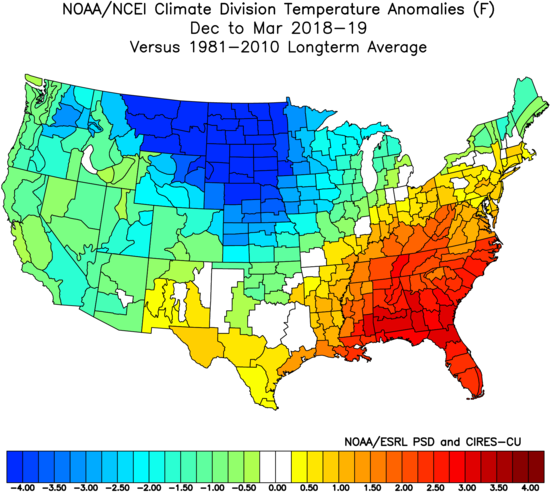
-
Well, it sounds like a subjective analysis then by you on other people's posting behavior. Not sure I can really help other than the below explanation: If you go back through the beginning of this thread and previous Arctic sea ice threads, you'll note that IMS hasn't been used. It's been consistently NSIDC and JAXA...sometimes U bremen and previously Cryosphere Today (now defunct..but they used NSIDC data). I don't know a ton about IMS but my little experience with it from sheer recollection back to the 2009-2013 days is that it seems to lag the other datasets significantly. It will "catch up" to them eventually if it looks like it is deviating on a trend line. That is my guess on what happens this year as well. We won't have to wait long to find out.
-
Here's some sources....the record we discuss isn't supposed to be about what it means longer term. Most of us know the longer term trend is down. But records are interesting to all of us in the weather community. Why do we sit around and track the thermometer at 101F on a hot summer day when the record is 102F? Does it really feel much different from 99F? Of course not, we're just tracking whether the record gets broken or not. FWIW, we've discussed when we think the first total melt out (definition below 1 million sq km of extent) will be in here: https://www.americanwx.com/bb/topic/40881-when-we-will-see-an-ice-free-arctic/ https://www.americanwx.com/bb/topic/46677-when-will-the-2012-arctic-ice-extent-minimum-record-be-broken/?page=3 It does not appear we will set a new record this year based on JAXA, ubremen, and NSIDC. We'll see about the IMS plot you reference but is suspect that will flatten out at some point. https://docs.google.com/viewer?a=v&pid=sites&srcid=ZGVmYXVsdGRvbWFpbnxhcmN0aXNjaGVwaW5ndWlufGd4OjU1OGIwZWI0NGI2ZDI5YTM https://seaice.uni-bremen.de/sea-ice-concentration/ https://ads.nipr.ac.jp/vishop.ver1/vishop-extent.html
-
Area and extent loss have slowed to a crawl the last couple days. We're now behind 2012 by about 300k on extent and 200k on area.
