eduggs
-
Posts
5,951 -
Joined
-
Last visited
Content Type
Profiles
Blogs
Forums
American Weather
Media Demo
Store
Gallery
Everything posted by eduggs
-
Extreme Cold, Snow & Sleet: SECS 1/24 - 1/26
eduggs replied to TriPol's topic in New York City Metro
A day or so I highlighted northern VA as an indicator for how well the models were handling the sleet line. The warmer models surged it to northern VA before 10am while the colder models kept it in southern/central VA. Looks like the warmer models were right so far. I really hope it shifts east and washes out this afternoon. Without looking at the latest model runs I'd gotta assume someone in the mid Hudson Valley could hit 18" today -
Extreme Cold, Snow & Sleet: SECS 1/24 - 1/26
eduggs replied to TriPol's topic in New York City Metro
The mix line is through the the DCA area. The graphics for the colder models (e.g., UKMET) had it well south of there at this time. The snowier models (ECM-AI etc) that showed 10"+ down that way are not likely to verify. Most reports are around 6" or less of pure snow. They should get a few inches of sleet on top, however (which Pivotal claims not to count as snow). -
I hope so. It looks amazing outside right now.
-
Wow off to a fast start! Intense overrunning with lift through a deep layer encompassing the DGZ is magical. A quick switch to heavy rates probably means quick mid-level warming, so let's get outside and enjoy this!
-
Extreme Cold, Snow & Sleet: SECS 1/24 - 1/26
eduggs replied to TriPol's topic in New York City Metro


-
Extreme Cold, Snow & Sleet: SECS 1/24 - 1/26
eduggs replied to TriPol's topic in New York City Metro
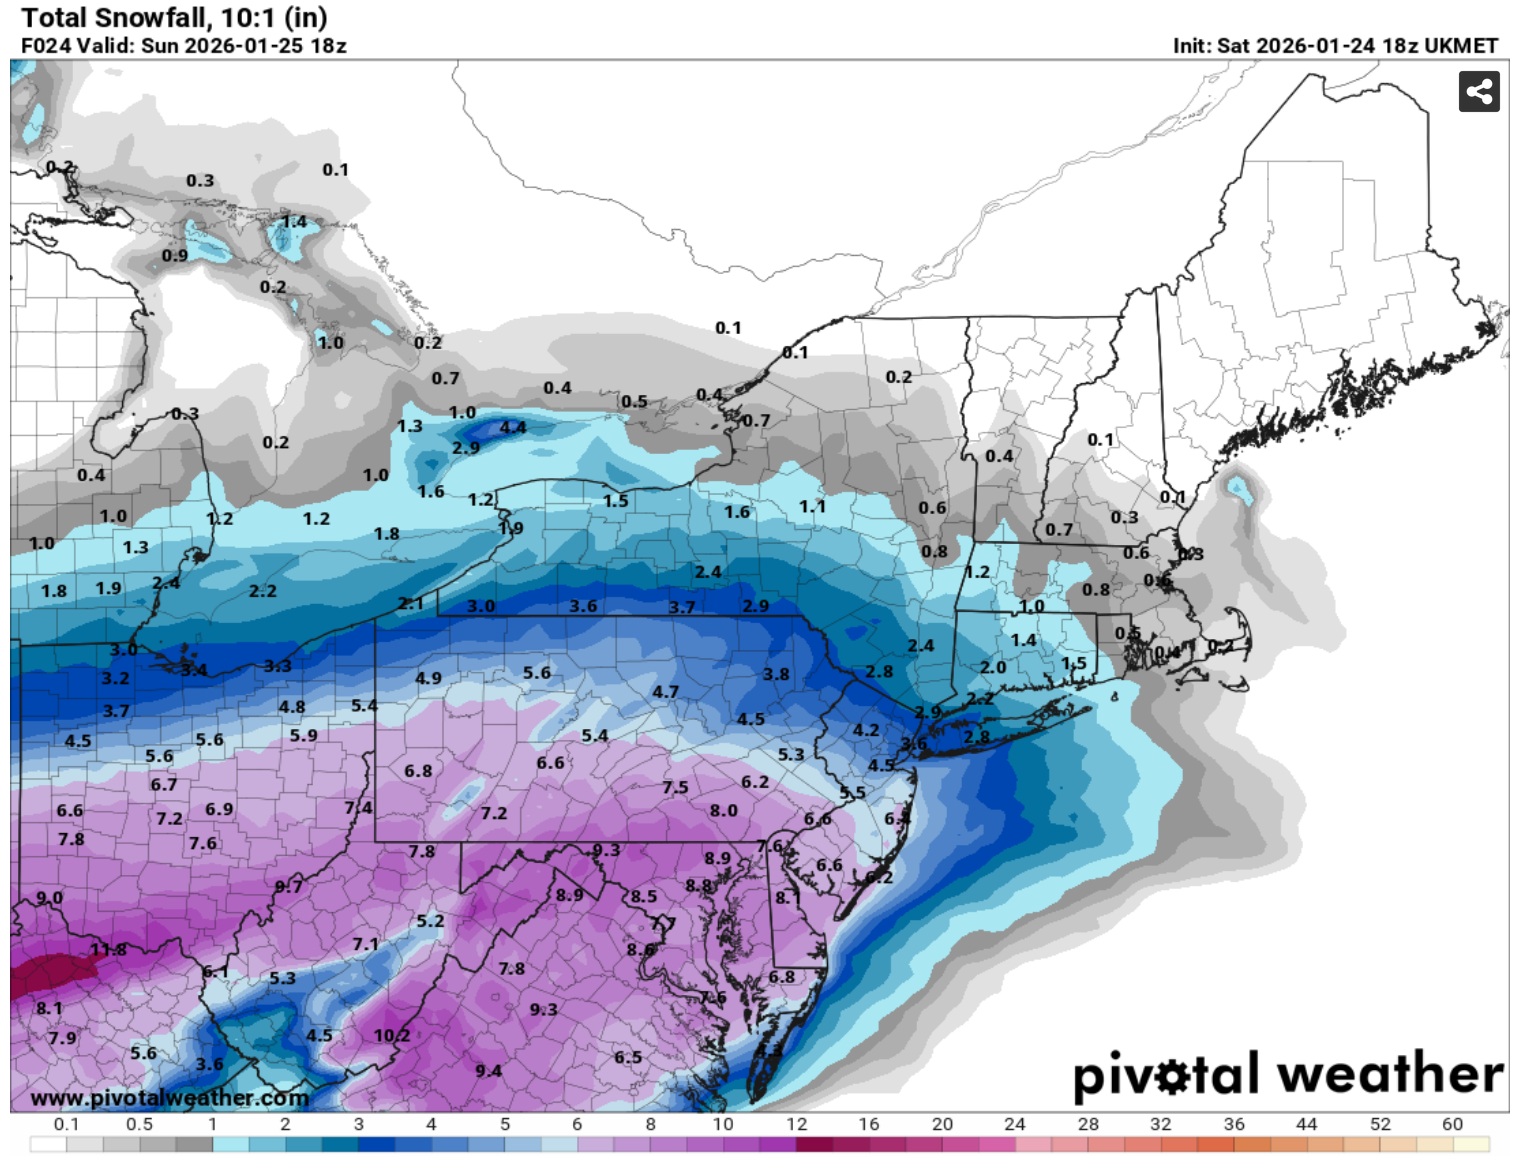
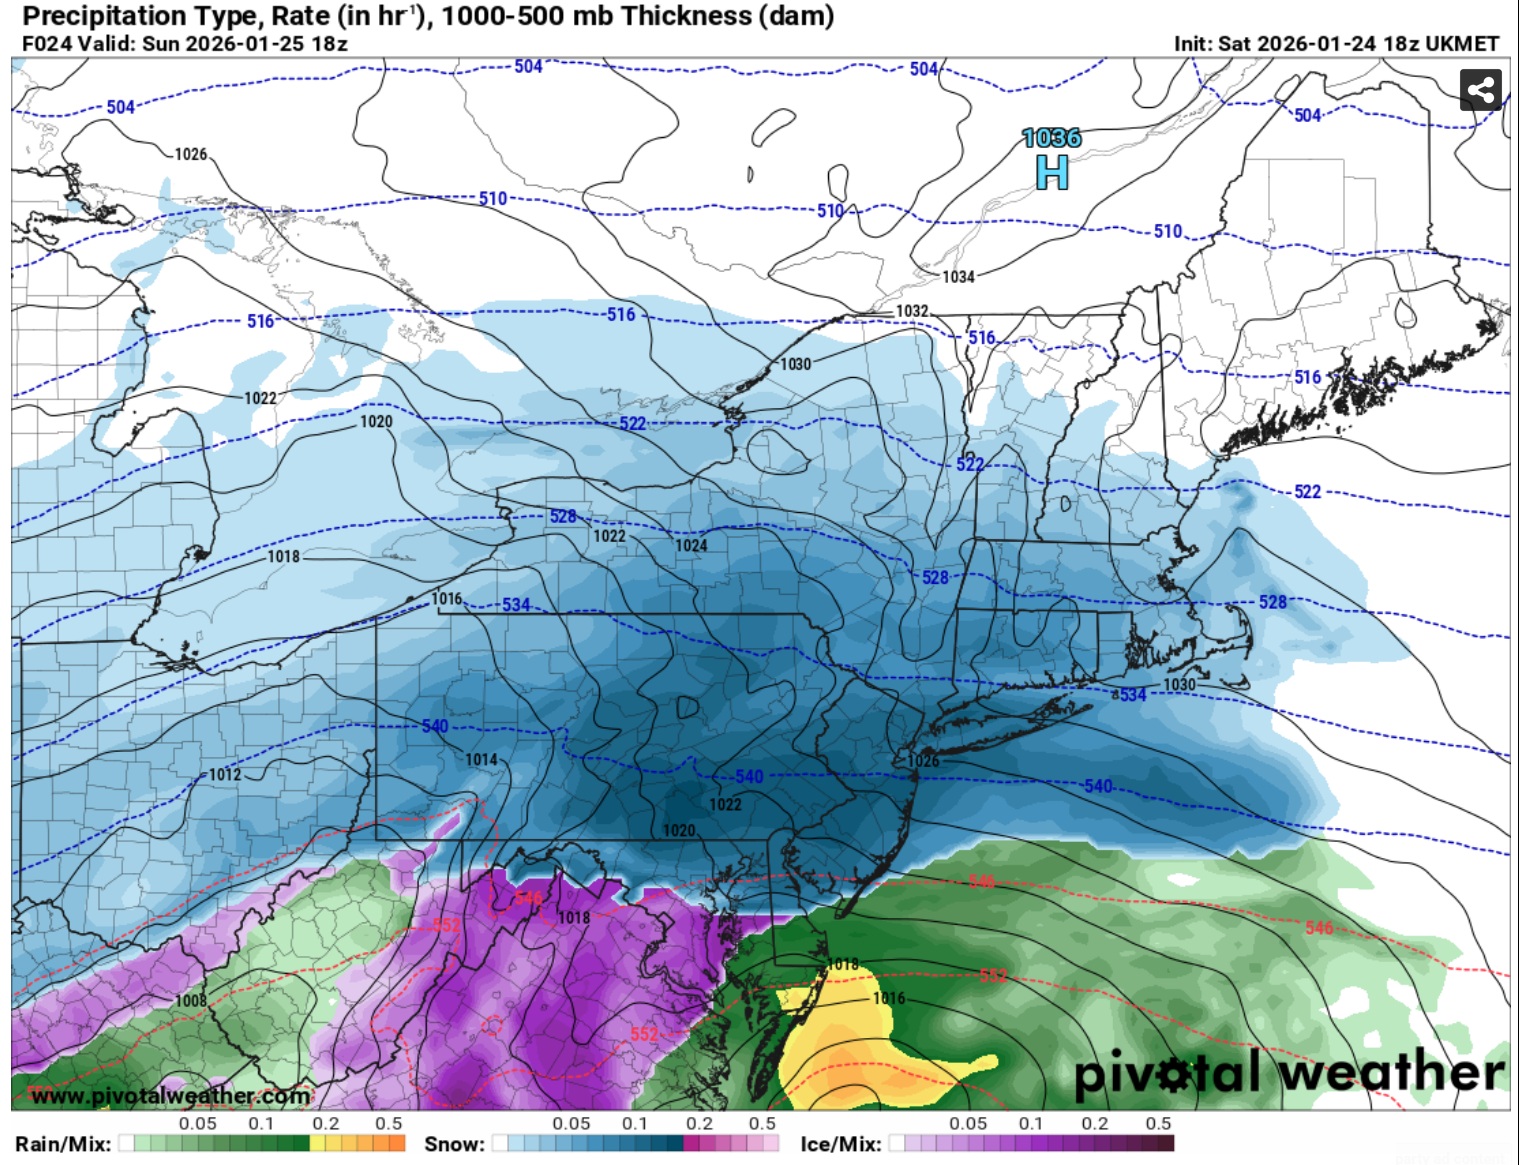
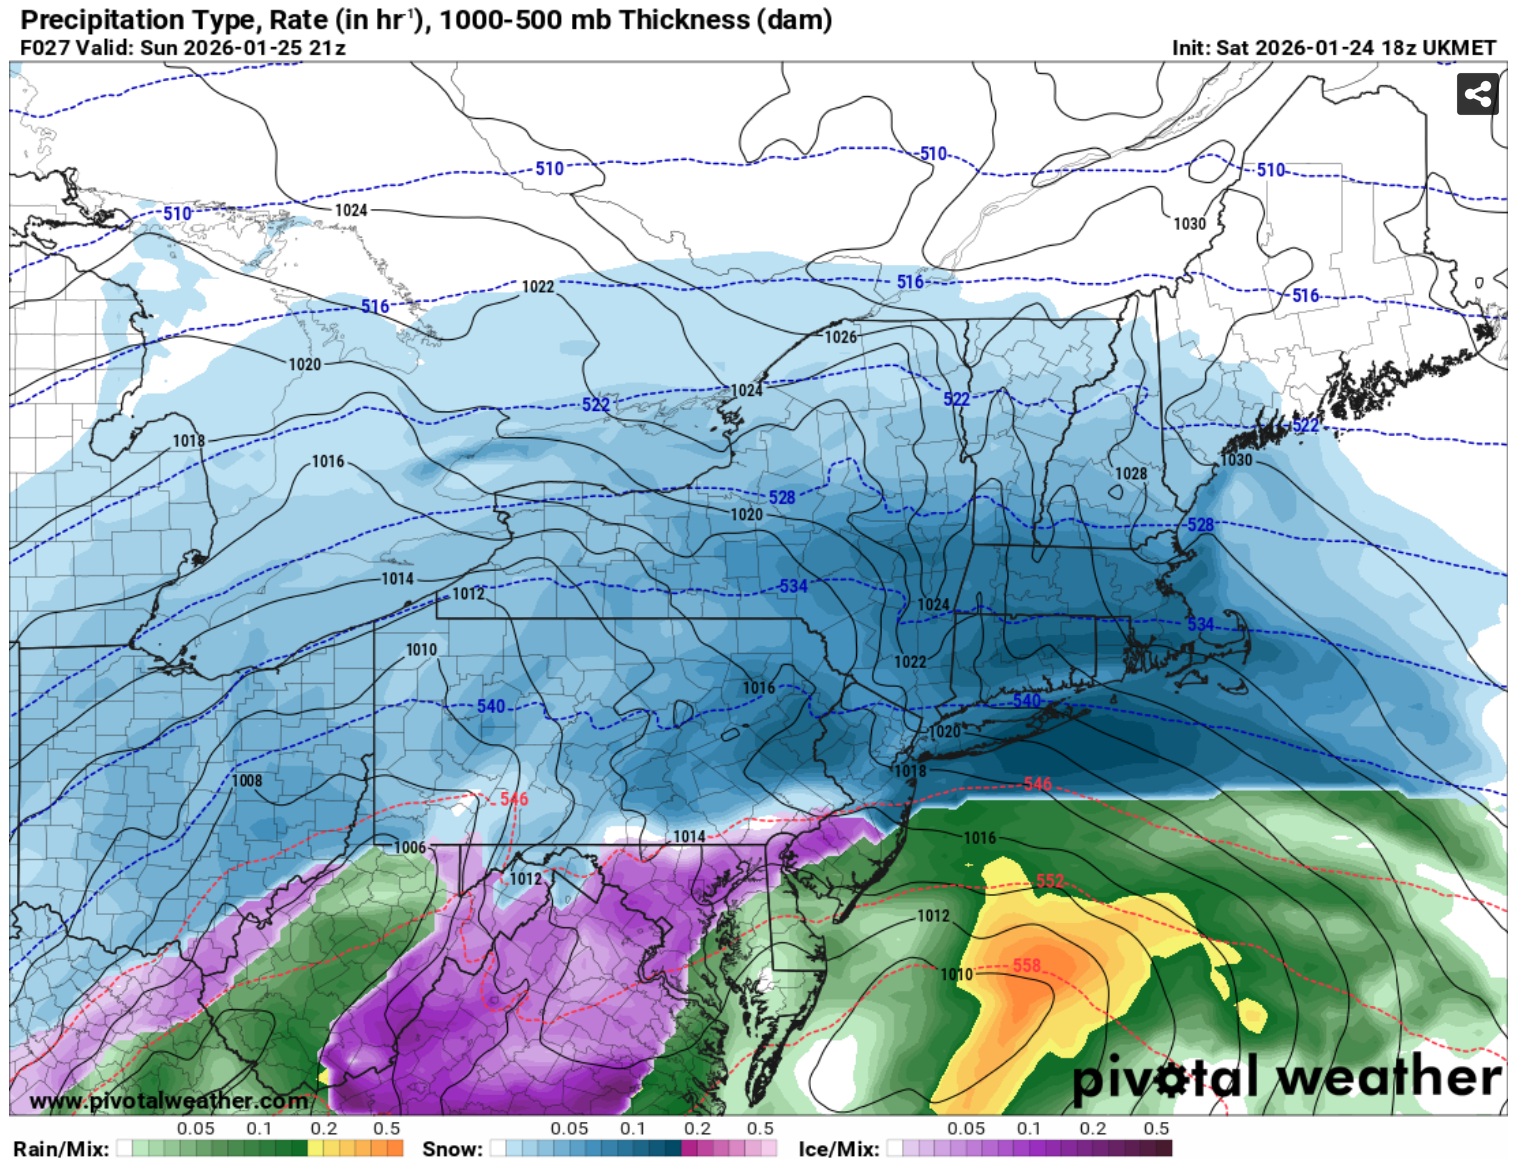
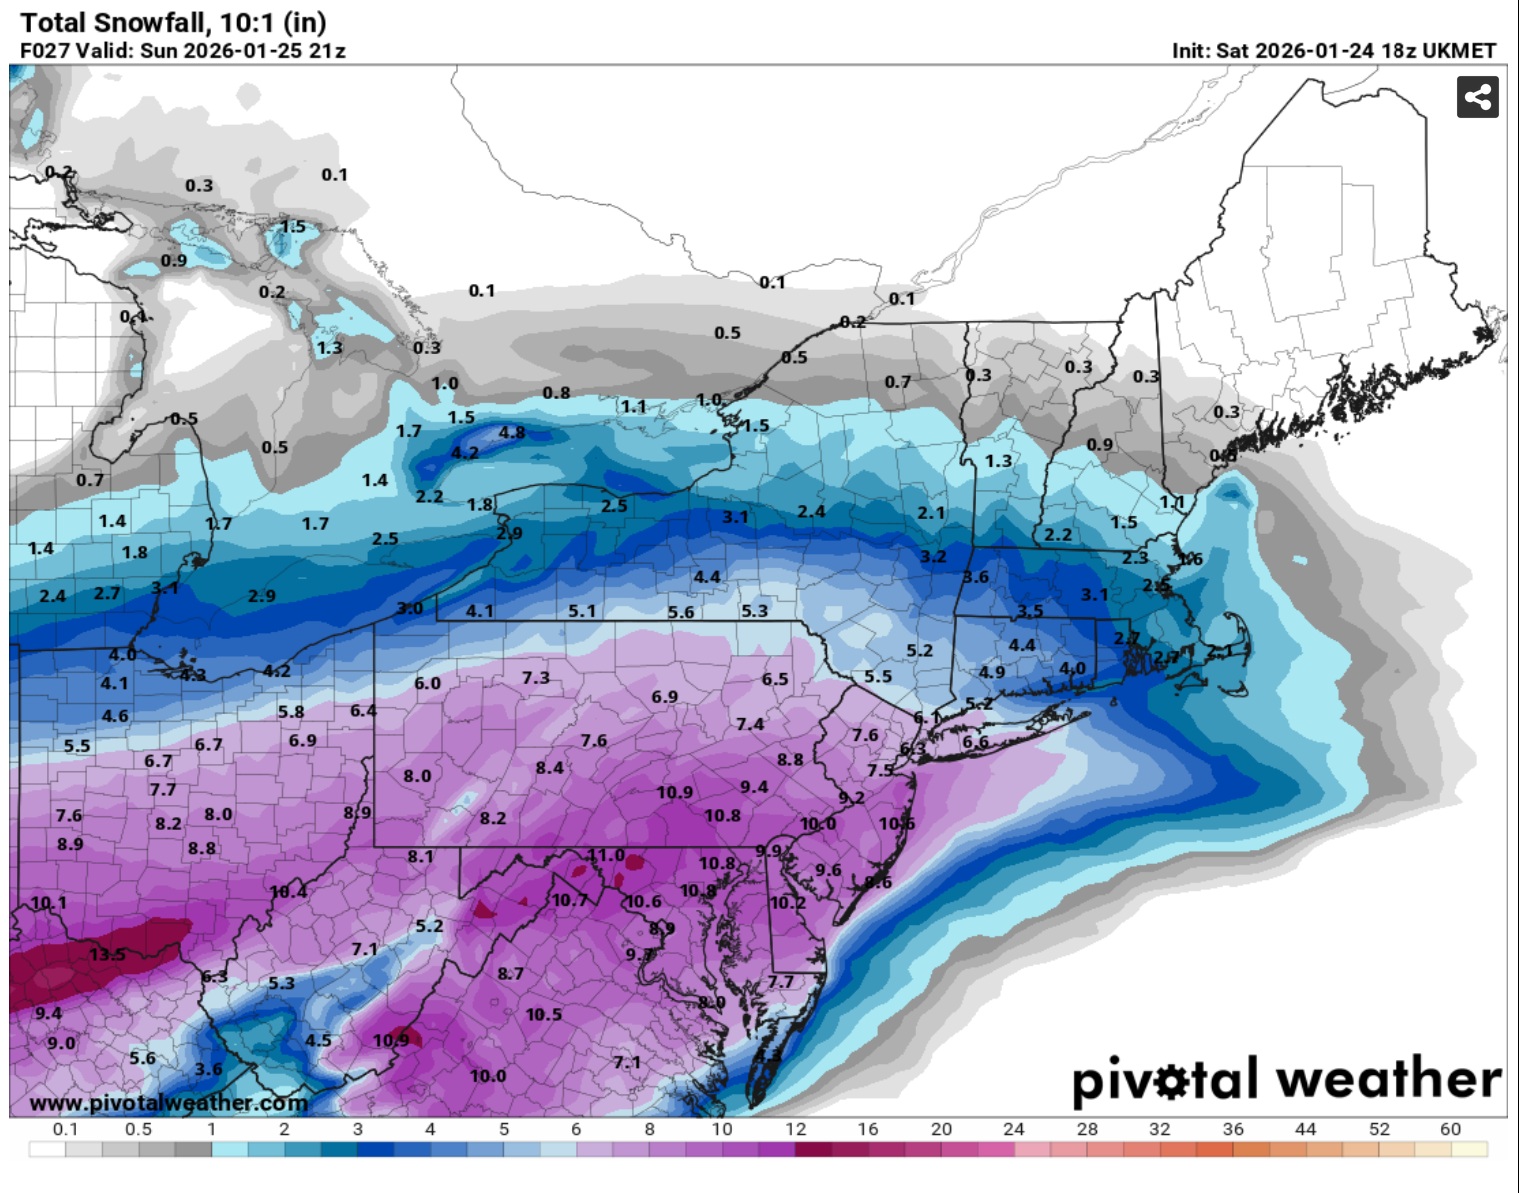
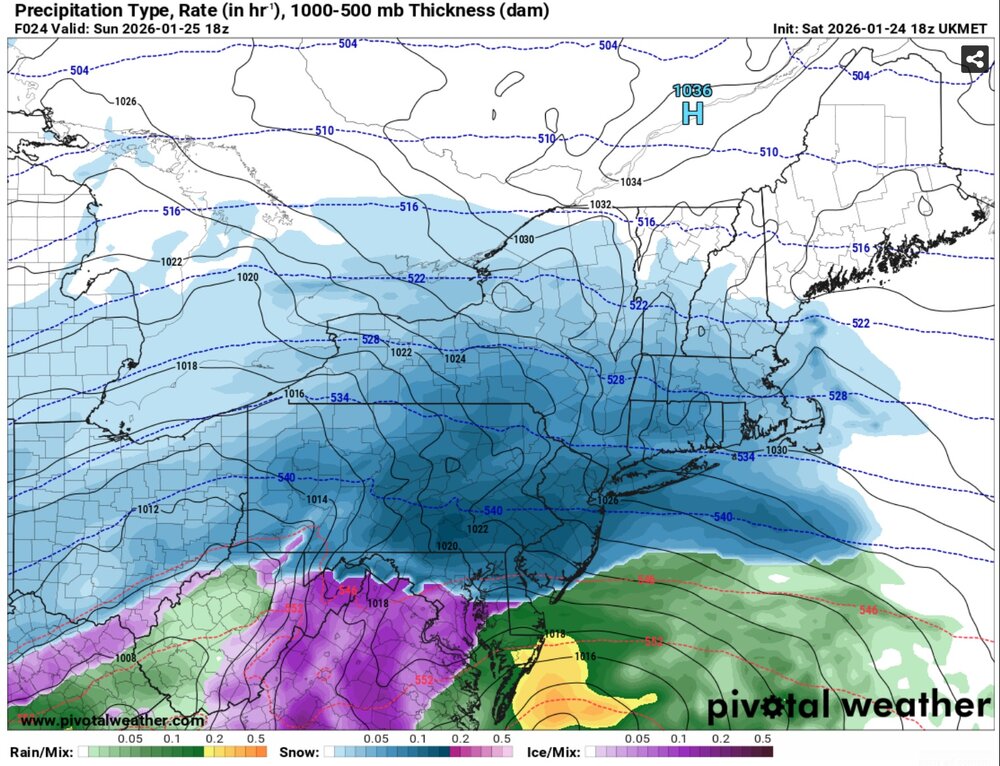
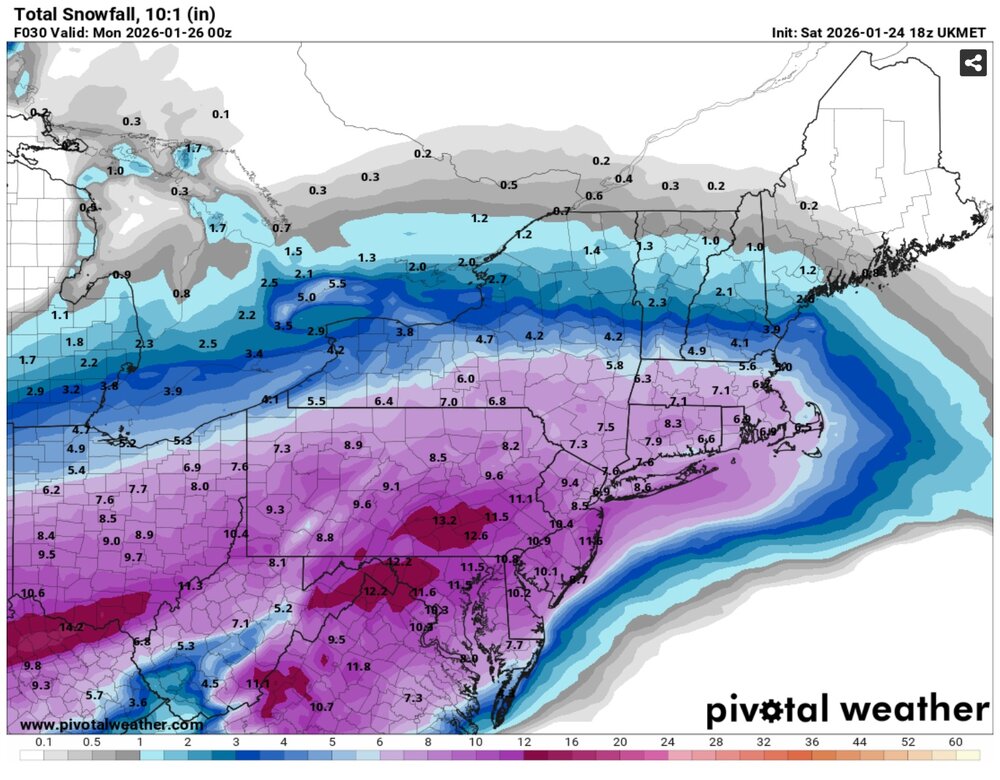
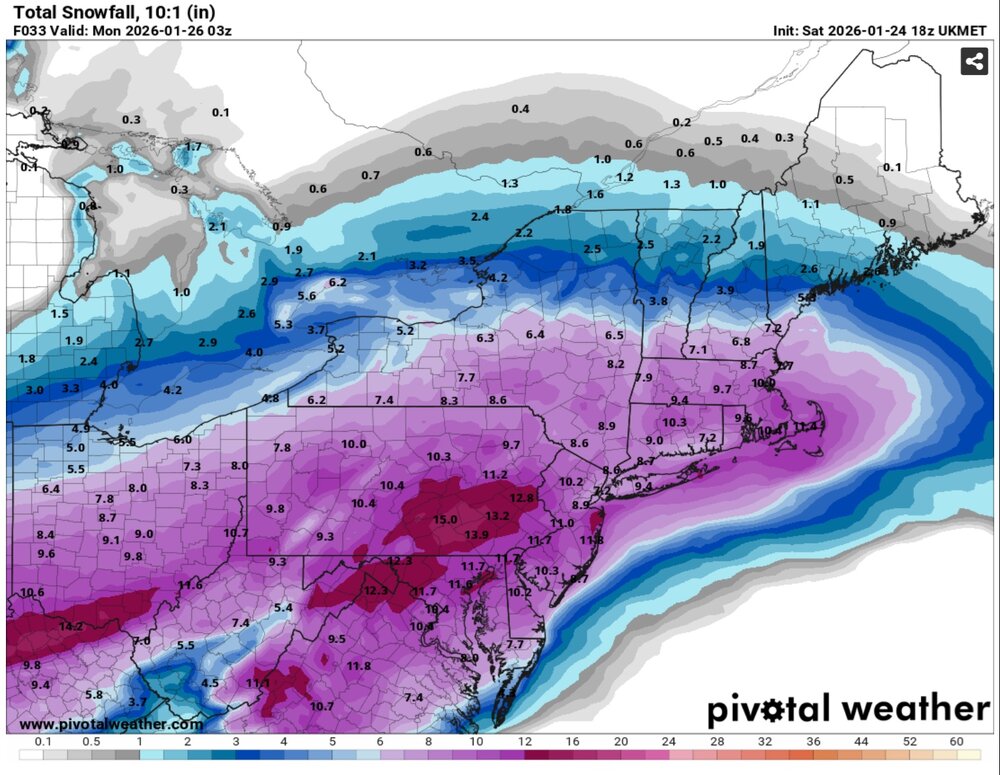
This is questionable. See DCA as an example below. At 18z Sun the 18z UKMET shows 7.7" snow accumulation. The ptype is sleet and the sleet line has cleanly crossed the area. By 21z the sleet line has crossed into PA indicating the line was advancing steadily northward. Yet at 27hr the UK snow total on Pivotal increases to 8.9" for DCA and then 10.3", and 10.4" at 30hr and 33hr. Based on this continued snow accumulation when the dominant ptype is clearly not snow, particularly combined with the mismatch between the UKMET snowfall output compared to other models, the claim above seems dubious. Something is not right with the way Pivotal depicts snowfall accumulation for the UKMET.
-
Extreme Cold, Snow & Sleet: SECS 1/24 - 1/26
eduggs replied to TriPol's topic in New York City Metro
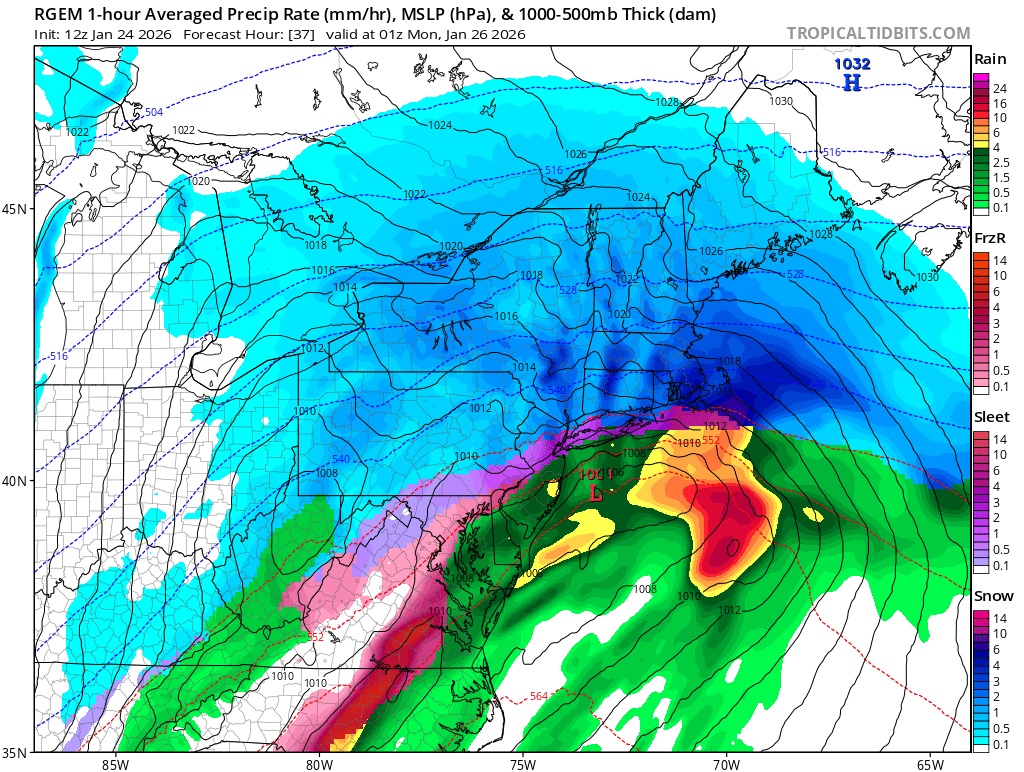
The RGEM has several hours of rain on the eastern half of LI overnight Sun - especially south shore. Anybody buy that? -
Extreme Cold, Snow & Sleet: SECS 1/24 - 1/26
eduggs replied to TriPol's topic in New York City Metro
The 18z RGEM is the best run I've seen in a while from any model. Very impressive thump with several hours of 0.1"+ liquid and it shifted the sleet line meaningfully south! Unfortunately when the 3rd party graphics for the RGEM and NAM differ with northern extent of sleet, it's usually best to go with the NAM. But a shift south is still welcomed. -
Extreme Cold, Snow & Sleet: SECS 1/24 - 1/26
eduggs replied to TriPol's topic in New York City Metro
Unfortunately the ECMWF-AIFS treats all frozen precip. (e.g., sleet) as snow in its 10:1 total, so that map isn't going to tell us much. Same is true for the UKMET and a few others. -
Extreme Cold, Snow & Sleet: SECS 1/24 - 1/26
eduggs replied to TriPol's topic in New York City Metro
Right now the model consensus has the dividing line between big snows and more modest snow accumulations plus sleet from extreme northern Morris County through northern Passaic, Rockland, northern Westchester, and northern Fairfield. Right now I would take the under on double digit amounts south of this line. Hopefully the last two model runs and then nowcasting shift that line south a bit. -
Extreme Cold, Snow & Sleet: SECS 1/24 - 1/26
eduggs replied to TriPol's topic in New York City Metro
Don't tell everybody Don't make them wise. Lots of money to be made of these hyped events -
Extreme Cold, Snow & Sleet: SECS 1/24 - 1/26
eduggs replied to TriPol's topic in New York City Metro
RRFS looks pretty solid for Orange and Putnam - keeps it mostly snow and longer duration. Many more hours of snow for whoever can stay north of the sleet line. -
Extreme Cold, Snow & Sleet: SECS 1/24 - 1/26
eduggs replied to TriPol's topic in New York City Metro
Friendly reminder that 700mb is not the warmest level. -
Extreme Cold, Snow & Sleet: SECS 1/24 - 1/26
eduggs replied to TriPol's topic in New York City Metro
18z NAM looks slower or south with the sleet line through VA and MD initially. Good sign for far! -
Extreme Cold, Snow & Sleet: SECS 1/24 - 1/26
eduggs replied to TriPol's topic in New York City Metro
I think the 3rd party graphics showing the snow-sleet line on the RGEM are probably too far south. The NAM usually wins on this when it is insistent and all guidance has moved towards it. I'm not really sure about the actual thermals on the model - that would be difficult to diagnose without balloon soundings. But even if sleet mixes in to Sussex, Orange, and Putnam I think it will be a snow-sleet mix during the steady precip. as opposed to a clean flip to all sleet. -
Extreme Cold, Snow & Sleet: SECS 1/24 - 1/26
eduggs replied to TriPol's topic in New York City Metro
Anybody else notice the cool upslope-downslope couplet on strong easterly flow in CT and the Hudson Valley visible at like 1z Sunday night on the RGEM? I don't see that signature on any other model.
-
Extreme Cold, Snow & Sleet: SECS 1/24 - 1/26
eduggs replied to TriPol's topic in New York City Metro
The RGEM is a strong thump with several hours of legitimately heavy snow. But it still brings sleet in late afternoon. The LHV on north stays mostly snow and continues lightly through Mon morning. -
Extreme Cold, Snow & Sleet: SECS 1/24 - 1/26
eduggs replied to TriPol's topic in New York City Metro
Recent runs of the RGEM, HRRR, UKMET, RRFS etc bring sleet into the area as early as 2-3pm. I suspect that's probably correct but I think there will be sleet & snow mixed or oscillating ptypes for several hours. -
Extreme Cold, Snow & Sleet: SECS 1/24 - 1/26
eduggs replied to TriPol's topic in New York City Metro
It's warmer than 12z, sorry. -
Extreme Cold, Snow & Sleet: SECS 1/24 - 1/26
eduggs replied to TriPol's topic in New York City Metro
I'll be watching obs from VA late tonight with interest. The NAM/RRFS bring sleet rapidly through S and C VA overnight while the colder models (RGEM/HRRR/RAP) keep it snow. That should give us a good heads up regarding how quickly we are likely to mix or change over on Sunday. -
Extreme Cold, Snow & Sleet: SECS 1/24 - 1/26
eduggs replied to TriPol's topic in New York City Metro
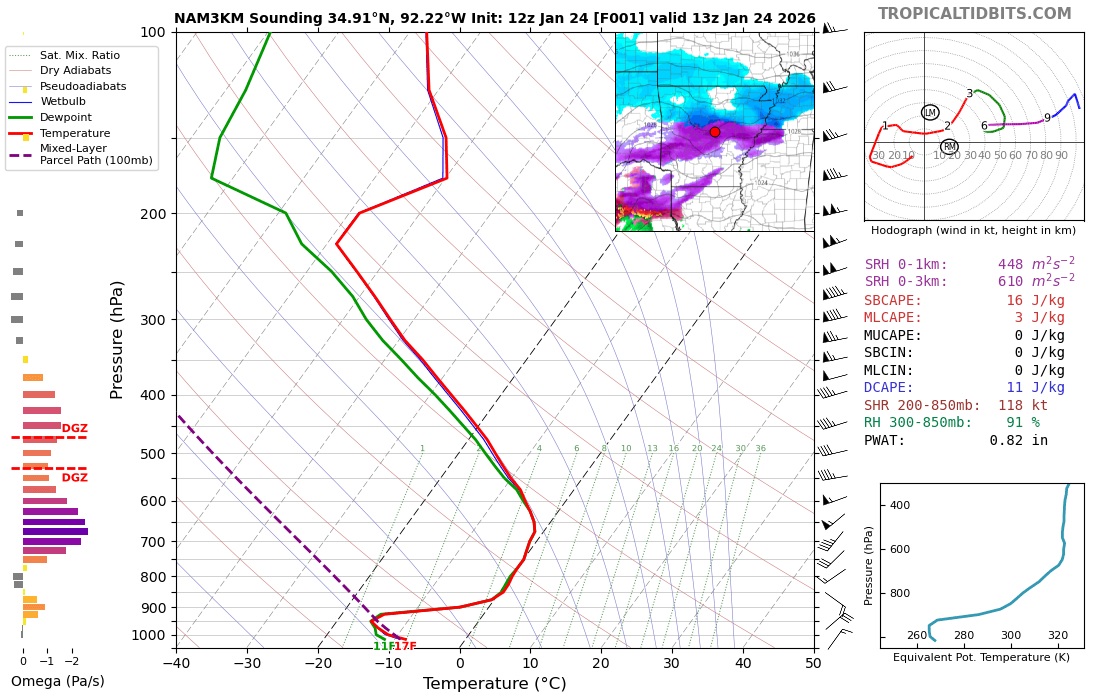
As I mentioned earlier, the NAM doesn't forecast snow. It forecasts QPF and temperature across multiple vertical levels. Other organizations have developed algorithms to translate that data into accumulated snowfall. And in marginal cases where a warm nose is very close to freezing (like Little Rock this morning), it's possible those algorithms incorrectly count snow as sleet. When QPF is significant, this graphical error can add up quickly. In these cases, the fault lies with the algorithms, not the model itself. We would need this morning's sounding from Little Rock airport to try to diagnose any model errors. But based on the NAM forecast sounding from the past 4 runs at Little Rock, I suspect this was the case. Unfortunately the NAM is not showing a marginal sounding for NYC tomorrow afternoon. But NWNJ and the LHV could benefit from a similar clown map error. -
Extreme Cold, Snow & Sleet: SECS 1/24 - 1/26
eduggs replied to TriPol's topic in New York City Metro
Careful about extrapolating a borderline snow sounding in Arkansas to our area. On one hand, we could also benefit from snow and sleet mixed being treated as non-snow on the clown maps. Sometimes rimed flakes aggregate into parachutes that accumulate fairly well (~12:1). Unfortunately the NAM- and RRPS-modeled soundings have a much more pronounced warm layer for our area tomorrow afternoon than for Little Rock this morning. It's several degrees C above freezing in the warmest layer. We need that to be completely wrong. In the Little Rock case the shallow warm layer is near freezing. -
Extreme Cold, Snow & Sleet: SECS 1/24 - 1/26
eduggs replied to TriPol's topic in New York City Metro
That raises a good point about 3rd party vendor snowfall graphics. Weather models don't forecast snowfall explicitly. They generate QPF and temperature at numerous vertical pressure levels at each horizontal grid point. 3rd party algorithms translate that information into a ptype forecast. But sometimes more than one ptype is present at the same time. Snowfall can be under-counted in cases where the warm layer is shallow and not-pronounced because the algorithm may lump it all as sleet when it's actually a mix of ptypes or rimed snowflakes. See the Little Rock NAM sounding below.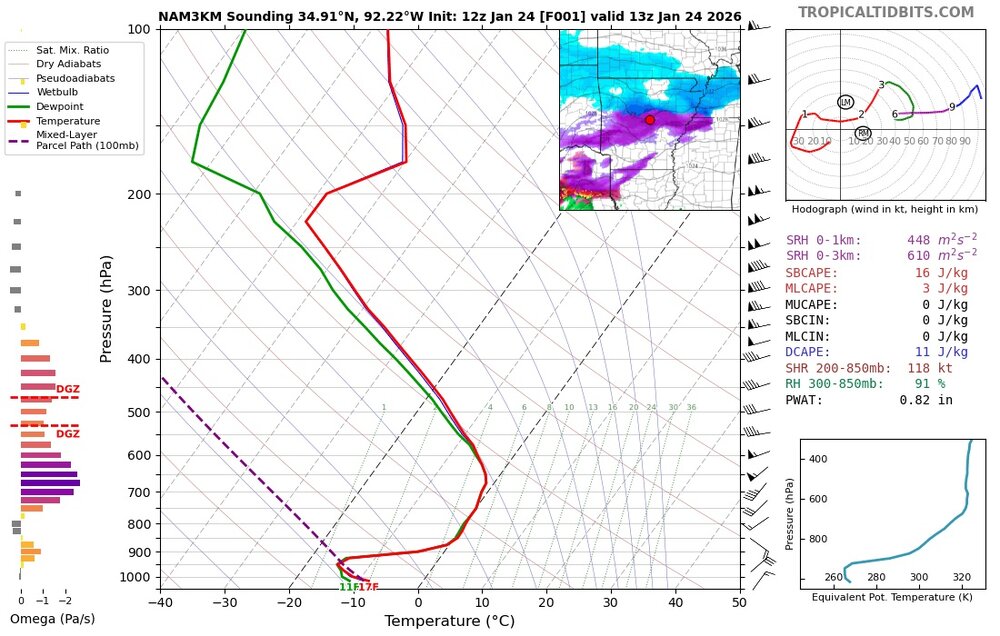
-
Extreme Cold, Snow & Sleet: SECS 1/24 - 1/26
eduggs replied to TriPol's topic in New York City Metro
The steady precip. should be done by midnight if not sooner, so theoretically there's plenty of time to clear snow and treat roads to open schools and businesses Monday morning. But just based on the hype I expect most things to be closed on Monday. -
Extreme Cold, Snow & Sleet: SECS 1/24 - 1/26
eduggs replied to TriPol's topic in New York City Metro
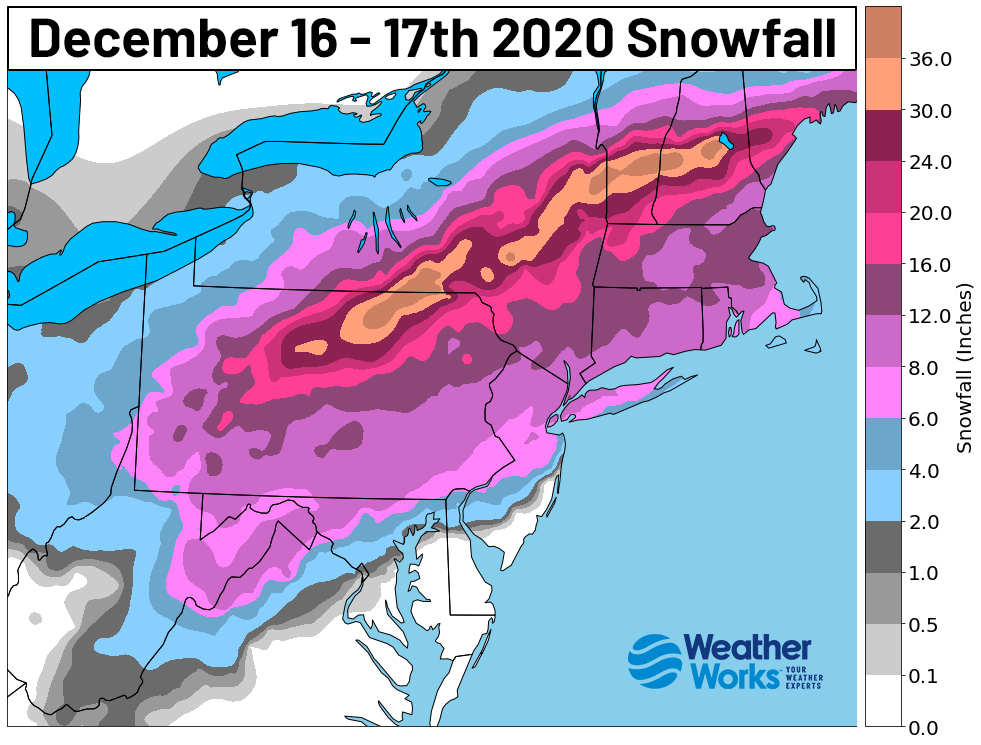
The lead in forecast evolution for tomorrow's storm reminds me a lot of the December 2020 across our area (differences of course especially SNE and mid-Atl). The big snows for that one slipped away too but the impact was still significant locally.