eduggs
-
Posts
5,951 -
Joined
-
Last visited
Content Type
Profiles
Blogs
Forums
American Weather
Media Demo
Store
Gallery
Everything posted by eduggs
-
Extreme Cold, Snow & Sleet: SECS 1/24 - 1/26
eduggs replied to TriPol's topic in New York City Metro
I'm seeing 18"+ for parts of the mid-HV across to CT on the latest guidance... maybe down to Orange & Putnam... especially if measuring with a snowboard every 6 hours. -
Extreme Cold, Snow & Sleet: SECS 1/24 - 1/26
eduggs replied to TriPol's topic in New York City Metro
That includes snow since 7am. -
The ECMWF-AIFS Ens not withstanding, it looks like we're back to an all-northern stream "pattern." It's a shame we can't get another southern stream wave to turn the corner. Looks cold and dry.
-
Really a shame all the HEAVY sleet obs from VA and MD. Such a waste of surface cold and QPF. There's going to be some places that see 0.75"+ QPF as sleet.
-
Dumpity dumpity. Going to sail past 6" soon. Gotta be 1.5"/hr right now.
-
Extreme Cold, Snow & Sleet: SECS 1/24 - 1/26
eduggs replied to TriPol's topic in New York City Metro
You can clearly see the arc of the warm nose on radar with sleet in SEPA with snow to the east in NJ down to almost Cape May. -
Extreme Cold, Snow & Sleet: SECS 1/24 - 1/26
eduggs replied to TriPol's topic in New York City Metro
The mid-level warm surge is setting up through SEPA progged to head towards north central NJ. NYC east should be a little cooler or later to warm. The latest few HRRR runs are really trying to push the sleet line back south after 22z or so. Looks really close for Passaic Co. to southern Westchester. -
Extreme Cold, Snow & Sleet: SECS 1/24 - 1/26
eduggs replied to TriPol's topic in New York City Metro
The GFS clearly performed terribly. If shifted significantly northward for 8 cycles in a row to catch up to the rest of guidance. DCA is not getting 18" of snow. They already flipped. -
Extreme Cold, Snow & Sleet: SECS 1/24 - 1/26
eduggs replied to TriPol's topic in New York City Metro
The NAM has had about 0.5" QPF as snow for Staten Island for several cycles. I'm not sure how much melted liquid has fallen there. It might not end up so far off when the mix begins. With good ratios to begin that could easily end up as 8" of snow. -
Extreme Cold, Snow & Sleet: SECS 1/24 - 1/26
eduggs replied to TriPol's topic in New York City Metro
Already approaching the best event here since Feb 2021! If you are able and you haven't gotten outside yet, bundle up and do it! -
Let's do it! Bronx would seem to have a better shot. I figure we have at least 3 more hours of clean snow and then several more with possible snow/sleet mix. I feel slightly more confident about double digits. Ratios are decreasing unfortunately.
-
Northeast of you and a bit lower in elevation. I don't love publicizing my town on a public forum
-
Extreme Cold, Snow & Sleet: SECS 1/24 - 1/26
eduggs replied to TriPol's topic in New York City Metro
The latest HRRR does sink the mix line down a little this afternoon! That could really help NNJ and northern Westchester pick up an extra inch or two this evening and flush the sleet vibe. It continues to look sick for Orange and Putnam on north!! -
Extreme Cold, Snow & Sleet: SECS 1/24 - 1/26
eduggs replied to TriPol's topic in New York City Metro
Looks amazing for Orange, Putnam, and Dutchess. Even has lingering wraparound into tomorrow. -
Extreme Cold, Snow & Sleet: SECS 1/24 - 1/26
eduggs replied to TriPol's topic in New York City Metro
I think the NAM has been great - just like with Dec. 26. Thank god we have the NAM model. Otherwise people would have been thinking for days that we were getting 18"+ (i.e., Apple Weather App). People think the Pivotal clown maps are the NAM model. They're not. The NAM forecasts QPF and temperature. How other people (pivotal, TT, even Bufkit) calculate snowfall based on that is separate from the model itself. This morning we've had a slight overperformance in terms of QPF and really good ratios. But the NAM has clearly been the best with the mix line. -
Extreme Cold, Snow & Sleet: SECS 1/24 - 1/26
eduggs replied to TriPol's topic in New York City Metro
We saw heavy rates overcome a shallow layer in Little Rock yesterday morning. But that sounding didn't punch through with +3C like this afternoon's forecast sounding looks to. -
4.25 new in central Morris County. Temp steady for the past hour at 9.4F. In a bit of a precip. lull relative to earlier. Still probably 0.75mi vis.
-
Check the MA forum. They're saying it's really not accurate. Mix line way north of that.
-
Extreme Cold, Snow & Sleet: SECS 1/24 - 1/26
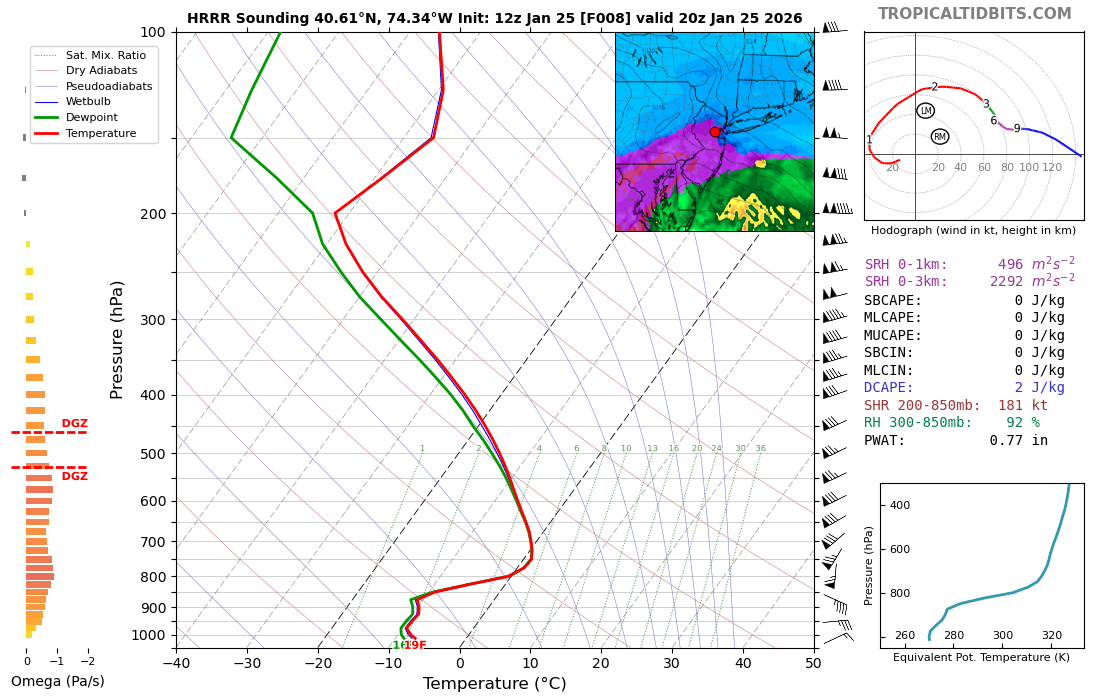
eduggs replied to TriPol's topic in New York City Metro
That's fair, but here's 3pm near Newark. That's a sleet sounding. So presumably sleet started before this time period. Obviously the further north you go, the later this sleet. But it definitely looks like it's coming quickly. That's why I'm heading outside now to enjoy it.
-
Extreme Cold, Snow & Sleet: SECS 1/24 - 1/26
eduggs replied to TriPol's topic in New York City Metro
Who likes rain in the winter, are you crazy? I'm obviously rooting for snow and only snow. I'm heading outside now to enjoy it. It's perfect out right now. I'm not looking forward to sleet this afternoon. -
Extreme Cold, Snow & Sleet: SECS 1/24 - 1/26
eduggs replied to TriPol's topic in New York City Metro
I'm extrapolating when areas further south started mixing with sleet relative to the HRRR. The mid-level surge is really strong. -
Extreme Cold, Snow & Sleet: SECS 1/24 - 1/26
eduggs replied to TriPol's topic in New York City Metro
I think we have about 4 hours at least to do it. Although sleet could add another inch+ thereafter. Might be able to do it. -
Extreme Cold, Snow & Sleet: SECS 1/24 - 1/26
eduggs replied to TriPol's topic in New York City Metro
The NAM and GFS seem okay on Pivotal, but the UKMET seems wrong. It keeps adding snow after the mix line moves well north. The ECM-AI is also obviously way too widespread with snow accumulations but I think that's due to lack of vertical resolution. A few other models might be off on Pivotal too - it's model by model. -
Extreme Cold, Snow & Sleet: SECS 1/24 - 1/26
eduggs replied to TriPol's topic in New York City Metro
Ugh, the HRRR has sleet in here by 1-2pm. It has continuously shifted north since it's been in range. And sleet actually started to mix in in VA earlier than the HRRR showed. The northern edge of mixing might oscillate or battle back to snow but that's quite the warm tongue surge now modeled. -
Extreme Cold, Snow & Sleet: SECS 1/24 - 1/26
eduggs replied to TriPol's topic in New York City Metro
I wish that were true, but it's not. Regardless, even if it is/were true, that's what the "mix line" means.