

ldub23
-
Posts
1,914 -
Joined
-
Last visited
Content Type
Profiles
Blogs
Forums
American Weather
Media Demo
Store
Gallery
Posts posted by ldub23
-
-

More cold overall
-
This seems so much like last seasons snowless winter. A 2-3 day cold spell followed by warm.

-
Im out till the NWS has snow in its 7 day forecast. Might till 2025 lol
Nothing and now the consensus is at the end of the run it warms up so now we have to wait till feb for the pattern change while the seasonal warmup begins

-
Never good when in January threads are being started about rain
-
 1
1
-
 2
2
-
-
47 minutes ago, RIC Airport said:
12z EPS still has a signal in the LR after next weekend's cutter and once the PV lobe drops south and moves eastward. This would provide the cold and push the storm track farther south. Also, the EPS mean has ticked back up and some with quite a few hits on the ensembles, which is different from many previous runs.


-
The se ridge wont go away
-
1 hour ago, RIC Airport said:
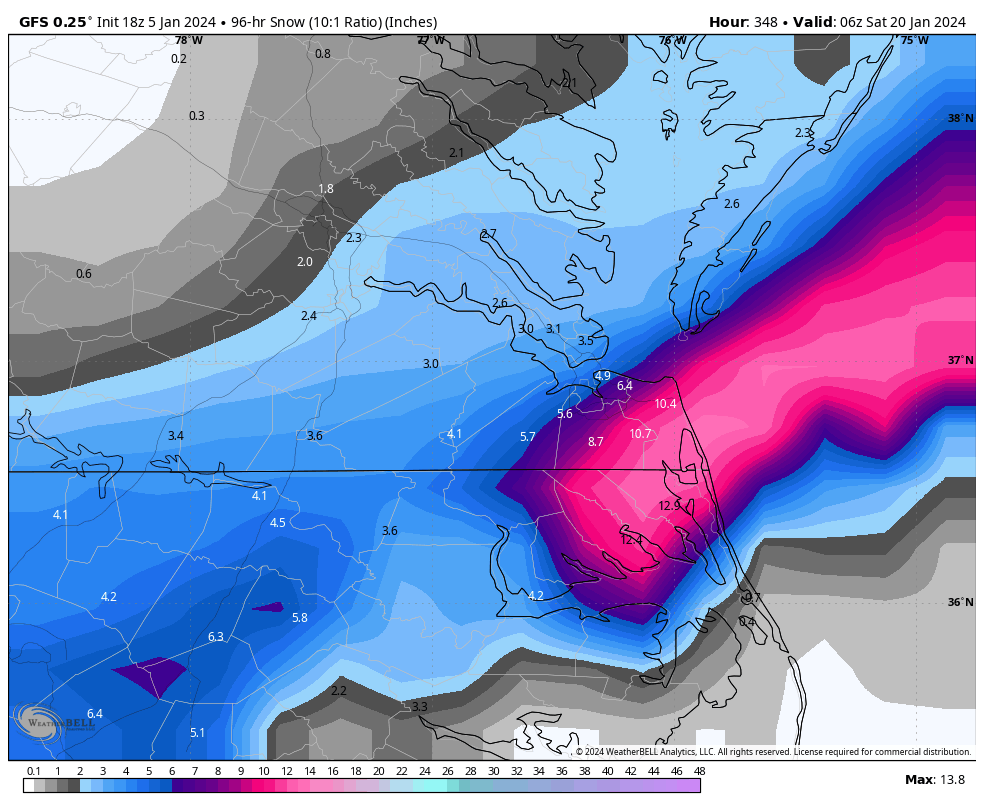
18Z GFS was encouraging, @Conway7305, @wasnow215, @ldub23, @Stormpc, @mikeeng92, @Rhino16. The PV lobe drops into the CONUS and delivers cold and forces the storm track south, just hopefully it's not too far south. But, we have some wiggle room.
")

30 mile NW trend please
-
1
-
-
Amazing cold dump in the west with no way for it to come east. We will end with a ridge and warm rain. 12Z is far worse than even the 6z which was bad enough. This is 1977 in reverse. hot in the east brutal cold in the west.

-
Latest gfs ends with an SER and once again the cold can never get here. low after low cutting to the west.

-
2 hours ago, RIC Airport said:
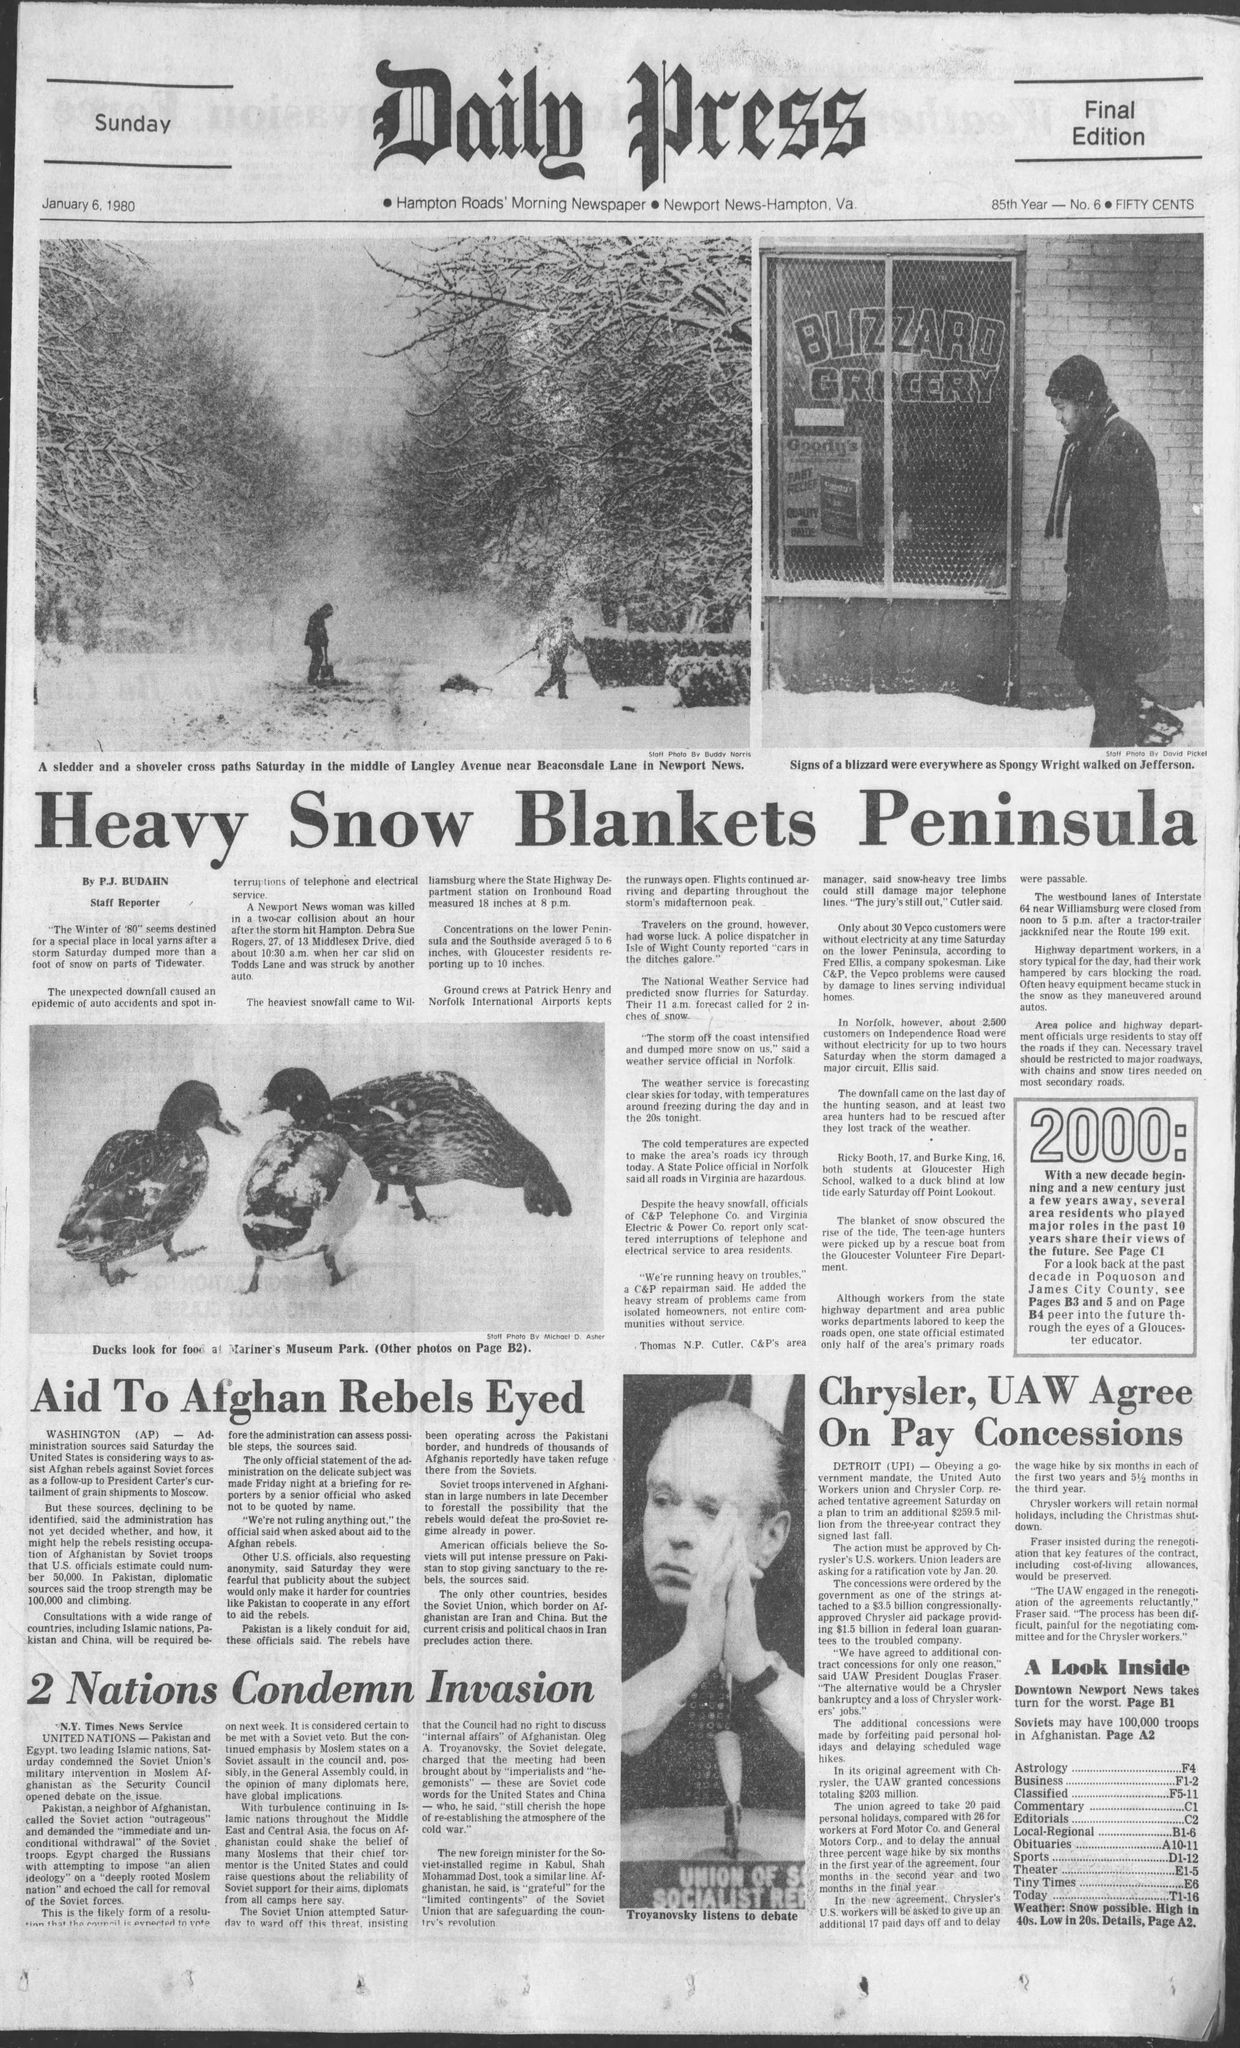
I found these, too for your area. When I have time at some point, I'll look for more.
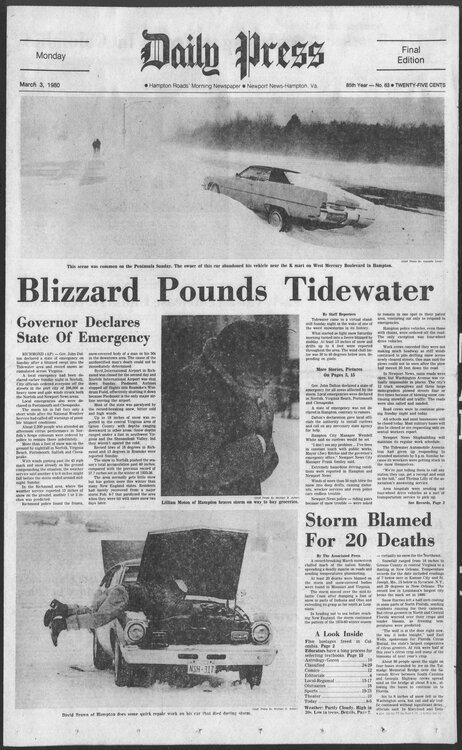
I was a kid and remember it well. Friday afternoon they were predicting snow flurries for sat, then sat morning they were saying 1-2 inches. At the height of the storm it was 16 degrees with 40+wind gusts and heavy snow. It snowed all day sunday and the temp warmed to 27. They said 13 inches but it had to be at least 20. Right after we had a big warm up and it was gone in a few days except there were still small snow piles on apr 02 in parking lots.
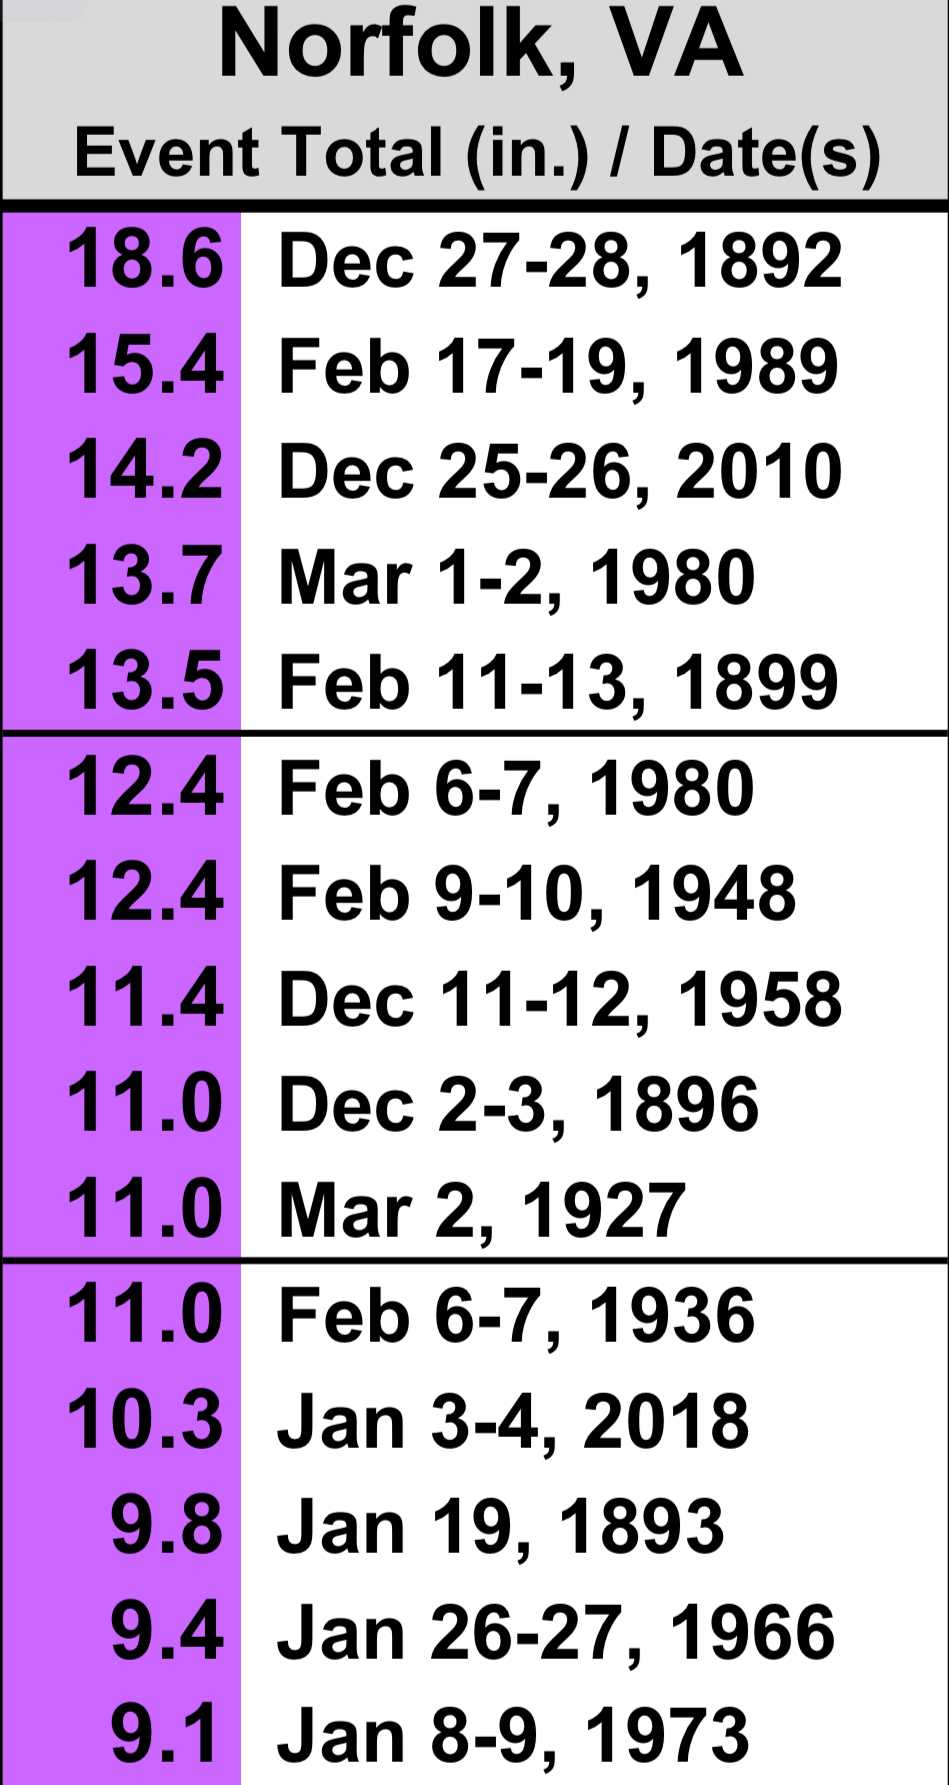
Im using Norfolk obs. Here is the wildest 10 days of weather ever here. On the 15th of feb it got to 80 degrees. On the 18th we had 13.6 of snow. On the 21st it got to 76 degrees. On the 24th we had 8.6 inches of snow. Nothing like it since.
Sum 1462 981 - - 601 9 5.80 24.4 - Average 52.2 35.0 43.6 -0.6 - - - - 1.2 Normal 53.4 35.1 44.2 - 582 1 2.90 1.5 - 1989-02-01 72 46 59.0 16.7 6 0 0.00 0.0 0 1989-02-02 80 52 66.0 23.6 0 1 0.00 0.0 0 1989-02-03 81 41 61.0 18.5 4 0 0.11 0.0 0 1989-02-04 41 33 37.0 -5.6 28 0 0.02 0.0 0 1989-02-05 38 34 36.0 -6.7 29 0 0.64 0.0 0 1989-02-06 45 37 41.0 -1.8 24 0 0.18 0.0 0 1989-02-07 45 35 40.0 -3.0 25 0 0.12 0.0 0 1989-02-08 43 36 39.5 -3.6 25 0 0.00 0.0 0 1989-02-09 37 20 28.5 -14.7 36 0 0.00 0.0 0 1989-02-10 40 19 29.5 -13.9 35 0 0.00 0.0 0 1989-02-11 53 26 39.5 -4.0 25 0 0.00 0.0 0 1989-02-12 55 30 42.5 -1.2 22 0 0.00 0.0 0 1989-02-13 57 34 45.5 1.6 19 0 0.02 0.0 0 1989-02-14 77 56 66.5 22.5 0 2 0.00 0.0 0 1989-02-15 80 62 71.0 26.8 0 6 0.00 0.0 0 1989-02-16 67 41 54.0 9.6 11 0 T 0.0 0 1989-02-17 43 30 36.5 -8.1 28 0 0.15 1.2 0 1989-02-18 35 29 32.0 -12.7 33 0 1.33 13.6 7 1989-02-19 38 26 32.0 -12.9 33 0 0.18 0.6 9 1989-02-20 50 24 37.0 -8.1 28 0 0.04 0.0 4 1989-02-21 76 44 60.0 14.7 5 0 0.49 0.0 0 1989-02-22 60 43 51.5 6.0 13 0 0.21 0.0 0 1989-02-23 43 36 39.5 -6.2 25 0 0.16 0.4 0 1989-02-24 36 26 31.0 -14.9 34 0 1.03 8.6 3 1989-02-25 36 21 28.5 -17.6 36 0 0.00 0.0 7 1989-02-26 50 29 39.5 -6.8 25 0 0.00 0.0 3 1989-02-27 44 36 40.0 -6.5 25 0 0.41 T 0 1989-02-28 40 35 37.5 -9.2 27 0 0.71 0.0 0 -
1
-
-
29 minutes ago, RIC Airport said:
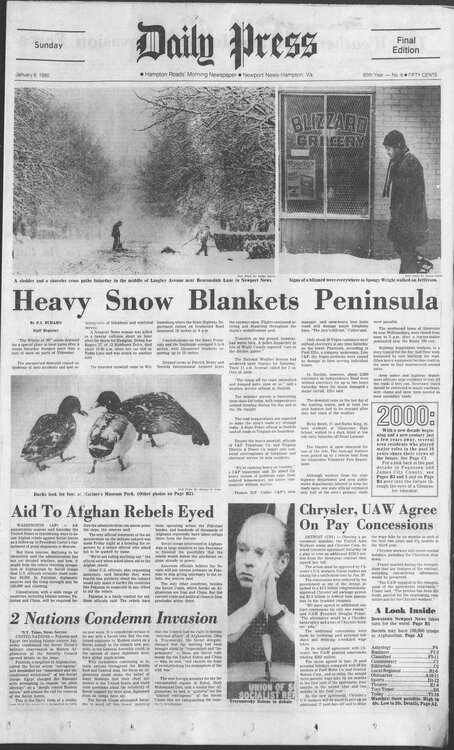
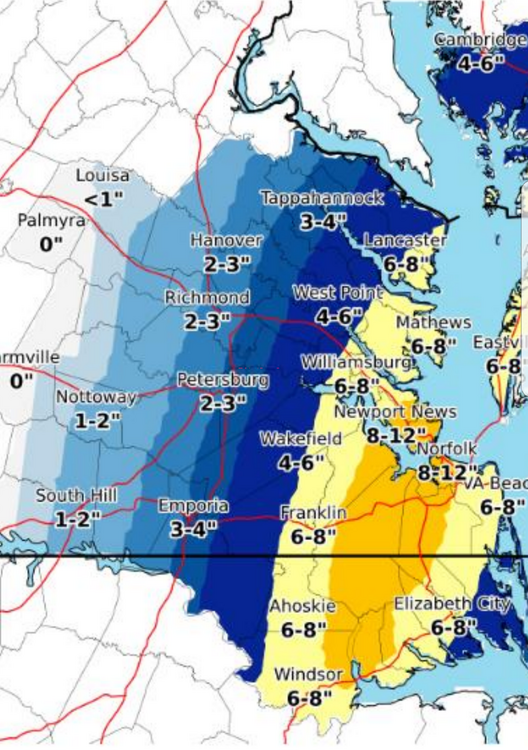
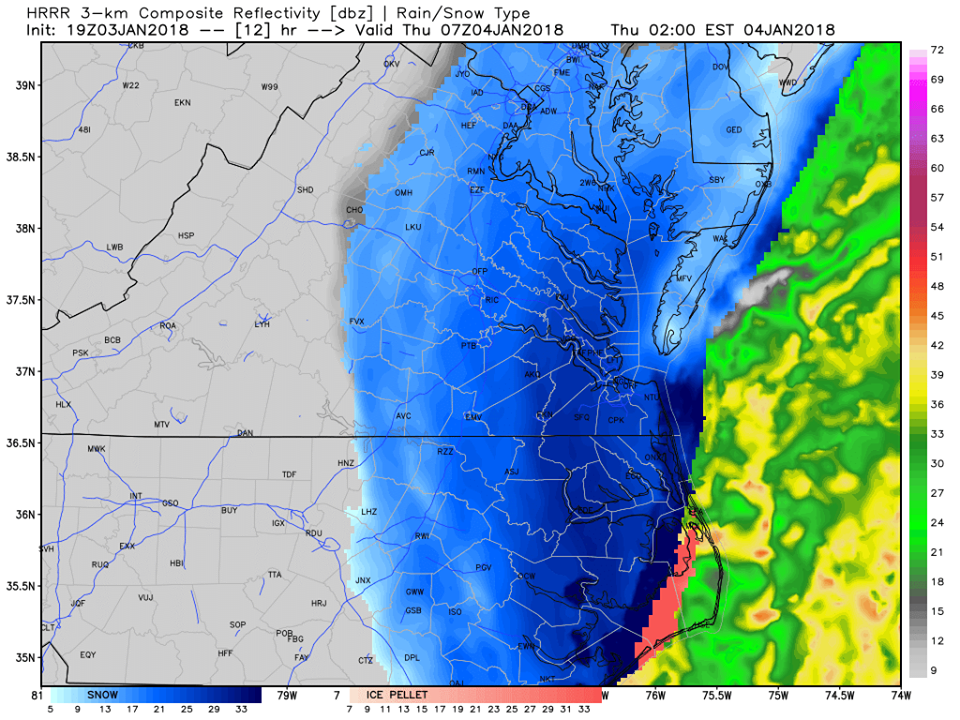
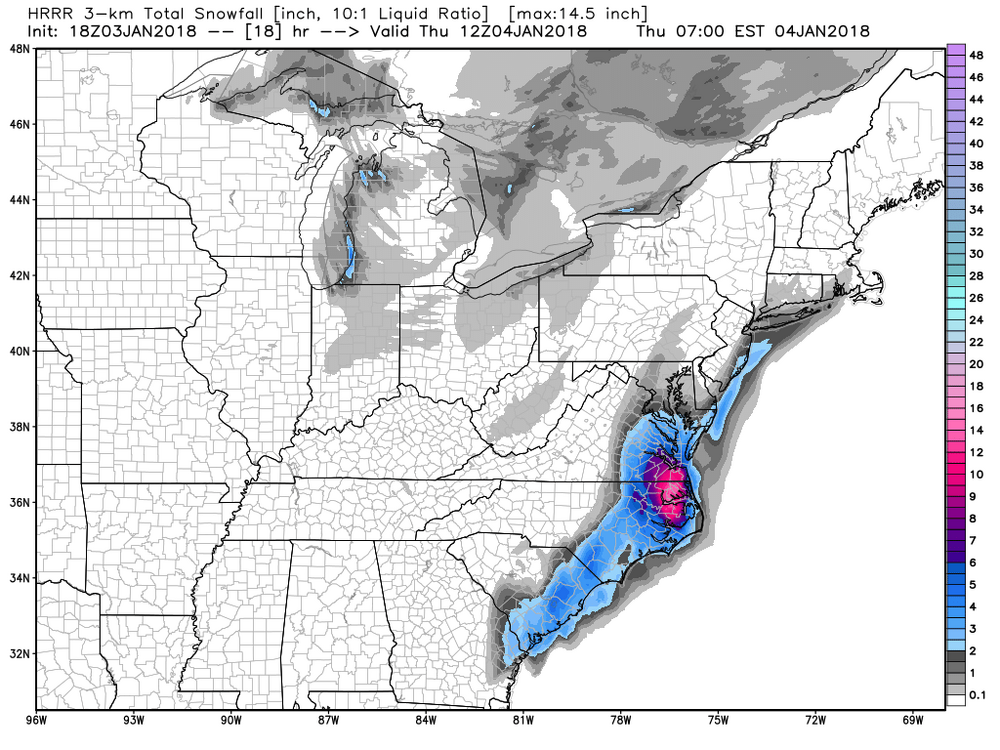
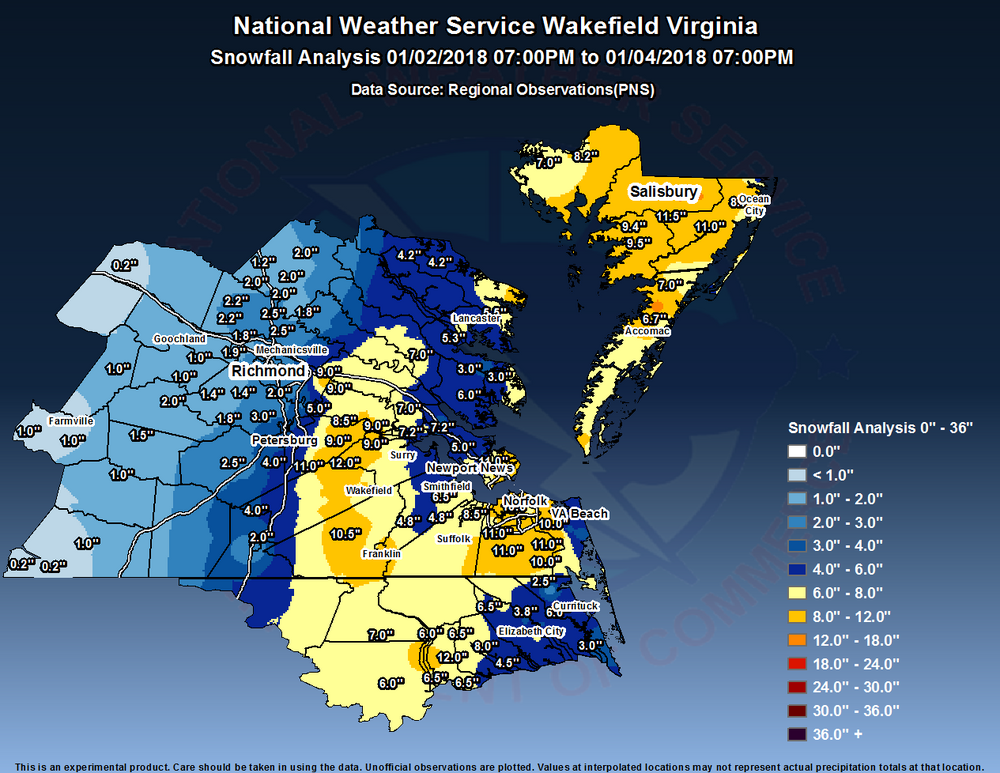
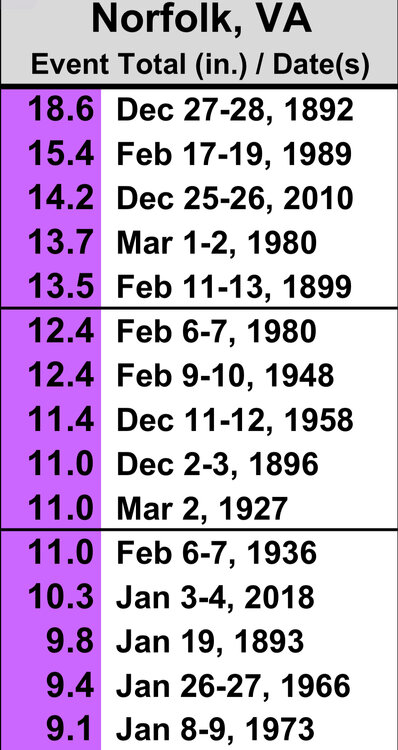
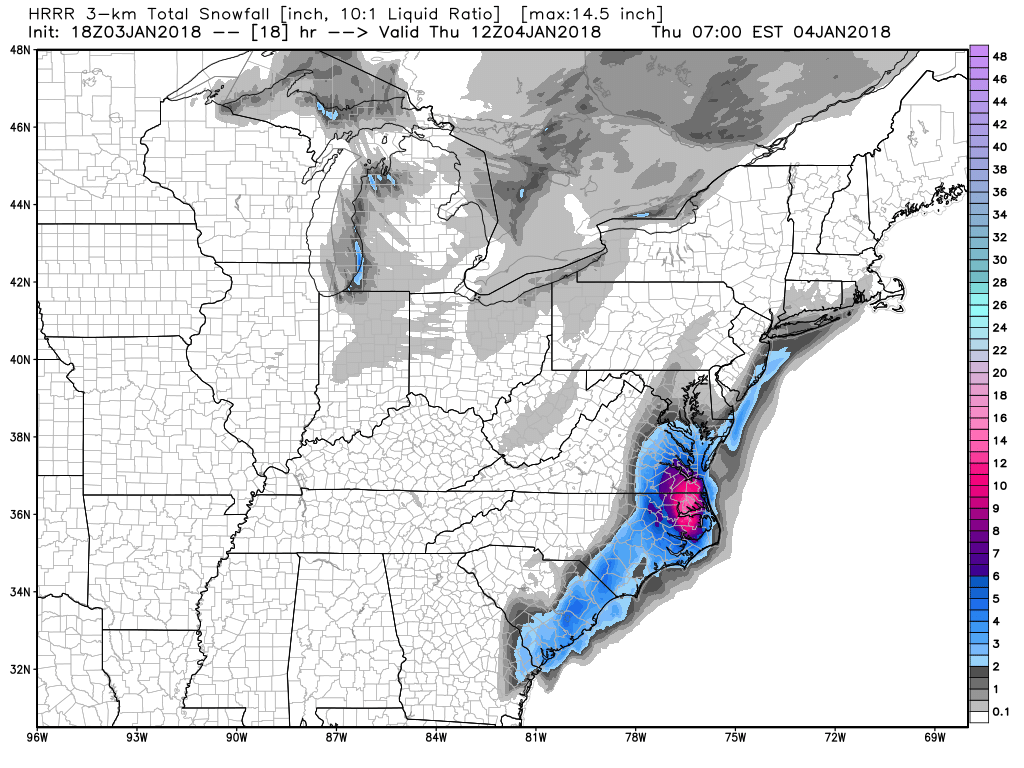
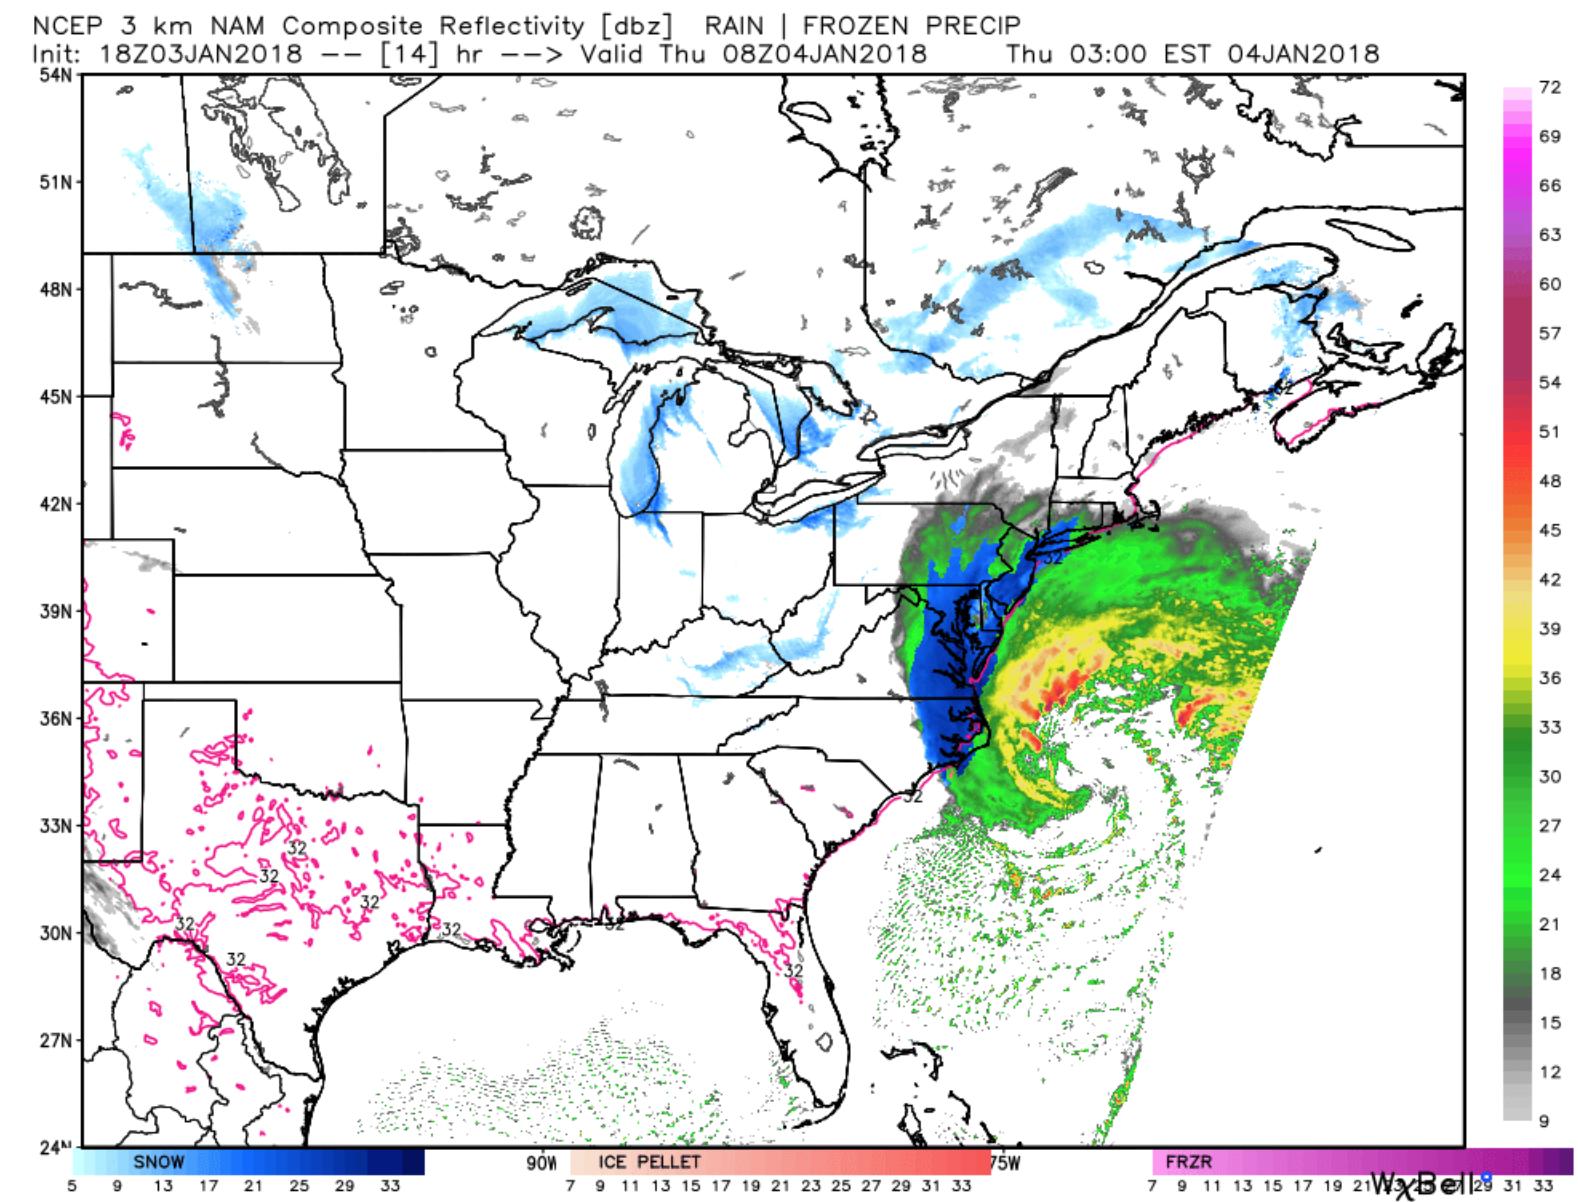
To cheer everyone up, today marks the sixth anniversary of the blizzard that struck E NC and VA, which was the second blizzard to hit Hampton Roads in less than a year. The storm, which was verified as a blizzard at ORF recorded 10.3” of snow. However, due to the storm's track, Richmond only recorded 3.0”. This event was the eleventh biggest snowstorm on record at ORF since snowfall records began in 1891.
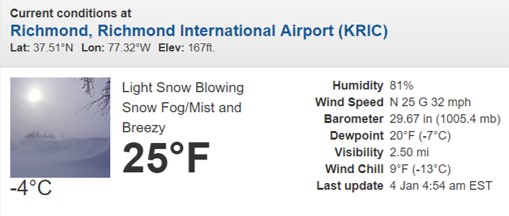
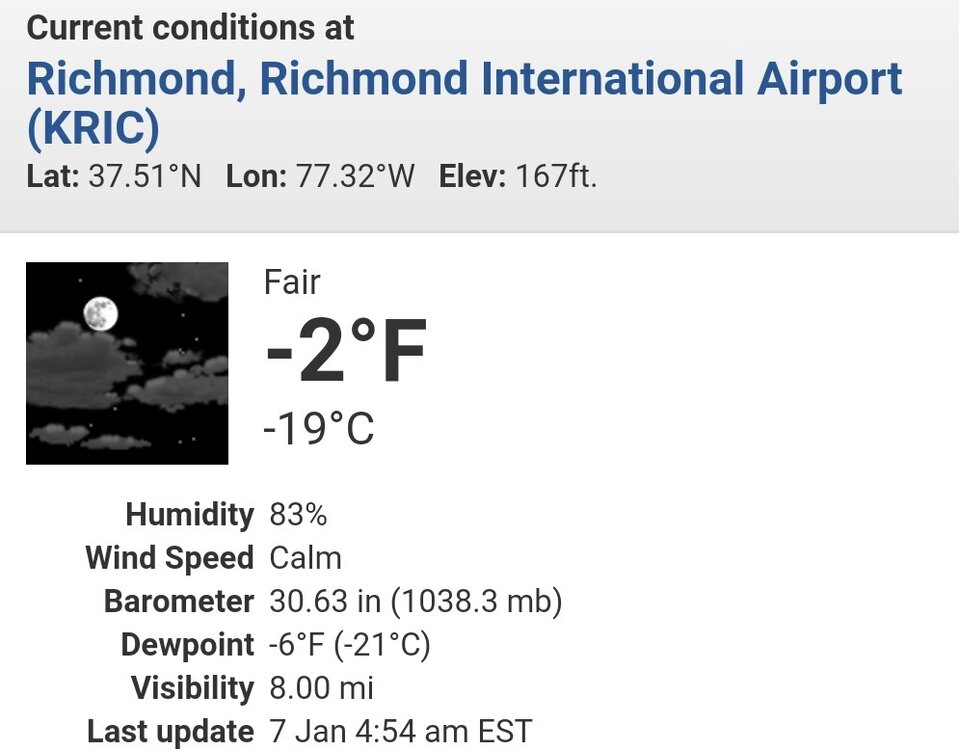
This period featured one of the coldest stretches we have experienced since the winter of 1995-96. On January 7, 2018, the temperature in RIC dropped to -3°F, the first time it had dropped below 0°F since the year 2000. Richmond remained below freezing for four consecutive days, but it would have been eight days in a row had it not been for hitting 34°F one day in the middle. It is worth noting that the most consecutive days below freezing at RIC was twelve days back in the winter of 1935-36.Here are some images I saved.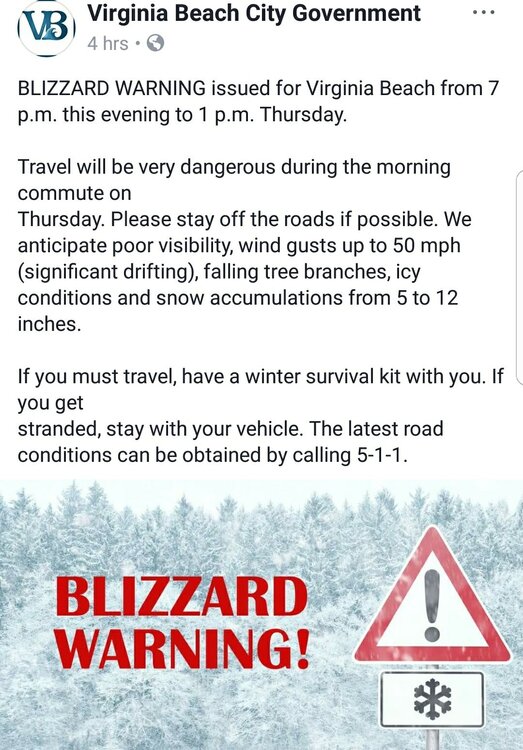
.png.049bc23842577578ba721c6c8079b9c4.png)

Additionally, yesterday marked the anniversary of the January 3, 2002, snowstorm that affected our area. Richmond and Norfolk both experienced a decent snowstorm with 7.7 inches and 7.2 inches of snowfall, respectively. It is noteworthy that this storm occurred during an otherwise mild winter season throughout the east.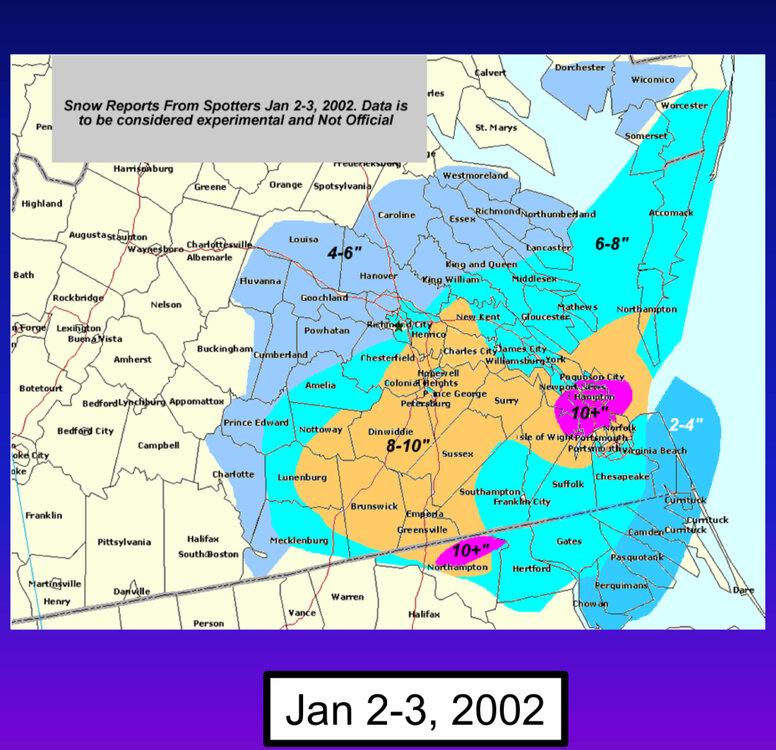
Thanks, if only that would happen again
better than nothing

-
1
-
-
This is a good look. Its dry but cold. Cant have winter storms without this.

-
2
-
-
35 minutes ago, Conway7305 said:
Hopefully by Jan 20ish we start seeing a positive cycle. Here is the PNA forecast graph
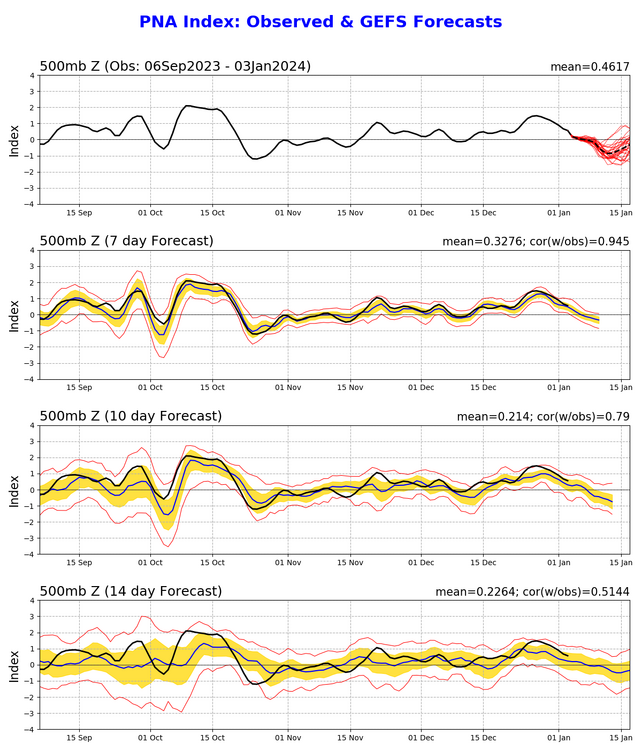
Hopefully it changes on the 20th but on the GFS the cold just can never get here. At least we cant have a january thaw this year. To have a thaw you have to be frozen first.
-
1 hour ago, RIC Airport said:
Below are two maps from the GEFS and EPS.
I like the -NAO consistency. The last time we saw that was years ago. The -NAO is probably preventing us from torching like we did much of last winter. When you flip through the run, you can tell that pesky SE Ridge is just lurking down below Cuba. We also have an active southern stream, another component absent in recent winters.
We need to get rid of the troughing tendency in the West and a better mechanism to deliver cold in the east. Storms tend to cut to the Midwest and Ohio Valley with that orientation. Or indeed, farther north and west than is ideal for I-95. The end of the EPS was better than the GEFS, but certainly no amplified western ridge. We can still get a sneaky event with the right timing and placement of other features, but it complicates things.
There is still plenty of time left, and remember, March IS a snow month, too.GEFS

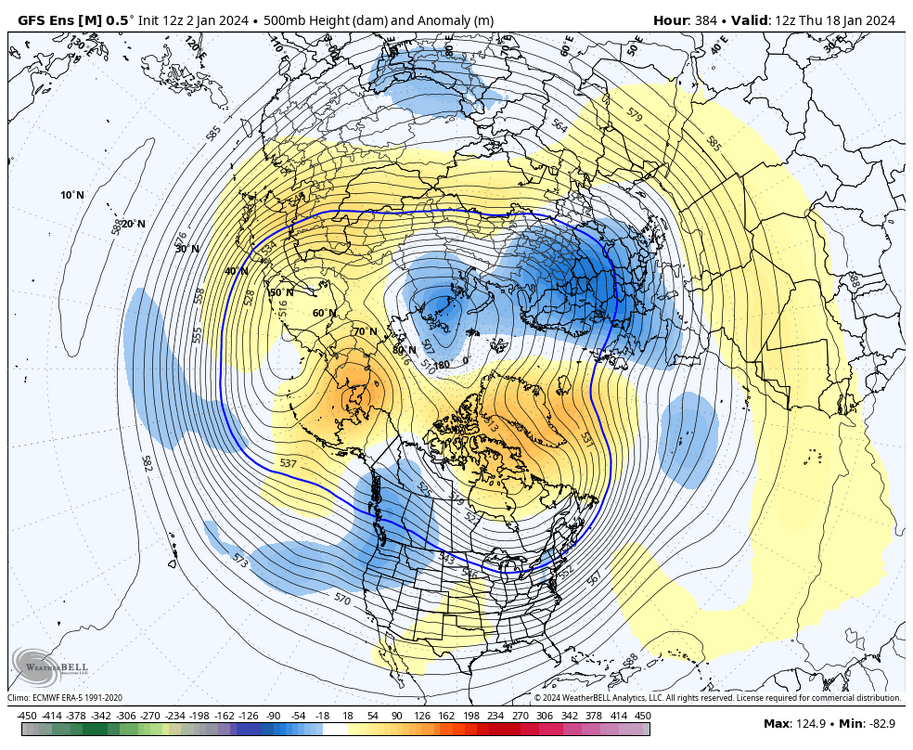
EPS
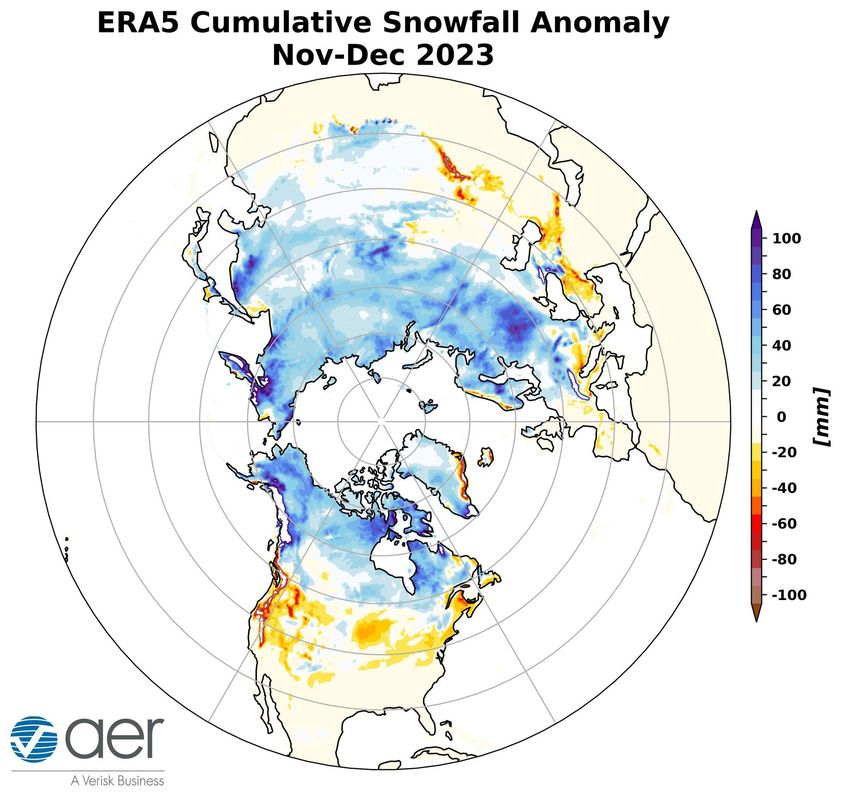
It also doesn't help that the CONUS has not had much snow this winter, which doesn't help build and sustain cold like we've seen in Russia.

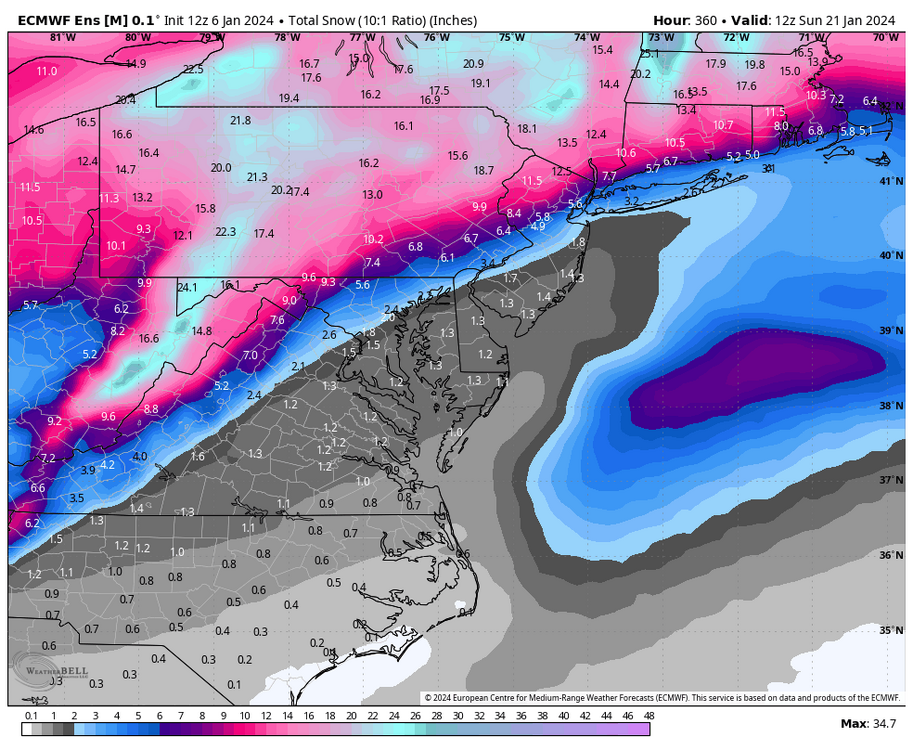
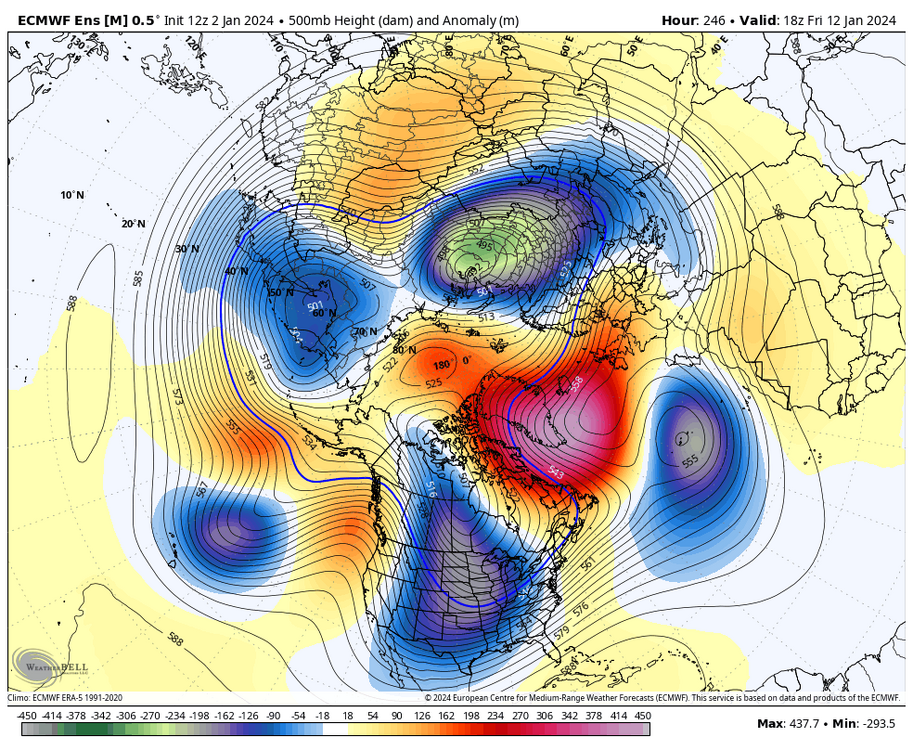
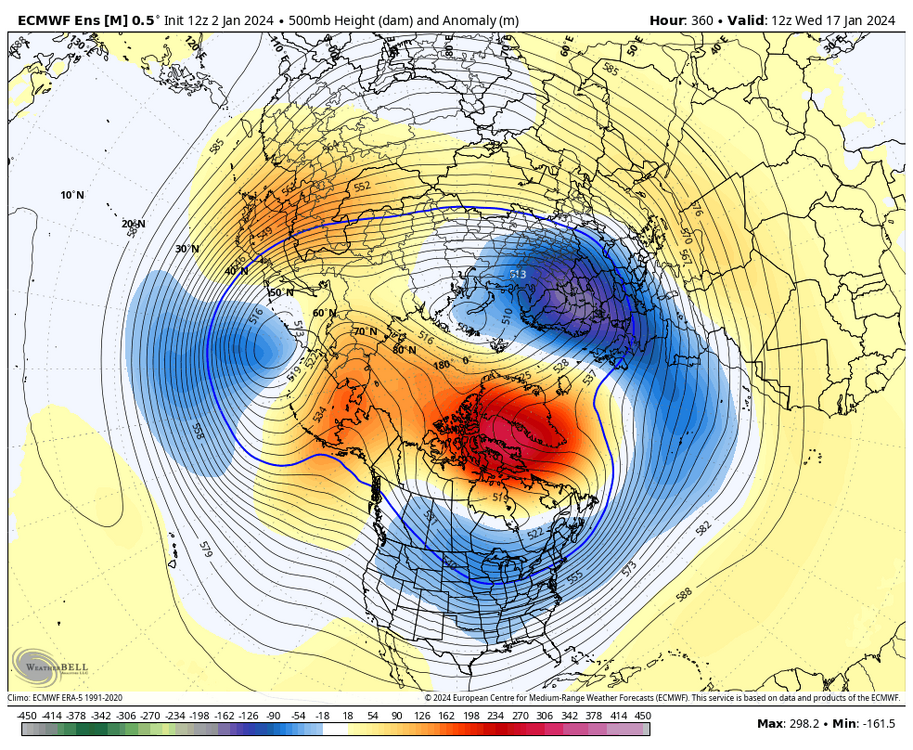
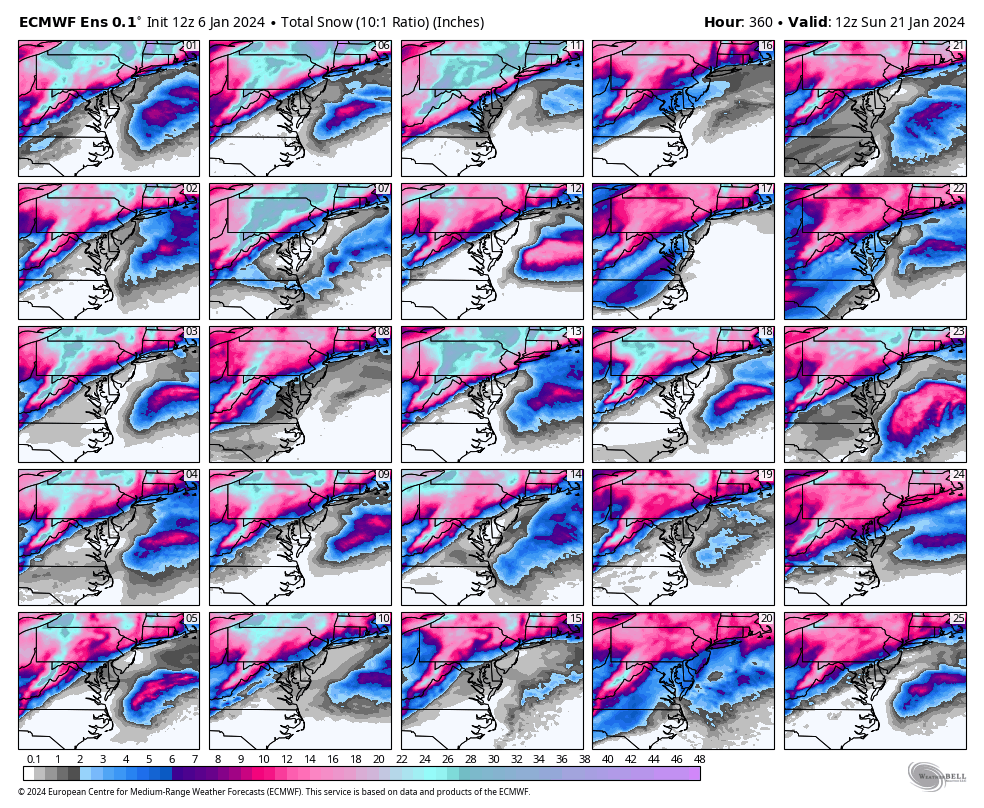
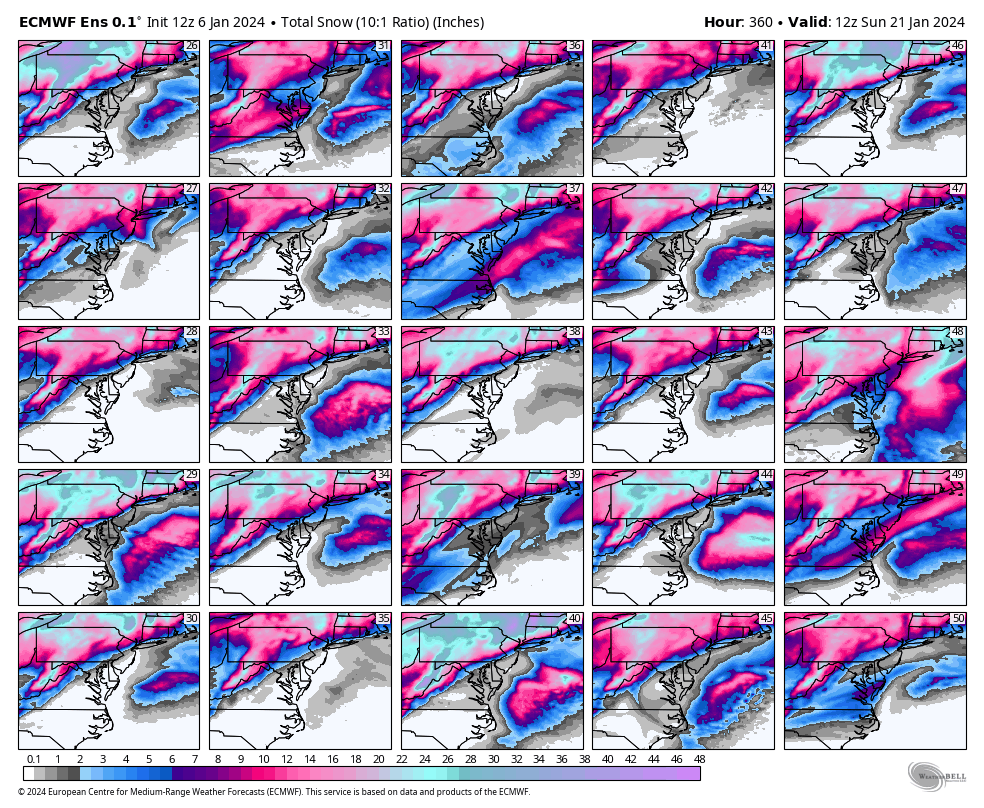
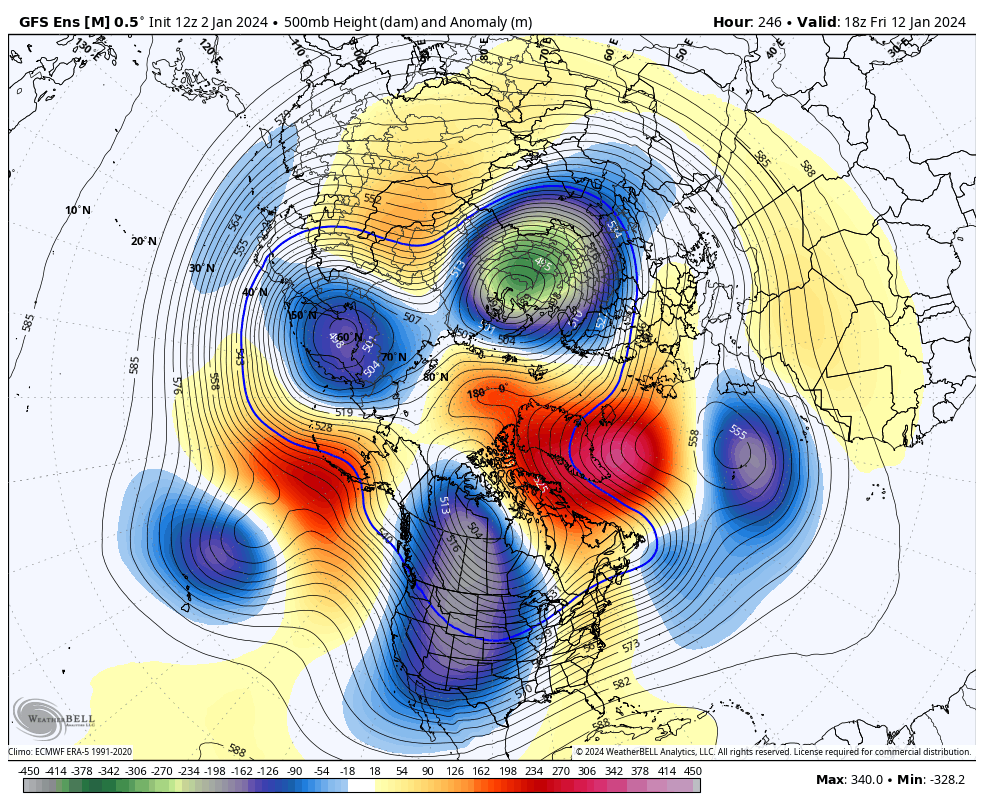
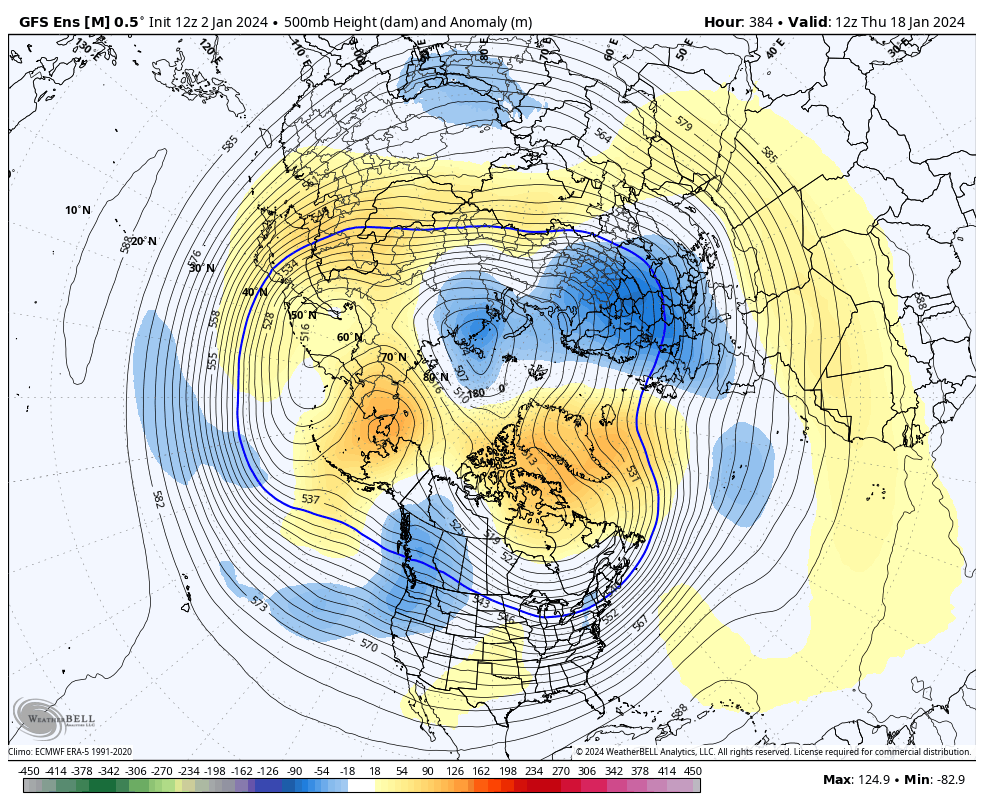
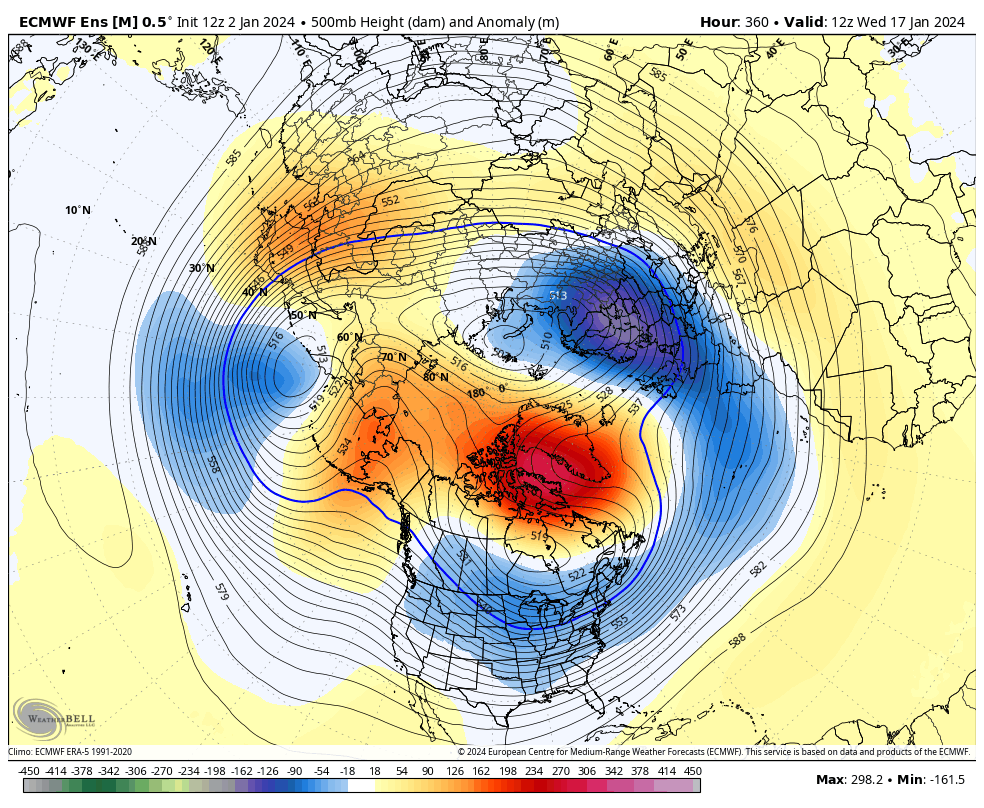
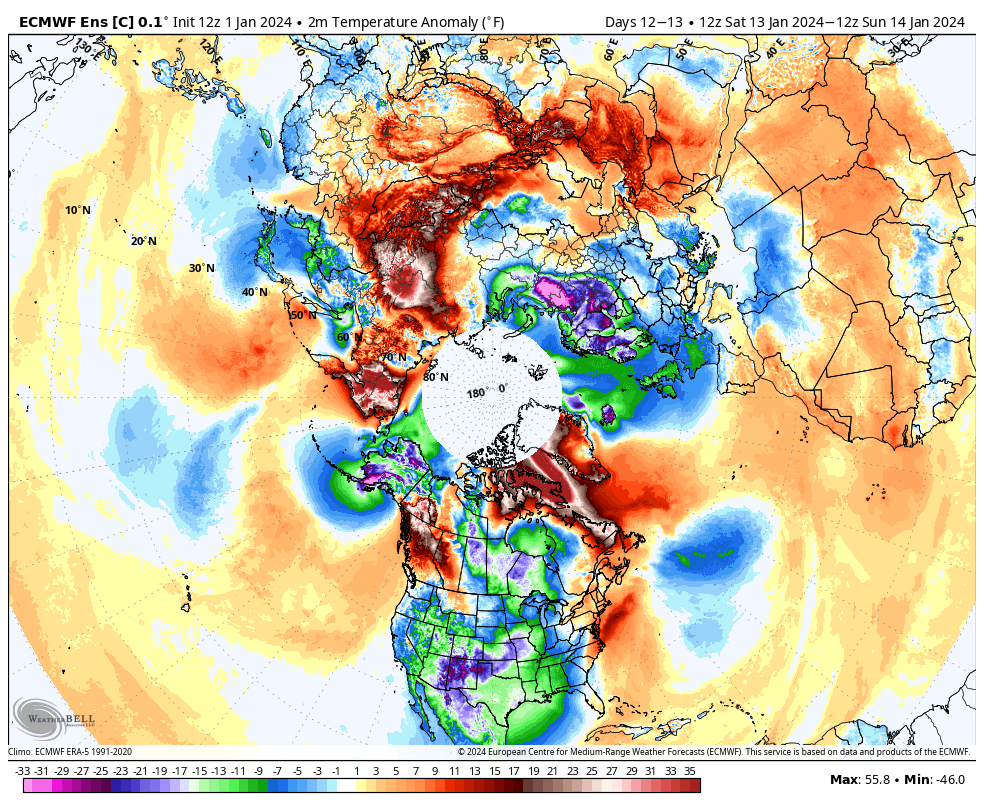
Thats all nice but here we are jan 18 and its seasonally cool with no sign of arctic air taking over for weeks at a time. At some point its going to have to turn cold and stay cold. The euro 360 map doesnt match up with this. And between now and then we will have 2 storms cutting well west of the mountains and we will be talking about severe weather instead of cold

Cutter num 2

-
The perfect pattern will show up in late March and last thru October.
-
1 hour ago, Rhino16 said:
This is over for us. I just don’t see that big of a change in modeling this close to it. Was thinking this yesterday.
The problem with this storm was no cold air. Seasonal isnt good enough here. Here is 1 day after the storm and there is zero cold air behind it. I know the models show cold air coming but it never seems to get here.

-
1
-
-
1 hour ago, wasnow215 said:
Models trending warmer and warmer.
Yea, just no cold air anywhere.
-
Even with this low it never really gets cold after it leaves. I think SEVA is out of the game this winter. Hopefully a storm will have the R/S line east of RIC in JAN/FEB.
2 days later on jan 10 and its in the 60's. Just no cold air

JB posted this about the brutal january pattern. Reminds me of the time texas got brutal cold and it never came east.
-
Hopefully it will trend better for central va,
-
High to the north is gone on the ICON. All rain.

-
Could be big for central va. high 10 mb stronger to the north and low more east

Looking good

Looks like i will be on the line on the ICON

R/S line right over my house lol. Based on the ICON i might get 7 or 0
-
54 minutes ago, tigersaint11 said:
Lot's of great info to unpack from RIC Airport. Thanks for the insight.....I can't help but think all of these s/w's that have been pummeling Central/Eastern VA will eventually run into some cold air. Maybe? Probably?
in 2025 lol. I do hope RVA gets lucky on the 7th.
-
1
-
-
At least the ICON is close to somethng

-
1
-
-
The panic would be less if someone could shut the nozzle on the pacific firehose.


Richmond Metro/Hampton Roads Area Discussion
in Mid Atlantic
Posted
Getting better