

so_whats_happening
-
Posts
1,347 -
Joined
-
Last visited
Content Type
Profiles
Blogs
Forums
American Weather
Media Demo
Store
Gallery
Posts posted by so_whats_happening
-
-
Just now, Terpeast said:
So a 0% significance means that there is a 100% confidence level that warmer eastern US temp anomalies arise not from random chance, but from the mjo phase 6?
if that’s the case, I’m not a fan of the way they use these significance #s. It’s confusing
Yea pretty much if you scroll over at the top and do the different percentages that is a better way of looking at it. Basically if it is in purple it should end up warm or cold depending on the trimonthly and phase. Of course it should probably read a little less because of other random factors that get involved.
-
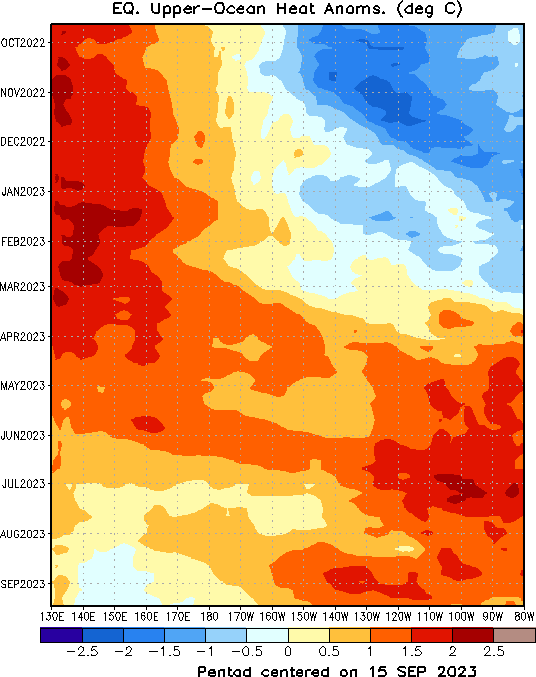
Latest update on Subsurface
.thumb.gif.88f3c6422cb8e837abfb6da951934df8.gif)
-
7 hours ago, Terpeast said:
Looking at phase 6, what does the 0% significance mean?
6 hours ago, GaWx said:I don’t know what the 0% significance means on any of the maps. I got these maps from this website:
https://www.daculaweather.com/4_mjo_phase_forecast.php#thumb
https://www.cpc.ncep.noaa.gov/products/precip/CWlink/MJO/Composites/Temperature/readme.shtml
This is the main site: https://www.cpc.ncep.noaa.gov/products/precip/CWlink/MJO/Composites/Temperature/
Go down a little and you will find this:
-
Dc. +1.6
Nyc +1.4
Bos +1.7
Ord +2.3
Iah +1.2
Atl +1.3
Den +1
Phx +.8
Sea +1.1
Late entry at 9:40am
-
New update to the subsurface. Ill keep saving into October but wont have much time to post have some busy days coming up here will do so when I get a free chance again.

-
5 hours ago, snowman19 said:
Here it comes!! “Interesting to see the MJO finally gaining some oomph for the first half of October, we'll have to see if this comes to pass.”
See: https://x.com/met4castuk/status/1707331586897715477?s=46&t=NChJQK9_PUjA1K7D2SMojw
And the +IOD gaining even more strength…Conveniently leaving out the rest of the quote does not make this post any better man. I thought the whole idea of a strong/super el nino was to not rely on the large amplification mjo waves to help produce results. Nino should have already been able to do so?
Btw i dont think anyone has denied the idea that another round of warming would come, it was always a matter of when and how intense. I have been mentioning for a while the time pattern would suggest mid to late october from back in early september when were having a similar talk.
Going to be very interesting to see what happens as trades look to continue to hold a cap on things through the first week of October, maybe longer?
-
5 hours ago, griteater said:
Paul Roundy has spoken...
Wow if that was not the best example of someone copying anothers thoughts then i dont know what would be better... kinda wild!
-
 5
5
-
-
13 hours ago, mitchnick said:
I posted this yesterday. Waters around Japan cooling rapidly as of 9/25, so no reason to worry about that yet imho.
.gif.27f4211fdc47e31aa7ddbef74c3e1e61.gif)
This has actually been hit quite a few times by rather strong cooling episodes and has been rather resistant for most of the summer, so we shall see. Feel we need a significant typhoon to move through that region to really stir things up. Slow moving would be the best.
-
5 minutes ago, so_whats_happening said:
I will say he isn't just saying it for nothing, probably not the best way to approach it but here nor there.
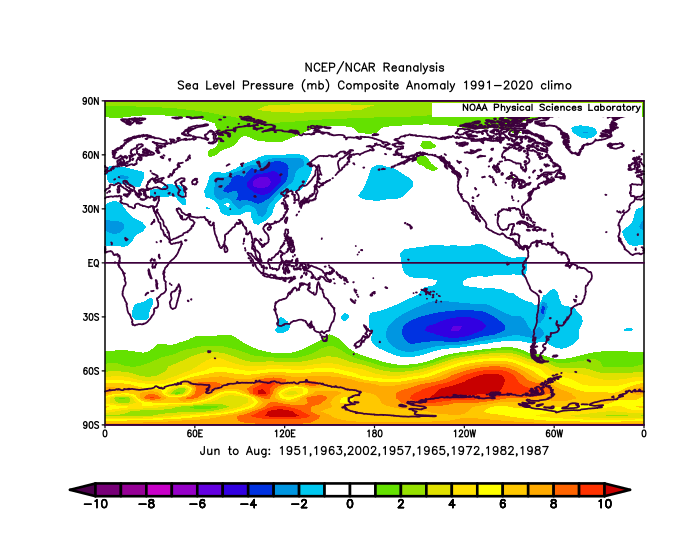
Nino 3.4 correlation to SLP for June through August and each particular warm ENSO event with weak, moderate, strong, and super events during the summer time period.
Edit: It goes moderate, strong, super, weak in descending order

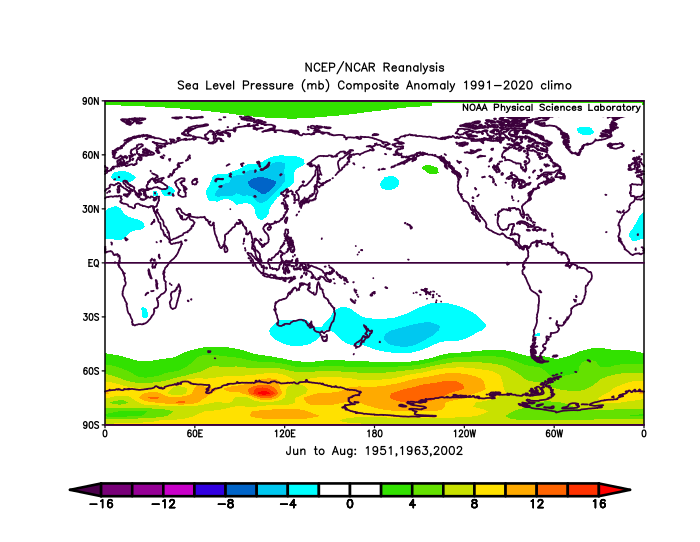


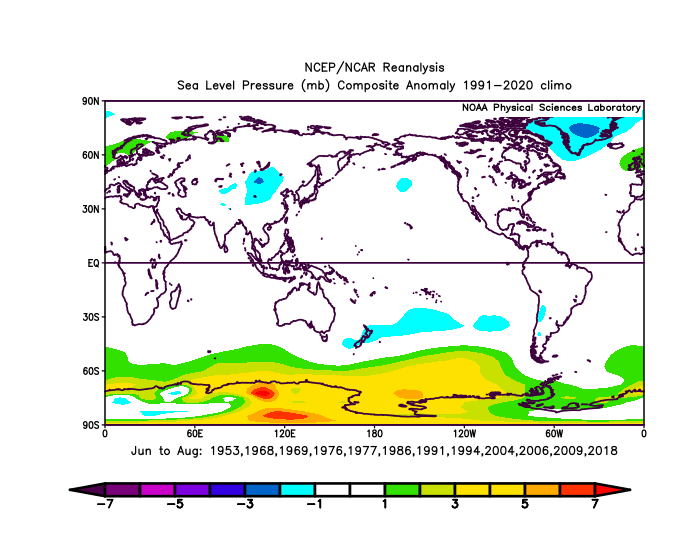
Here is 2023
Technically if we are basing it off of ONI we are in moderate to strong territory for the summer I made a composite of mod-strong years at this time of year.

-
41 minutes ago, brooklynwx99 said:
and nobody is saying that the forcing is impacting summer ground conditions. it’s comparing the upper level forcing from previous super events to the one now and realizing that things are different
that has value, regardless of if you believe you’re just smarter than everyone else here
I will say he isn't just saying it for nothing, probably not the best way to approach it but here nor there.
Nino 3.4 correlation to SLP for June through August and each particular warm ENSO event with weak, moderate, strong, and super events during the summer time period.
Edit: It goes moderate, strong, super, weak in descending order
-
Woof someone is angry for some reason.
Anyway CPC did actually update on the subsurface and this gives us a much broader look.
-
1
-
-
As always thanks for this Roger. Sorry I have been removed a bit from doing these it has been quite a busy few months dealing with work (the 1st comes and goes real quick!). I should hopefully be able to finish out the rest of the year.
-
 1
1
-
-
2 minutes ago, bluewave said:
While the CFS may be exaggerated in its decline, the drop in OHC may be we we see the slight decline and leveling off effect. Not many cases to draw from with and OHC decline from 1.4 in June to under +1.0 in late September. Not sure how much warmer we can get with a break in momentum like this.

Yea CFS does seem off it does seem like it is trying to capture the real time situation but going a bit too much. If I remember correctly, I would have to look back in the pages to find it, but I do remember some models were having a leveling off around this point they had another bump up as we got to November. Now will this happen honestly no clue but we also don't have many clues yet for how long this current situation will last. We definitely seem to be sloshing the waters in the East/ Eastern Central Pacific quite a bit so it is not unreasonable to think there may a slight uptick in OHC because of this again whether that adds to 3.4 and other regions is something that will need to be watched.
As you posted the U anom map earlier I don't see a WWB event propagating east or west showing up yet as we have seen in the past couple of months. We do not see the EPAC firing off any more hurricanes so that season is probably done, this helped aid in some west propagating minor WWB events some coincided with the WPAC event and constructively worked together. So it remains that status quo is probably the best idea for now but lack of any events will ultimately eat up heat content until such an event can help re-enforce a warming timeframe. Still have been holding onto the idea for awhile now that end of October may feature such an event to re-establish itself but that remains to be seen. The September event that was talked about has failed and models just didn't quite get it right.
Either way we definitely have slowed momentum for the time being let us see what happens in the next 2-3 weeks as that will definitely tell us a lot going forward.
-
11 minutes ago, GaWx said:
I saw that as that area is cooler than it had been. However, note that the sub-0C portion that has been located 125-300 m depth from 130 to 180W as of the 9/19 five day map warmed rather substantially/diminished in volume from the through the final map after having cooled substantially from the start til then. I expect that portion in itself will have a notable impact on the overall average OHC warming in addition to the notable warming near 120W.
I get that and maybe it is just me but I tend to see that region under 200m (between 200-300m) as rather negligible as there tends to not be too much change that occurs at those levels on the positive or negative side of things.
We should get a better sense by the end of the month what is happening.
-
Latest SST anomaly 30 day animation
Near Japan has taken a bit of a hit in the recent week or two, west coast of the US also cooling a bit. Western IOD holding its own for now but some areas around the maritime continent are warming a bit. WPAC along the equator still not seeing decent surface or subsurface cooling while the EPAC has in fact cooled since the August time frame.
Would like to see a more La Nina like tongue in the Atlantic Equatorial region and cooling of the WPAC to go on the idea of a more canonical El Nino stance SST wise. Nothing MJO wise through at least the first week of October is showing up and when it does it is rather weak in 4-5-6 lets see if this changes coming up as we get to mid month of October.
MJO forecast from various models: https://www.cpc.ncep.noaa.gov/products/precip/CWlink/MJO/CLIVAR/clivar_wh.shtml
-
1
-
-
12 minutes ago, GaWx said:
After looking at this great animation, which goes up to the 5 day period centered on Sep 23, I feel pretty confident that the next 180-100W OHC graph that I post will finally be warmer and with possibly enough warming to make it somewhat noteworthy. The last one available goes only through ~9/18. Thus your animation goes out five days further and allows me to get a feel for its next update.
Maybe but notice the area west of the warmest anomalies has shrunk over time not to say those warm anomalies can not accomplish a similar thing to back in late August early September. If we are to see OHC rise it would need to be an expansion of the warm anomalies in the eastern portion and a deepening of the thermocline much more than it is especially folks who expect this to go to around 2C for OHC.
-
Latest update on subsurface while the region around 120W has seen some warming of anomalies we have overall decreased the coverage of warmth across the area from 100-180 over the last few weeks.
In order to push back up to those levels in August we need another decent WWB event and associated KW. Otherwise we will just continue to use up the subsurface heat to maintain status quo. Unfortunately CPC has not updated yet and expect sometime next week for this to happen.

-
1
-
-
5 hours ago, griteater said:
VP image for Mar 19 to Jun 19 of this year. Uplift max in W Pac / Subsidence max in C Amer
VP image for Jun 19 to Sep 19 of this year. Uplift max W of Dateline / Subsidence max in far E Pac and W Indian Ocean
VP image for Jun to Sep for Strong and Super Ninos (ONI) since 1980. Uplift max E of Dateline / Subsidence max in Indonesia
VP image for Jun to Sep for Moderate Ninos (ONI) since 1980. Uplift max near and E of Dateline / Subsidence max in Indonesia and Far E Indian Ocean
VP image for Jun to Sep for Weak Ninos (ONI) since 1980. Uplift max near and E of Dateline / Subsidence max in Far W Indian Ocean and E Africa
VP image for subsequent winter (Nov to Feb) for the same Weak Ninos (ONI) since 1980. Uplift max near Dateline and Indian Ocean / Subsidence max in the Caribbean
Bottom Lines:
1. The low frequency VP pattern (3 months or more) this year hasn't changed much going back to March.
2. The Jun to Sep VP pattern this year is most similar to Weak El Ninos (ONI) when comparing with all El Ninos since 1980.
3. My guess is that the low frequency VP pattern this winter will be similar to the Weak El Nino winter composite with an uplift max along the Dateline and a subsidence max in the Carribean and South America.
4. My guess is that the MJO will become more active this winter and will play a substantial role in the subseasonal / monthly pattern
5. The persistent and strong subsidence region over C America / Carribean / Gulf of Mexico this year is noteworthy and may have contributed to the extensive summer warmth in AZ/NM/TX/LA.
This does seem to be the case for this Nino, in past Nino events we don't often see the stronger subsidence in this region it tends to be weaker and further displaced into SA and tropical Atlantic while the stronger subsidence tends to be more located in the maritime region. I would have to look at past years with similar stronger subsidence regardless of ENSO state to see if we had similar results to that. Maybe a project for the rainy day tomorrow.
3 hours ago, ORH_wxman said:Here is 2001-2015 winter temps compared to the previous 15 years....climate change was happening during all of this, yet much of the central and eastern US was colder in the mean. We wouldn't claim it is due to global cooling...we would claim it is due to natural variation on top of the underlying warming trend....it happened to overwhelm it during that period relative to the previous 15 years.
So yeah, it's not unreasonable at all to say that some of the warming the northeast has seen since 2015 is due to natural variation putting us in a more unfavorable pattern. I also reject that the pattern becomes more permanent. But we'll see. Maybe this is the one that actually does and all the others that failed to stay consistent (warm blobs, -AO due to sea ice, etc) were just flawed research.
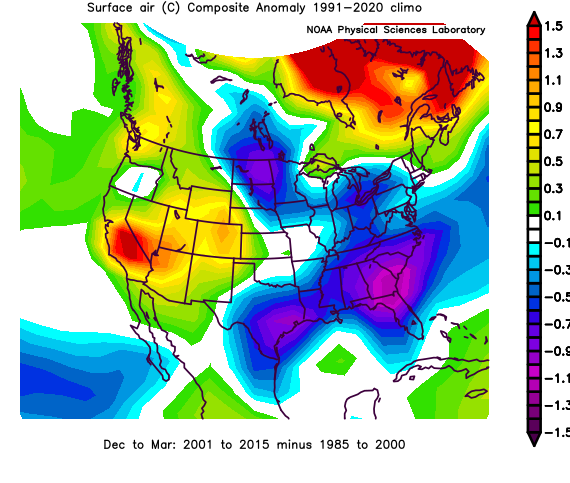
How would this compare to a different climo baseline? Just curious if these changes occur differently in say the 1981-2010 or 1971-2000 base lines. It would make sense for earlier times to look cooler based on a much higher climo baseline than previous. Basically the signatures may still be there but not as extreme?
-
48 minutes ago, raindancewx said:
Looking back, there are actually quite a few stronger El Ninos with active hurricane seasons in September. Another silly example of forcing not being used correctly to me.
We're at about 65 ACE, and it will grow somewhat more with the storm to hit the Carolinas. A bit ahead of the most active El Ninos in the previous warm AMO cycle. But not dramatically. Most of you seem wedded to the idea that years like 1965 and 1957 were well coupled El Ninos, but of course, the 30-year average ACE in September for 1935-64 is something like 44. The 1991-2020 average is more like 60-ish. So we're not even as far above the recent average as those older strong El Ninos like 1957 and 1965 that I think everyone agrees are well coupled in other ways. A lot of El Ninos actually have pretty impressive early season hurricanes and total activity, call it June-September, and then die prematurely in October from what I can see.
https://psl.noaa.gov/gcos_wgsp/Timeseries/Hurricane/hurr.atl.ace.data
1951: 57.8 ACE in September
1953: 58.6 ACE in September
1957: 63.7 ACE in September
1965: 60.9 ACE in September
2002: 46.8 ACE in September
2003: 111.1 ACE in September (if considered an El Nino)
2004: 155.0 ACE in September
2006: 59.6 ACE in September
2018: 72.8 ACE in September
2019: 93.4 ACE in September
Happen to have one for the EPAC and WPAC? Also there at least looks to be another hurricane on the horizon for the last week of the month. After that is anybody's guess.
-
On 6/14/2023 at 3:59 PM, so_whats_happening said:
Honestly will have to wait and see. We might not get a reaction until July which a few days is semantics of course. We also need to see just how influential the WWB will actually be. If we take this last one for example which was still a rather impressive event we rose a solid .5 degree not shabby at all but since have cooled that area by half the warming that occurred. Im still hesitant on going anything above 2C as that would require more robust WWB events and an actual dislodging of the subsurface warm pool. We have about 4 months until we hit peak typically seen with El Nino events. At the rate we have been going it has been about .3C increase each month since February. If this rate continues we look to be about .9-1.2 for July average, 1.2-1.5 August, 1.5-1.8 for September average and maybe if we arent on the cooler side of things pushing near 2C in October. Thoughts are definitely pinned around 1.7-1.8C in 3.4 currently so while we push into strong territory the atmospheric response may be more on the moderate Nino side of things. We seem to be on the 30 day kick for WWB events with larger pushes happening every 80-90 days (late february/early march and late may).
Lets see how it goes.
While looking for pictures to save in my folder I stumbled upon this doesn't seem it has strayed too far off the idea. I don't have monthly numbers but judging where we are now we have pushed into the middle of the ranges compared to the lower end back in June/July area.
Lets see what it can muster up here in the next 1-2 months. Totally based this thought on the idea of an October peak looks likely still a November peak but will have to wait and see. Looks like my monthly thought in the other thread of 1.6 for October may be a bit off depending on how things shake out.
-
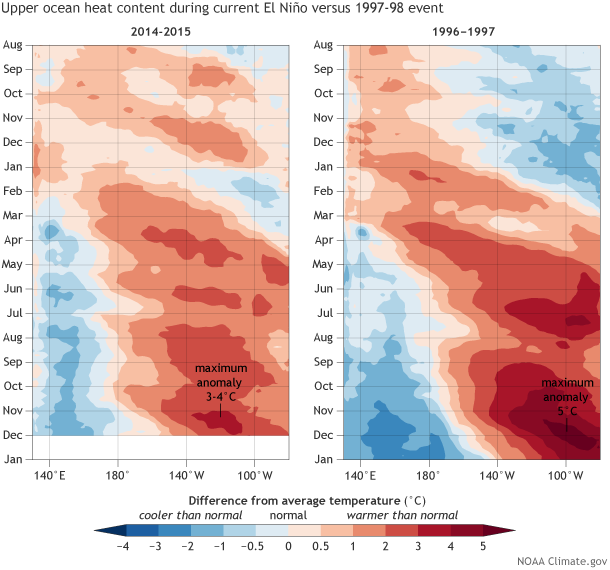
25 minutes ago, snowman19 said:
I agree and people can say how weak this El Niño is all they want….fact is Nino 3.4 has risen +2.5C in 10 months, that is pretty incredible: https://x.com/WorldClimateSvc/status/1704929580614594969?s=20I mean yea it is impressive but it also has been done before, unfortunately this year does not have the amount of crazy KW/ WWB events to allow the subsurface to take it to that upper echelon like 1997 and 2015. Unless we see a rather shocking change of events come about we probably won't hit much of those upper levels that some models are showing. Still got a solid month though.
-
4 hours ago, bluewave said:
Yeah, my guess is that is why the CFS thinks the El Niño is peaking now and doesn’t show the typical increase that we usually get in the late fall. Not that the CFS or any of these seasonal models are that great since they just seem to repeat the initial conditions. But it is enough for the CPC to mention with all the other model data in their latest weekly update. If the El Niño doesn’t get much stronger or just levels off instead of declining, then the MEI may not get much above the weak to maybe moderate range. Our winter forecast could again come down to competing influences with perhaps a mix of Nino-like and La Niña elements. So getting a -AO and +PNA will be necessary as an insurance policy if the tropical forcing becomes more variable.

Maybe? Unfortunately I have not followed much about how models have been predicting things over the spring and summer other than what is posted on here. There have been a few instances in which the 3.4 region has peaked early, but im not sold yet that has occurred this go around. Almost feel like what may happen is overall rate of warming may be slowing a bit and subsurface continues to slosh around helping sustain things, maybe we poke close to 2C for a month but at this point I would bet the under to come to fruition.
If we do indeed see any bit of cooling occur in 3.4 over the next 2-3 weeks we can safely assume we probably are damn near peak. The lack of anything showing up in long range is rather interesting to watch unfold though, have yet to see the typical westerly anomalies show up in the eastern IO which has been the thing for this season.
Just the very idea that WWB have been originating in the Eastern IO versus maritime/ extreme west Pacific tells me already the forcing is going to be west of the typical El Nino placement.
-
4 hours ago, snowman19 said:
@Gawx @griteater @Bluewave @so_whats_happening @40/70 Benchmark @brooklynwx99 @raindancewx @Terpeast The BOM has just declared that an El Niño is underway and that it is coupling with the atmosphere. It has also declared that a coupled +IOD is underway. Here is the new detailed discussion: http://www.bom.gov.au/climate/enso/
They are expecting a super, trimonthly (NDJ) ONI event, here are the month by month graphs: http://www.bom.gov.au/climate/model-summary/#region=NINO34&tabs=Pacific-OceanI would assume these values are based off the BOMM/ BOMA model? If so this is the same model that has been having wild MJO swings when we did have MJO activity it showed amplitudes much greater than anything actually occurring and when we had null or very low amplitude for MJO the model was always pushing it to go over to 7-8-1-2 region with moderate amplitude when we have barely poked out from null most of late spring and summer.
I respect BOM as they have a great catalogue of information to use and monitor everything within their website instead of going to several different sites for info, but I will say the model has been off by quite a bit all season just as much as the infamous CFS has been off. It is still reasonable to think that models just happened to get this one wrong and that is perfectly fine. Models are meant to be used as guidance for an outcome not certainties for a forecast.
I will personally wait to see how things go but if by mid to late October (which is a little less than month from now) we don't see rather drastic changes having occurred into more persistent WWB events (which are a rather important aspect in El Nino formation and sustainability) to sustain subsurface and surface temps regardless of SOI or IOD connections we can surely look back and say models were a little too overzealous.
What this means for winter well that is anyone's guess as we have very few scenarios with such an occurrence as we have seen.
-
49 minutes ago, GaWx said:
The late August peak was ~Aug 25th, which coincides with the first image in this animation (average of 5 days ending Aug 27th). From then to just about all of the way to the end, this animation mainly shows slow cooling and still doesn’t show any signs of another round of significant rewarming being imminent at the end. In contrast the loops ending in early August clearly showed strong rewarming about to commence, which of course happened. There’s still time (~remainder of autumn) but I’m admittedly saying to myself “hmmm” because I didn’t expect a 3 week long slow cooling/pause along with still no sign of it ending. And now BoA finally cooled significantly for its 3.4 peak and thus joined the cooling vs one month ago runs party although @snowman19correctly pointed out that it’s initialization was too cool.
Yea Ill continue to keep gathering the images and making a gif from them. I honestly wish I had the images from March through now. As of now the WPAC is in steady state no warming or cooling taking place. The EPAC is cooling from some upwelling the expansion of the 2C subsurface temps has been interesting to watch but we seem to be losing that +4 to +5C subsurface again. I don't wanna make the statement that we have peaked in oceanic heat content but going from last year at this time to the peak heat content this year has been about 2.4C change which is impressive if we had been more coupled early on I believe we could have easily been sitting firmly in Super Nino range. I think the best thing to come of this is to maintain SST anomalies as we move into Fall and the early portion of winter. October still to come but at this point September does not show any support for a WWB event to try and start up.
The EPAC hurricane season continues to be dead which is another weird sign for an El Nino in progress. The Atlantic may need to be watched still coming up here as we move into the end of the month early October. As Bluewave has stated there are just too many mixed signals competing right now I guess it goes to say MEI may have the right tune in how things are even with how warm the waters are globally and at the equator. Either way going to be very interesting to see what happens this winter.
Even if we don't get a decent MJO response, which should be the case if we do indeed have a strong ENSO event, I would want to see it weak and over in 8-1-2 not hanging out in 3-4 and null like it has been recently that just helps allow a more Nina like atmosphere take hold. Most forecasts keep it in null at this point to about the first week of October. I personally am not a big fan of using super long range modeling forecasts hence my issues from the wildly large 3.4 peaks many models were showing but the lead up is still important to watch take hold.
I am actually rooting for the Atlantic to have one more hurricane, maybe major, that can knock the waters down more across the West Atlantic. Preferably a Gulf/ Caribbean storm would be great but that leads to landfall issues so do not want it for those individuals.
Latest U wind totals and forecast to the end of the month. These do not typically work out to what is shown but the idea still stands of trades staying put with no westerlies in the IO or Maritime region to potentially start something.
.thumb.gif.47880348a81e12e975263e2bd1580ec0.gif)
.gif.f38346e265088386827f851b58427397.gif)


.gif.3925e9a10ca44dc1431d6eeb5bdbba38.gif)
El Nino 2023-2024
in Weather Forecasting and Discussion
Posted
I made these while at work just to get an idea of what things looked like graphically. I have all other years like weak, moderate, and strong that I can show as well both Nina and Nino.
Basically plotted OHC in the 3 sections (one basin wide, Nino region wide, and one we tend to see more of Nino region 3.4 with edges into 3 and 4 (100W-180)), temp from ERSST monthly for 3.4 and 1+2. I didn't include SOI as that would have really taken away from the graph visually but the monthly numbers can be seen.
Forgot to update 1982/83 with 1+2 but the numbers are there. The 13 and 14 on the graph represent the next year. What I have noticed is that once we cross the OHC we tend to only have about .4-.7 more SST anomaly increase from that crossing point. The only times this has not been the case was from rapid warm-ups after we experienced the crossing. If you want other years Ill post them.