

so_whats_happening
-
Posts
1,581 -
Joined
-
Last visited
Content Type
Profiles
Blogs
Forums
American Weather
Media Demo
Store
Gallery
Posts posted by so_whats_happening
-
-
Was going to wait until tomorrow but I have a busy schedule the next few days, it shouldn't change too much at the end but we seem to be having a buoy issue again. That warmth near the dateline is just not going away.
.thumb.gif.01162ac04a0e95d121ea8466462ea7c5.gif)
-
 3
3
-
-
2 minutes ago, snowman19 said:
Possibly, yes. Then the question becomes the official ERSST, which has been running warmer than the OISST. CRW is over +2.2C FWIW….

Hard to know can't rely on one over another just going to have to wait and see. CRW is too erratic for my liking.
-
1
-
-
11 minutes ago, snowman19 said:
@GaWx Thinking tomorrow’s 3.4 weekly update is +2.1C

The weekly would be from the 20th-27th should average around 2 again.
Dec 21: 2.04
Dec 22: 1.97
Dec 23: 1.91
Dec 24: 1.95
Dec 25: 1.98
Dec 26: 1.99
Dec 27: 2.05
The first weekly into January should feature that 2.1.
-
1
-
-
4 hours ago, mitchnick said:
6z Gfs operational DOES split the pv after a wave 2 hit.
.thumb.png.179d7164bf229927a125892d749bb888.png)
An insanely weak wave 2 response. We need to see this by hr 240 not 384 like we have seen posted several times.
You can see there was a chance but CWB activity on our side of the planet has been rather dismal. We have the SPV in a weakened state but still holding it's own.
-
53 minutes ago, stadiumwave said:
Is anyone familar with the science behind this MJO page?
https://www.meteonetwork.it/models/mjo/
It's showing this for El Nino, JAN, Phase 2:

I see some similarities to the above image with the upcoming pattern.
This for El Nino, JAN Phase 3....this is the one that took me for a loop...it's not bad at all:

This is La Nina, JAN, Phase 3:

Anyone know the accuracy?
Translate it and up at the top you will see the reliability of each by color coding.
-
2
-
-
49 minutes ago, snowman19 said:
It’s about to peak, probably within the next 2 weeks. That DWKW/WWB/-SOI is going to cause one final round of warming in 3.4 and 3 then it’s over. You can already see the subsurface cold starting to buildup in the WPACYea i dont see how this causes anymore warming to occur. Keeping it around the same temp sure but any strengthening doesnt seem likely at this point. This month looks to end fairly close to how november was. Especially if that thermocline breaks in 1+2. We may see a rather quick cooling in the eastern portions and slow decline in western 3.4 and 4.
-
We seem to be having some buoy issues again on TAO so it gives a funky look to everything for the last 3 days. Minor DWKW with this last bout of weak wind burst. The extended wind forecast shows a very Nina like look over the Pacific.
.thumb.gif.6b379063774cc627e6d17b5644528651.gif)

-
1
-
 1
1
-
-
Such a large difference in 1+2 readings from the several sources:
CDAS or Tropical Tidbits: ~+.6
CRW: ~+1
OISST: ~+1.6
The cooling of 1+2 has not reached region 3 yet but should continue as we move into January. Hovering around 2C for both 3.4 and 3 in most data sets, of course except CDAS data. Nino 4 sitting at about 1.5C. With not much in the pipeline showing up we probably sustain most of these for about another 3 weeks or so and of course depending on equatorial winds we may start the descent into a weakening Nino by mid January on through the rest of winter. Luckily it seems as though we won't fall off a cliff. If the OISST weekly comes in at 2C again we should end the month about 2C which should crest us about 1.9C tri monthly for NDJ, again barring no more cooling occurs.
Really hope we can get a neutral year next year instead of hoping right back into Nina status, which would be rather impressive and the only time this has occurred (not quite in the same manner as this) was in the early 70's.
Hope yall have a good holiday season, may post TAO update after Christmas then.
-
2
-
1
-
-
2 hours ago, snowman19 said:
This WWB has trended more impressive….
Not really and those are VP maps which show the lifting going quickly to 1.
-
2
-
-
Found this in my bookmarks from sometime ago. Good read.
-
2
-
4
-
-
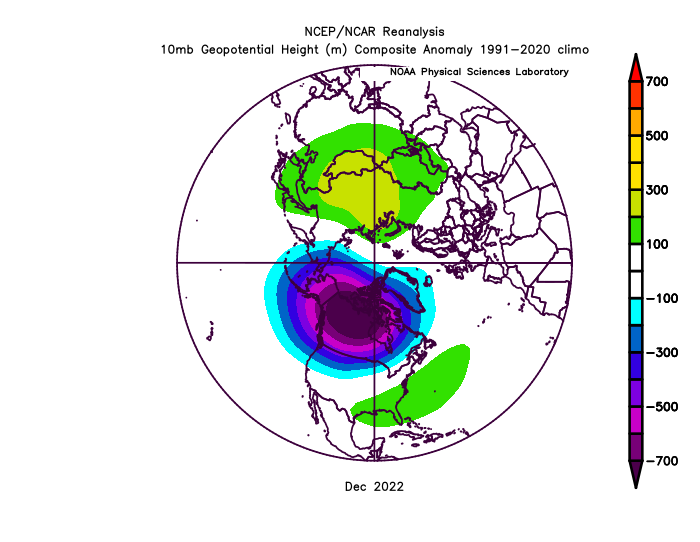
Im honestly unsure about this but looking at how things progressed with the early December warming I would presume at 10mb we would want it more over Eurasia versus Kamchatka/ North Pacific. I included 10mb and 50mb animations. Here was the 500mb during that time frame as well of course we don't get to see the moving parts unless we do a daily gif but you kinda get the gist.
-
1
-
-
TAO through the 19th every 2 days.
Edit: Don't mind the hiccup around the 3rd from about the 2nd-4th there were a few buoys missing from the data.
-
1
-
1
-
-
7 hours ago, GaWx said:
Wow, as @griteaterjust said, this run has by far the weakest SPV/strongest concentration of members with major SSWs of any run for Jan 2-13 with the mean dipping to a mere +3 on Jan 7th vs a climo mean of +33!! The lowest of any day prior to this run was +11 to +12:

It’s impossible to count but I bet there are 40+ just for 1/2-9, easily the most yet. I see ~22 that are extreme (sub -15), by a good margin the highest yet.
By far one of the stronger signals I have seen thus far. Lets see if the models are a little too aggressive at first or if this is the right idea.
-
2
-
-
Btw SOI has been rather positive over the last 2 weeks. 30 day is now above -4 and 90 day is about -8.
-
6 hours ago, 40/70 Benchmark said:
I am so sick of the PV kicking to the other side of the globe....can't we get it to near Hudson Bay just once...ugh.
I mean...
 6 hours ago, Maestrobjwa said:
What mechanism is causing that? (Does it have to do with things just being more difficult overall?)
It is actually a fairly typical Wave 1 response on the SPV typically you have two location of ridging (AK/ Europe) and two locations of troughing in a split (Canada/ Russia Siberia region) with displacements you typically get a ridging pattern like we see near Alaska sometimes we get an erroneous one like last winter across Europe to northern Asia.
Last year was well connected to the 500mb pattern.
-
2
-
-
Latest TAO and CPC subsurface look. TAO im back to doing every 2 days.
Edit: I just noticed the bad data around the 1st to about the 4th on TAO. Looks like some buoys were down during that period giving it a funky look.
.thumb.gif.75a4a0dd02097b94e61f4d28e3224608.gif)
-
2
-
2
-
-
Since the MJO forecasts have weakened considerably we also have weakened the potential WWB event as we head to mid to late month. There is still a little something there but nothing to tip the bucket more as of now. We can definitely see the area around 1+2 may fall even further coming up here. Last I saw was around 1.3 on OISST will have to check with the update later on.

.thumb.gif.e32def16995e125def8159f65fa3d5dc.gif)
.thumb.gif.e5ce01d12a50d3c0169c1eddd4f08c28.gif)
-
1
-
-
17 minutes ago, griteater said:
Nino 3.4 at +1.89 today (as of 12/6)
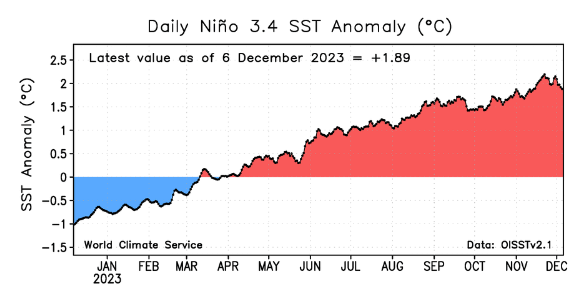
Yea sounds about right with how things are looking right now. Im not sure this will have much impact in December maybe the last week we may see a slight warming? Similar progression to the last one but definitely weaker.

-
2
-
-
1 hour ago, GaWx said:
I absolutely have been saving a bunch of the Euro Weeklies SPV progs. I was the one repeatedly mentioning the can kicking that went on between the Nov 1 and 19th runs. Remember? After that, they suddenly got much more bullish about a weak SPV.
In recent days, I’ve noticed not as weak of an SPV in early to mid Dec as in runs from a few days ago and in late Nov. We have to make sure this won’t turn out to be a mirage just like with all model progs for anything.Today’s isn’t as weak as the three prior runs of 45+% of members with major SSWs. Today it is ~38%. Also, the # of members with a sub -10 is only ~18%. That was way up at ~30% a couple of days ago.
Cool the only reason I asked was to see if the model was overthinking the weakening, which sounds about right given past warming events models go too quick with it. I personally would like to see a strong pass in Phase 5-6-7 to really hammer the SPV but I know it would be a very unwelcomed thing.
-
1
-
-
53 minutes ago, GaWx said:
1. The Nov +PNA means that for only the second time since 1950, there was a +PNA in all of June-Nov. The only other time was 2021. But 2009 was a very close call. I consider +0.25+ a +PNA month.
2. The Nov -NAO means that for only the 3rd time since 1950, there was a -NAO in all of June-Nov. The only other years were 2012 and 2010. I consider -0.25- a -NAO month.
Last year was awfully close to that time frame for PNA, it collapsed toward the end of October. Good it is at least holding up a bit.
-
1 minute ago, Terpeast said:
Judging from the gradients near the dateline, forcing should strengthen around the dateline and then drift a bit east after Dec 17 or so
Potentially that time frame has been changing over the last few days. Couple days ago it showed a strong advance to 3.4 but has backed off. I get the feeling we may in fact have a stronger MJO wave through 6/7 than what is currently modeled but will have to wait probably another week to get a better grasp. Until then I expect the cold to not really filter into the east until the last week of December and that may be generous.
BTW PDO updated yesterday down to -1.79 for November from -2.97 in September. Truly rare territory here even 72-73 warmed the PDO to near neutral for this time period. The only years that managed to be close to this low during an El Nino were 94-95 and 04-05 in the last ~70 years.
-
1
-
-
To get back on topic a bit here is the upcoming look at the WWB there is certainly something there.

-
2
-
-
27 minutes ago, GaWx said:
Again I even gave you a little heart because I read through your discussion I see what you are trying to say. Until we get to the cooler phases which do not happen until the end of the month we will feel the effects of warmth from the warmer phases and even when that happens the dirty work is done and December should still average above outside of the far NE and probably PAC NW. I still do not know what you are trying to refute here from what I said. Phase 7 all amplitudes, including low ones, still offers a warm look in the east for December. Phase 8 has a more neutral tendency which could offer some cool SE look but would just bring averages instead of say +3 to a more +1 to +2 state.
As we carry over to January Phase 8 and 1 show a much colder signal, stronger amplitude would favor a slightly warmer scenario but still cold.
-
1
-
1
-
-
4 minutes ago, bluewave said:
But that isn’t what I said. MJO 8 is still warm during an El Niño but we see improvement with phases 2 and 3 in January. As for the weak SPV this month during the El Niño, all the cold is currently over in Eurasia. So it isn’t doing us any good. Hopefully, we see changes on that front during the winters 2nd half should blocking persist.
This about as classic of a wave 1 response (SPV displacement) as you get. The lack of strong CWB in the Atlantic is hurting the potential of wave 2 pattern popping up at this moment.
-
2
-
.gif.ebbfbb7dd35baff7521b84b8f9f4ff67.gif)
.png.2b89dabe0adffe7f6e5459846d2fdaf2.png)


.gif.a2c548901a43074935f5ab2b03876024.gif)
.gif.0673da8412eb4caaf00fe9e035c1612d.gif)

.gif.f292f60ca58c032690caa382241afcf5.gif)
.gif.744ddb7c26f32049a6c020a1dfc45eb9.gif)
January 2024 temperature forecast contest _ enter by 18z Jan 2nd
in Weather Forecasting and Discussion
Posted
DCA _ NYC _ BOS __ ORD _ ATL _ IAH __ DEN _ PHX _ SEA
+1.4 +1.6 +1.7 -1.3 -.8 -1 -1.2 -1.8 -1.2