

so_whats_happening
-
Posts
1,350 -
Joined
-
Last visited
Content Type
Profiles
Blogs
Forums
American Weather
Media Demo
Store
Gallery
Posts posted by so_whats_happening
-
-
7 minutes ago, CoastalWx said:
IR and radar presentation would seem to argue it’s peaked or close to it. Eastern eyewall looks a little ragged. Western eyewall is a beast.
Yea we blipped to cat 4 so everyone can say it went cat 4 instead of high end 3. Probably has about 2 hours till landfall probably will just maintain status quo at this point.
-
 1
1
-
 1
1
-
-
3 hours ago, Terpeast said:
When I look at the sst map, the entire pac is warm. Even off the west coast. While the -pdo was real this past winter and spring, I’m wondering if neg values in the index today are just an artifact since the west coast waters have warmed up. The map looks more neutral to me, but warm everywhere.
This is due to the excessively warm waters around the area of Japan and extending east. These have yet to cool otherwise we would be in a much closer neutral PDO look. As long as we don't keep re enforcing the ridge pattern out there it should slowly decline in time.
-
1
-
-
Looks like troughing is starting to have an effect. Gotta love a good ocean storm!
Had beautiful structure yesterday.
-
1
-
-
7 minutes ago, Amped said:
Hurricane Ida had a similar pressure 24 hrs from landfall and it easily made Cat4.
I agree including michael they all had similar upbringings. The difference may come down to structure those were near or at hurricane status by the time it was crossing cuba this was still a developing tropical storm. That little bit of difference could easily mean a slightly lower upper value given very similar backgrounds.
-
1
-
-
It is worrisome though that a rather large eye could open up rather quickly this afternoon into the evening during what is usually a nice uptick in thunderstorm activity.
-
21 minutes ago, StormChaser4Life said:
Dr. Greg Kostel on TWC just said they're flying in there now and finding steady pressures. Something is holding Idalia back right now. It's over the Loop Current for the next 12hrs or so where the highest OHC is. If the rapid intensification doesn't occur then, then the lower end of guidance probably going to verify with a strong cat 2 borderline cat 3. Regardless, still going to be a problem where it landfalls with storm surge and obviously destructive winds.
This is definitely a reasonable take structure doesn't seem fully stacked yet. Forward speed may be hindering it a bit since it can't get it structure setup? 3 seems to be the upper limit at this point unless we get heck of a surprise. Definitely trying its best to get organized quick though.
-
1
-
-
8 minutes ago, griteater said:
Aug 22 to 27 TAO subsurface images. Warm 'anomalies' (not means) are building west a bit at the surface, but also, the east-based warming is being reinforced at the surface and at depth...and the thermocline is flattening some with this wave moving east at depth.
This is such an interesting evolution i do wonder if we even get surface cooling or if we just get a subsurface component enough to end the nino.
-
11 minutes ago, snowman19 said:
I only said when it is forecasted to emerge. If you re-read my post didn’t say anything about when it enhances Nino development aside from saying “in September”. I don’t think it takes until the end of September but we’ll seeSo you left it purposely ambiguous... mjo waves take 30-45 days to cycle plus it is emerging in the indian ocean.
-
 1
1
-
-
51 minutes ago, snowman19 said:
The forecasted MJO wave over the western PAC looks real and is projected to gain strength as it moves across in the next several days. This will weaken the trade winds further, serve to initiate a WWB and enhance El Nino development going into September. The BOM’s new international average of models just came out and it has November at +2.2C, December at +2.3C and January at +2.2C, which is obviously weaker than what the new POAMA is showing but that was to be expected
Are you talking about the forecasted emergence around phase 3 next week? Cause that is going to take time and shouldnt have any impact until late september if it does become a wave that is
-
12 minutes ago, turtlehurricane said:
I think it's very likely to hit Category 4-5 intensity. The waters are just absolutely rocket fuel like never before, which is why the convection has been firing non-stop at full power. -- Also it got past Cuba without disruption and actually got way more organized, so now it has a solid 48 hours to rapidly intensify, when all it needs is 24 hours to hit Cat 4-5....
It's not even the best upper level environment ever. It would take alot of wind shear to stop it from going all the way though.
Eye popping out on satellite now. By the morning we will probably have a nice and big drilled-down eye https://weather.cod.edu/satrad/?parms=meso-meso1-13-24-1-50-1&checked=map&colorbar=undefined
It really depends on how well the core can organize itself vertically. Definitely still some slanting going on aloft from the ULL along the Gulf coast. This should weaken a bit in the next day and I believe even some models showed it setting up a jet streak as we get close to landfall. We should know by tomorrow afternoon how well the core is stacked up. I would say cat 3 seems reasonable but if things set up just right cat 4 is attainable (cat 5 intensity is pretty difficult to attain) with the amount energy in place.
Either way fun one to watch and really hope folks do take it serious down in Florida.
-
4
-
-
26 minutes ago, RU848789 said:
Can you elaborate on the physics of why a cyclone would be pulled east, relative to track forecasts, while approaching the west coast of FL? Obviously the track moved east relative to the forecast track with Ian, especially in the last 1-2 days before landfall (which is where we are now), but one could imagine many reasons for such shifts. Thanks.
5 minutes ago, TriPol said:
The trajectory of a tropical cyclone is predominantly governed by the ambient steering flow, a term that encapsulates the mean environmental wind field in which the cyclone is embedded. Deviations in this steering flow, such as an anomalously robust westerly component, can induce a corresponding easterly shift in the cyclone's track. Synoptic-scale anticyclonic systems also exert a significant influence on cyclone trajectory. The spatial orientation and dynamical strength of a high-pressure system situated to the north or northeast of a cyclone can act as a steering mechanism, directing the cyclone on a more westerly course. Conversely, a weakening or lateral displacement of the anticyclonic system may permit a more easterly trajectory for the cyclone. Upper-level atmospheric features, including troughs and ridges, further modulate cyclone tracks. An approaching trough from the westerly direction can effectively "capture" the cyclone, inducing a poleward and often eastward deflection from the originally forecasted path. It's imperative to acknowledge the inherent uncertainties associated with numerical weather prediction models. These uncertainties stem from various sources, including but not limited to, initial condition errors, approximations in the model's physical parameterizations, and the intrinsically chaotic nature of the atmosphere. While the fidelity of these models generally improves as the temporal proximity to the event decreases, unforeseen deviations in the cyclone's track can still manifest. Oceanic parameters, such as sea surface temperatures and underlying currents, can also exert an indirect influence on cyclone trajectory by modulating its intensity. An intensifying cyclone may interact differently with the ambient steering flow and other synoptic to mesoscale features, thereby altering its anticipated path. As the cyclone nears a landmass, the increased surface friction can induce structural changes in the cyclone's inner core, which may, in turn, result in last-minute alterations to its track. Additionally, microscale geographical features, such as bays, inlets, and even expansive urban areas, can impart localized effects on the cyclone's trajectory, although these influences are generally subordinate to the aforementioned larger-scale dynamical factors.This! lol It has to do with pressures and land can produce lower pressures dayside than at night which will cause a low pressure to form over land versus over the ocean even on a small scale. Think of like a fujiwara type of effect interaction of two low pressure areas will cause them to spin around each other and landmasses can often act as the other low pressure to help this until upper levels become too much. Interaction of friction from land mass will also play a role in dragging the system in a certain direction. Remember the main goal is for the atmosphere to balance out so the usual negligible effects of friction become more prevalent in certain situations.
Thanks for taking the time to write this Tripol.
-
5
-
-
Doing this before I forget:
DCA _ NYC _ BOS __ ORD _ ATL _ IAH ___ DEN _ PHX _ SEA
+2.5 +2.1 +2.8 +3.5 +2.1 +1.9 +1.4 +1.6 +1.3
-
12 minutes ago, beanskip said:
Is there some empirical data to support all of these anecdotes about past Gulf storms that ended up east of model projections? If that were a thing, wouldn't there be a study of it or something?
Interaction with land mass will pull the system east or west depending on which side of the storm it is on. In this case Florida should help aid in pulling this further east in time just like it has done with past systems. Ian was an example as most models did have it near Tampa area until it wasn't. This should be the case again where we see probably some of the western most extent currently and then it slide east as we go through time. How much of the big bend gets involved how far north of Tampa it actually hits will all have to be figured out in the next day or so once we get away from land interaction around Cuba.
-
3
-
-
Not sure im seeing May style SOI values (consistently -20 to -30, with large -SOI days) but we do seem to have the troughing setting up just south of Tahiti like I had shown the other week from previous El Nino years. This should help aid in a more consistent -SOI popping up but not sure values will be all that crazy considering the Darwin region doesn't look to have sustained higher pressures, our days of +SOI will definitely more limited though.
The MJO, still rather weak, is now in null and looks to push toward phase 3 by next week. Again if this actually becomes a wave it could lead to another bout of warming toward the mid to late September time frame but in between we will be playing with the wake of the MJO wave and enhanced trades. This will definitely keep a lid on things for the next two weeks maybe even cool some areas a little. From when we have enhanced trades over much of 3/3.4/4 from past situations over summer we see some warming occur in 1+2 which should occur again coming up here.
You can see the change in orientation of the monthly from July to the end of August. Depth of the warmth has waned a bit over the far eastern pacific while depth in the central Pac has grown between 120-160W, which has led to an increase in OHC, and the pocket of 5C has weakened a bit and does look to be moving westward a bit. I still would really like to see cooling of the subsurface/surface in the WPAC.
EPAC seems rather quiet for this time of year and being in an El Nino year. Atlantic may have another storm or two after idalia before it shuts down for a bit with the MJO wave moving into the Indian Ocean WPAC looks to get some action with -VP still pretty far west; long range is showing a push to Dateline -VP by mid September. The caveat is this has been shown in long range for quite some time over the summer and has yet to happen but with the changes in the south pacific maybe just maybe we start to push it out of the maritime continent area. This really is all dependent on this MJO actually waking up.
-
8
-
-
6 hours ago, bluewave said:
While several ENSO models are going super, the subsurface is still much less impressive than at this point in 2015 and 1997. I know it’s only a small sample size of two. But the current upper ocean heat content near +1 is much lower than the +2 values those years at this time. So not sure how we get to super status without the upper ocean heat doubling from +1 to +2. Not really seeing that yet with the trades returning and the WPAC forcing to start September. Right now looks like 1+2 may have peaked and 3, 3.4, and 4 will continue a slow but steady climb as the SST departures work west. This year could be a candidate for an early peaking event should the follow up kelvin wave activity remain as weak as it has been. Also note the lack of a WPAC cold pool which helped development in 1997 and 2016 with the very impressive WWB activity near the Dateline which has been missing this year.


I think the key to how warm we get may be what we see occur in nino 3 over the next month or so. It surely wont be on the same levels as 1+2 has been but just how warm that region gets will have influence on 3.4 as we go along. Again barring no major KW event happens and if one does occur just how much subsurface heating takes place? Still thinking maybe 1.7 trimonthly max with a month that can squeeze out 2.0, should be an interesting 2-3 months coming up as by November things should be pretty much settled.
I forgot what page I mentioned it on but had thought progression for each month was about 0.3C increase and so far it has held true. So back at the beginning of June I mentioned it was about a .9-1.0C in 3.4 so to keep on track it would have to go 1.2-1.3 July, 1.5-1.6 August, 1.8-1.9 September, with a peak in October around 2C then a slow demise.(Im not sure August may hit those levels though) I still can't fathom how we are to get to 2.2-2.5C if we don't pick up the pace. Dynamical models were the upper levels 2.0-2.5 range while statistical were around 1.2-1.4C in between seems to be the right path. Even if we do get to a monthly of 2C will we really have the same impact of 2C or will the impact be less.
I wanna wait until we see maybe some MJO activity outside of near null. There is a distinct possibility that we have a brief cooling to rise again and maybe have a later peak (closer to December) which if that is the case it could very well work in favor for some fun. That would be a very 2009-10 esq scenario.
-
4
-
-
5 hours ago, griteater said:
Update to TAO loop (in 10-day increments). Some downwelling warmth moving in on the latest image
Yea i have this feeling we may have peaked in 1+2, until the nino dies which we may revisit those upper numbers again toward end of winter. It looks as though a solid bout of trades picks up again to close out the month as the weak mjo wave moves. Given this i dont expect another warming progression until mid to late september at the earliest. Let us see how everything holds up.
We still dont have the -surface/subsurface across much of the WPAC yet. So in true nino fashion i expect at least one more big KW before we may peak out in October, maybe November depending on timing. I dont expect a quick demise after this but that will have to be worked out closer to when this progression happens.
-
1
-
-
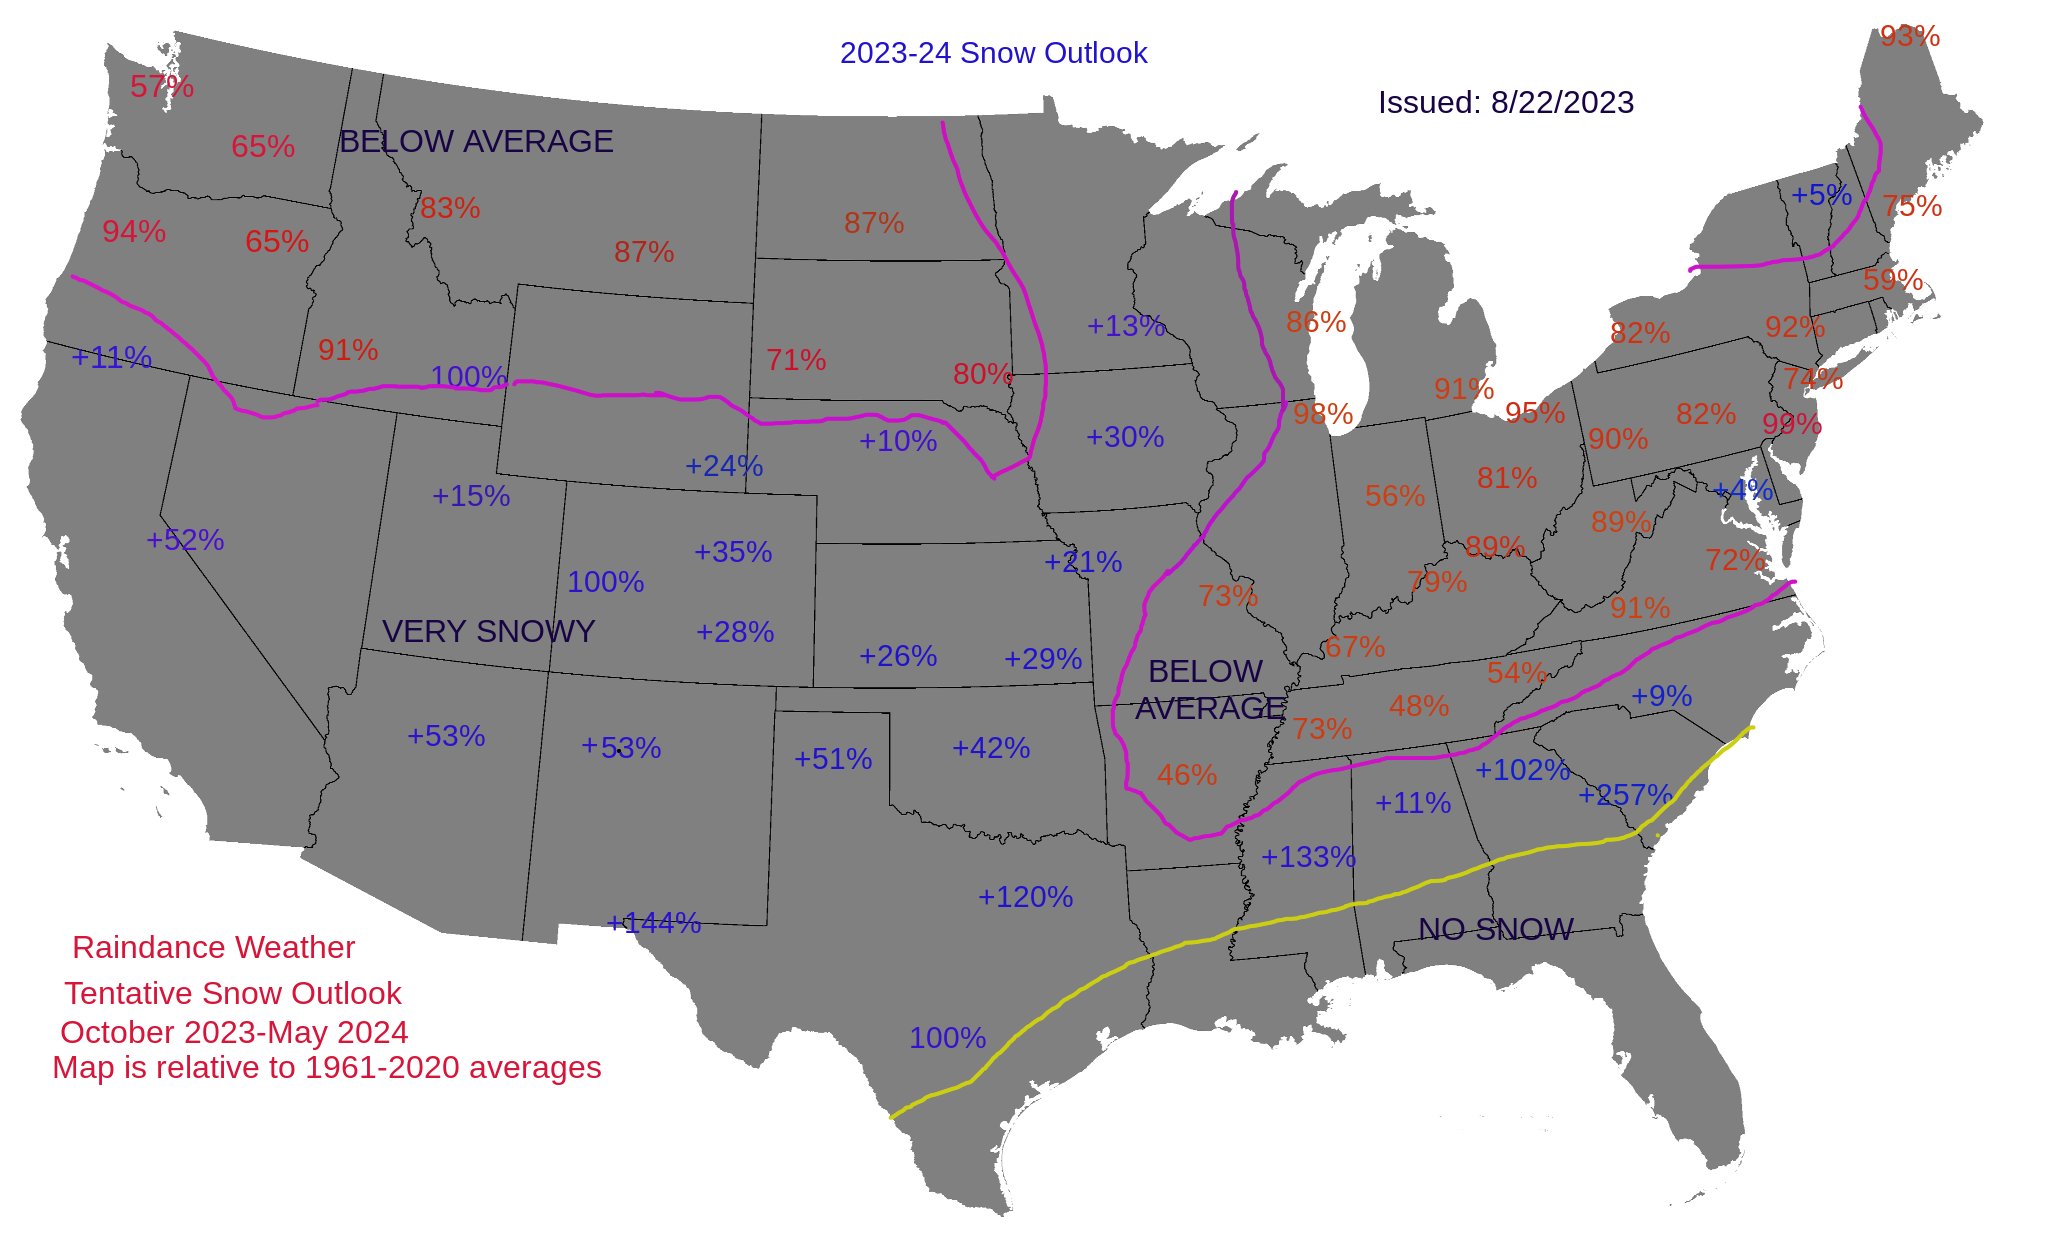
1 hour ago, raindancewx said:
I may update this later. But I'm actually most confident in the snow aspect of the coming cold season. The red numbers are % of the 1961-2020 Oct-May snow average for a spot, and below average. If you see a +Blue% that is the % above the 60-year average you should finish (i.e. +15%, if average is 20 inches = 23").
The blue numbers that say 100% (Grand Junction as an example) without + are forecast to be exactly average. I have the analogs behind this map, but I don't have a weighting I like yet, so not posting them for now.
Seems as though you expect a lot of SE/east coast ridging, if we happen to get the hurricane season in full force the next month and half would the percentages swing at all?
-
2 hours ago, bluewave said:
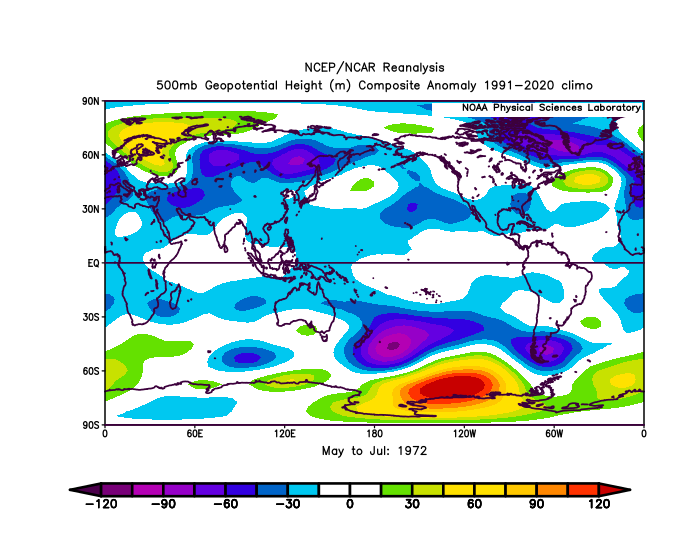
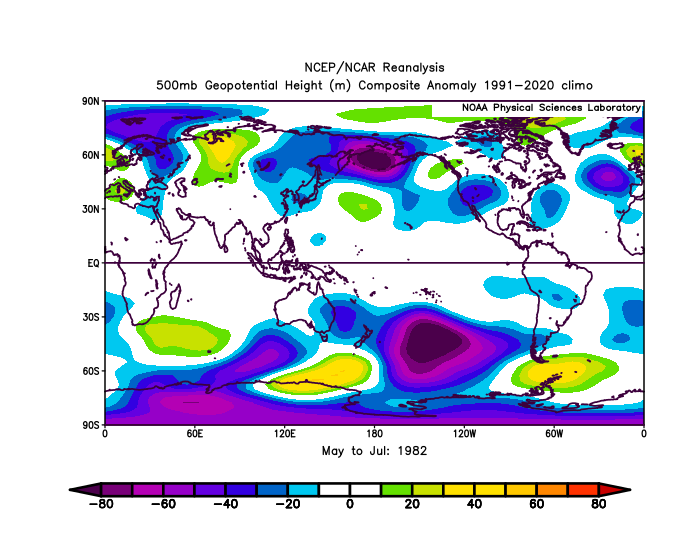
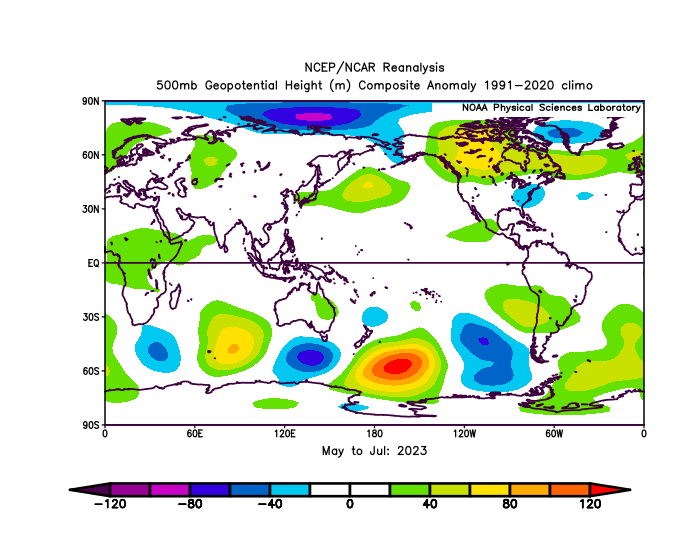
It seems like the historic marine heatwave near Japan is inhibiting the PDO from going positive. The strongly negative PDO is another factor that goes against some of the more aggressive ENSO models becoming super. All 4 super El Niños since 72-73 had a neutral or plosive PDO in August. So we have the WPAC, PDO, and subsurface vastly different from all 4 past super events. But that may be too small a sample size to be definitive. We’ll see how it goes.


Nice daily or weekly PDO? Also is that on the climate reanalyzer site?
Yea you can see the persistence of the ridge in the NW PAC region. You can see a rather drastic difference in the high latitudes where low pressure has been fairly present across the Arctic this year leaving mid latitude ridging instead of like we saw in 97 and 82. 2015 was a bit different but overall still pretty consistent with the other years (bit of a mix happened that year, but we also already had rather warm temps across the entire basin leading into the El Nino development. 1972 actually was not too far off from what is happening but in all of these cases the southern hemisphere definitely had more anomalous troughing around Tahiti region versus what we are currently seeing.


-
2 hours ago, bluewave said:
Pattern looking very La Niña-like to start September with strong Maritime Continent forcing despite the IOD and SOI. So the WPAC warm pool is continuing to call the shots.

That looks to choke off the EPAC hurricane season a bit, which is unusual in an el nino. Atlantic may have 1 or 2 pop up from that look but they may struggle. WPAC may go in for a bit again. That should definitely help with the PDO signal to more of a neutral look. Although we are seeing some pretty stark cooling in spots of Ne pac over recent days to week.
-
2
-
-
2 hours ago, snowman19 said:
The reason why the IOD going positive is important is this….it is going to end the eastern hemispheric monsoon quickly, which should bolster the El Niño. According to the latest data, it’s climbing rather quickly, actually ahead of where it was forecasted to be at this point in time. Also, would appear the SOI has gone very solidly negative again https://x.com/jnmet/status/1694001198754570382?s=46&t=NChJQK9_PUjA1K7D2SMojwBut the monsoon typically ends this time of year im not sure i understand that if the IOD goes positive that the monsoon season will end, quicker.
Ending of the season would probably bolster a spike in IOD. The positive also seems like it is from a really warm western indian ocean rather than a better gradient of warm west cool east. We have cooled near the maritime but still are fighting to have sustained negative anoms outside of nw australia.
-
The IOD only took four months to finally reach semi positive status...
-
 2
2
-
1
-
-
1 minute ago, Stormchaserchuck1 said:
Here's the area
When the CDC website allowed us to make custom indexes, I made a time series index of that red box area, and found it to be the highest correlation for the 500mb N. Pacific vs all other ENSO measurements (850mb winds, 200mb, sigma levels, OLR, SSTs, etc). It wasn't perfect, but I have seen it hit about 21/27 in the last 3 years, which I posted in past ENSO threads on this board. Definitely missed last Winter, but that was 1 big miss out of like 4 years. It's just something to keep an eye on, you can see for yourself over time. There is a pretty good now-time correlation there, to yes, the PNA.
Thank you for that will have to watch how it unfolds going forward. Just trying to get a better understanding where you are coming from is all. I feel the other factors may have better significance in helping explain that but it is interesting!
-
1
-
-
Just now, so_whats_happening said:
So you are correlating from western edge of 3.4 near 4 as whether or not we get a +/- PNA?
Unfortunately 97/98 is a little out of order when it loaded but would argue 97/98 had a much better push of negative subsurface anoms.

.gif.ca6b00ec94bf5d88d44f3af743db498d.gif)
.gif.b3843a767a447f6de291a881cf7621a1.gif)

Using last year as an example we had rather positive readings in the same location but a firmly -PNA, PDO definitely played a role in enhancing that.
.gif.b7eedf082b2873485969ddc3f4ab88c2.gif)
-
19 minutes ago, Stormchaserchuck1 said:
So you are correlating from western edge of 3.4 near 4 as whether or not we get a +/- PNA?
Unfortunately 97/98 is a little out of order when it loaded but would argue 97/98 had a much better push of negative subsurface anoms.


El Nino 2023-2024
in Weather Forecasting and Discussion
Posted
More so also posting his/her own opinions and graphics to back it up would be great. I get trying to have confirmation from the twitter crowd but it really seems like he/she wants those individuals to speak for their thoughts rather then presenting their own ideas. That is not scientific in anyway and definitely lose respect from scientists in that manner, whether right or wrong.
Honestly im not sure why everyone cares to be so right over something like this. Would much rather just chat about it and discuss how the evolution is rather funky. Throw around ideas to get a better understanding and leave it at that. Really weird to see people treating this like a job on what is supposed to be a chat forum. Can we not just take a breather from work stuff and enjoy a place where we all like to watch and talk weather?
Anyway rant over im sure nothing will change in any aspect so...