

so_whats_happening
-
Posts
1,584 -
Joined
-
Last visited
Content Type
Profiles
Blogs
Forums
American Weather
Media Demo
Store
Gallery
Everything posted by so_whats_happening
-
2026-2027 Super El Nino
so_whats_happening replied to Stormchaserchuck1's topic in Weather Forecasting and Discussion
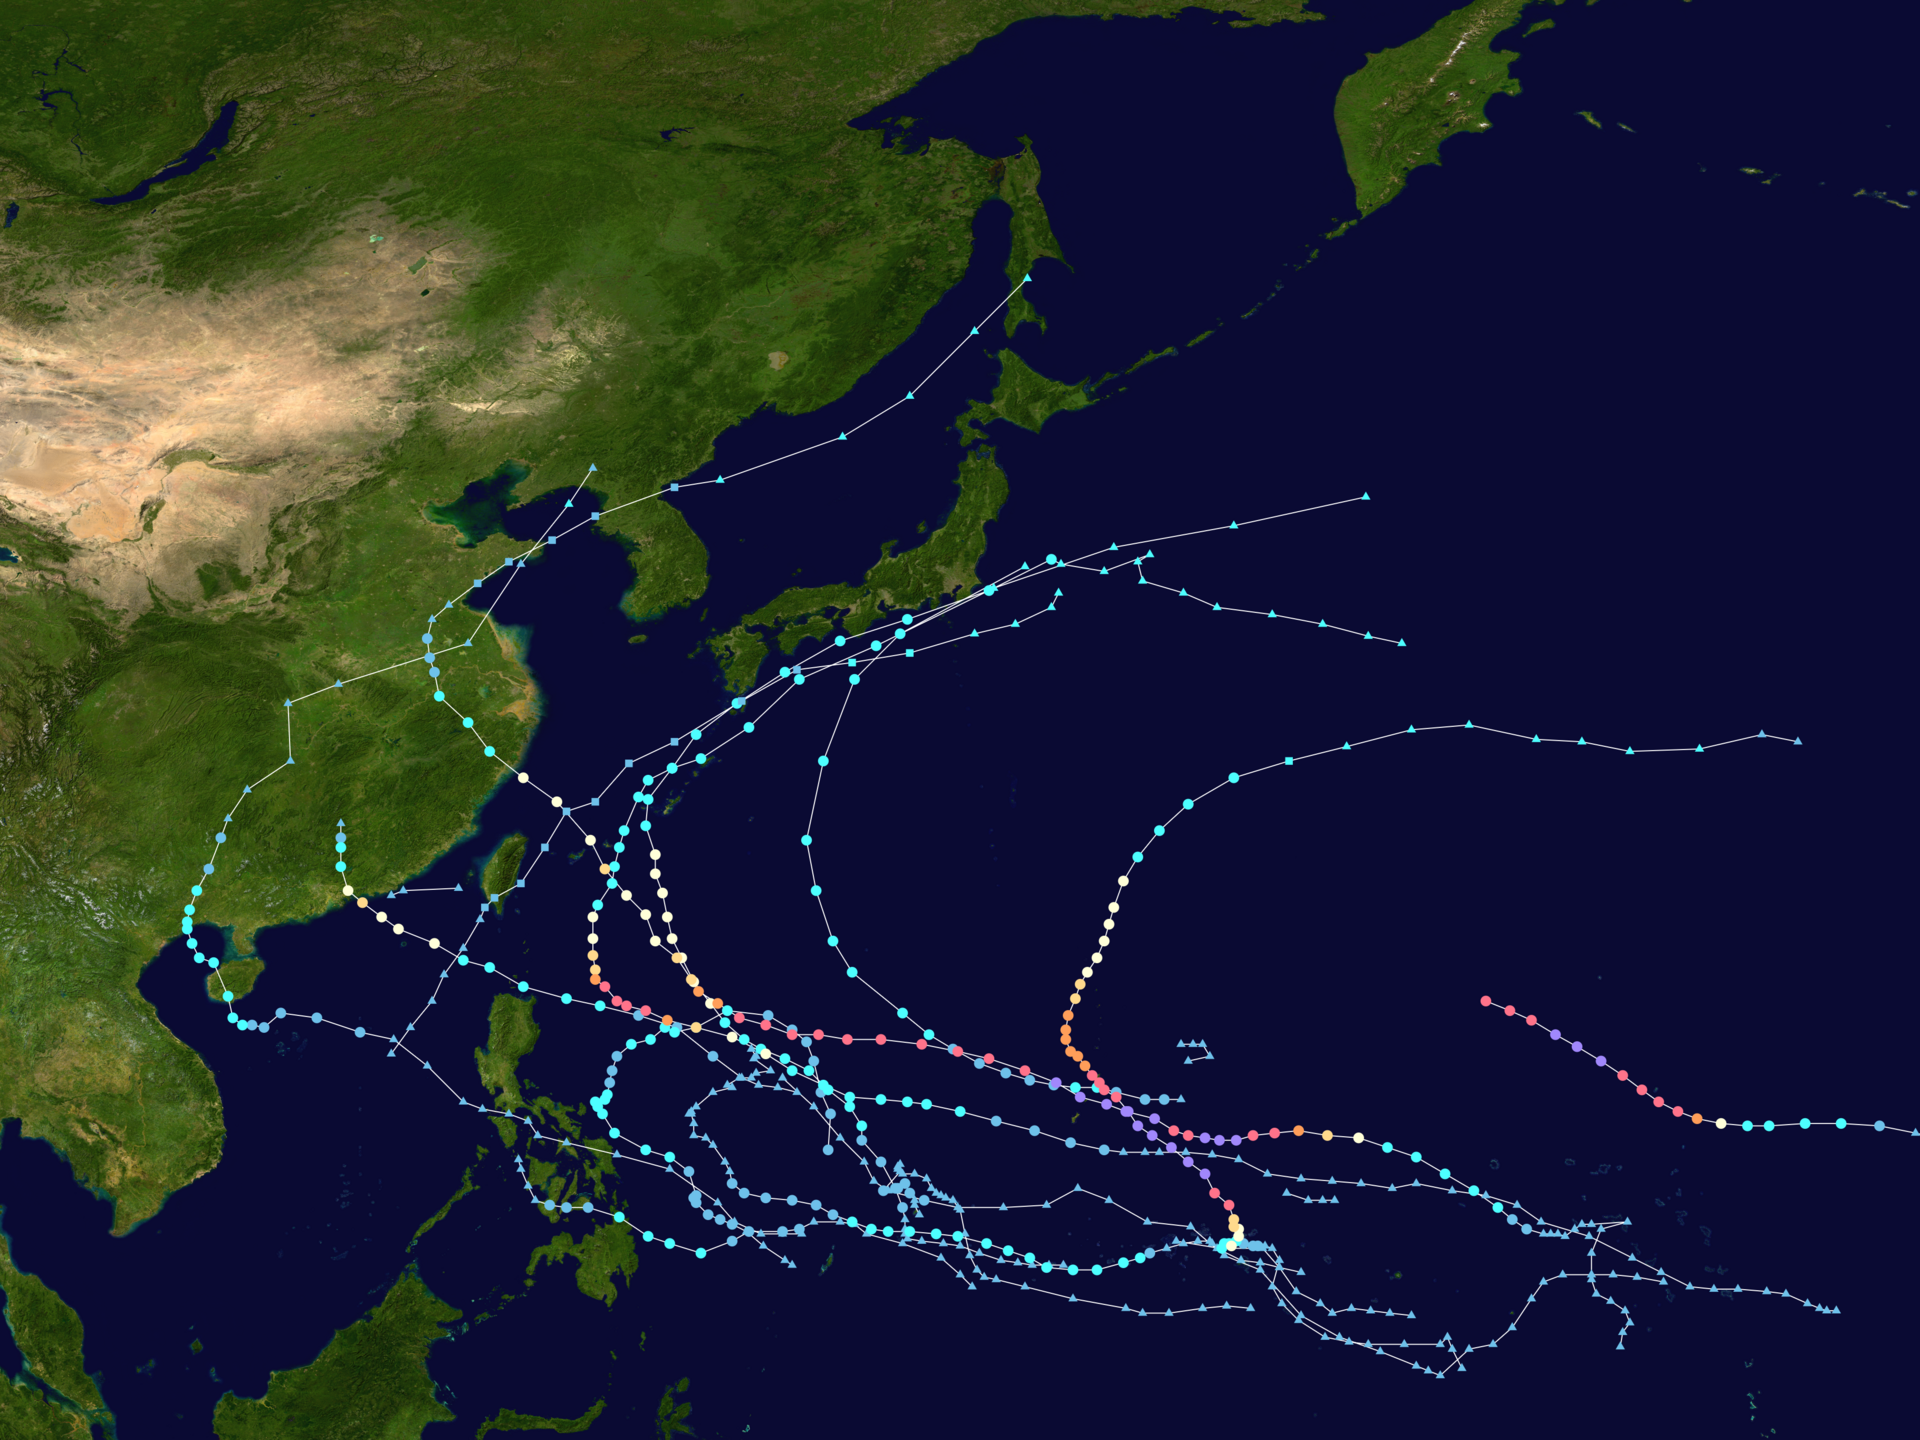
Yea this one will be fascinating to watch unfold. The atmospheric pattern still resembles that of a La Nina/ -PDO mode in the northern hemisphere for sure. Even with the tropical activity in the WPAC this year (which is great to see) we haven't seen many recurving typhoons sinlaku was the closest to still being a typhoon while recurving. Most of the storms have still been tracking west which doesn't bode well for the PDO to flip, maybe we see that change as we get into fall.
-
2026-2027 Super El Nino
so_whats_happening replied to Stormchaserchuck1's topic in Weather Forecasting and Discussion
I truly would laugh so hard if we end up getting a solid winter out of this event just so I can stop seeing the repetitive posts on here. -
2026-2027 Super El Nino
so_whats_happening replied to Stormchaserchuck1's topic in Weather Forecasting and Discussion
Truly a great retention year all things considered. Low starting point was unfortunately the worst thing to happen. I do however worry as we go into spring/summer of next year after the heat release from this ENSO event unfolds but will have to wait and see how things evolve. -
Sorry yes please post your anomalies for August below do so before 6z (2am eastern time) August 1st. So far Don S. still holds a solid lead but we are getting into the time of year where things will start to be a bit more chaotic and forecast moves can happen quick.
-
2026-2027 Super El Nino
so_whats_happening replied to Stormchaserchuck1's topic in Weather Forecasting and Discussion
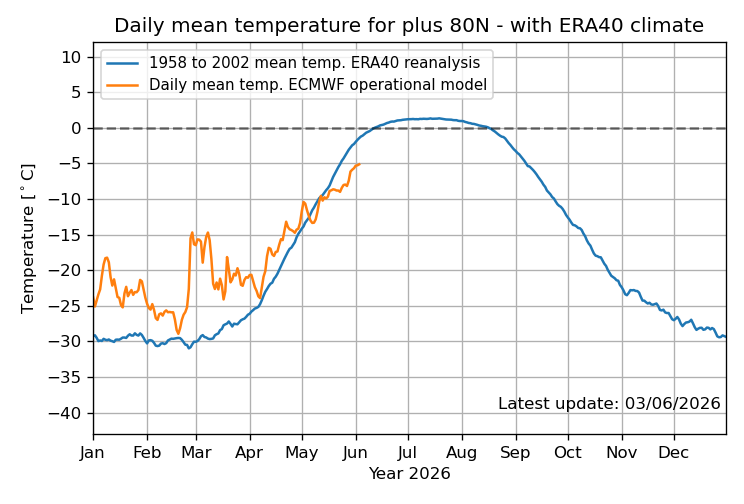
Unfortunately starting from a record low in winter will have this happen. The area of 80N and even close to 70N has been near normal or below normal temp wise most of the summer thus far. This is what you want to see in a good retention year but again starting point always matters. If this holds into August we should continue to slide above that 2012 number and get more inline with recent years probably 6-8th lowest roughly. Im honestly surprised more so we didn't take a massive hit this year but presume next year will likely start another leg down. Fingers are crossed it doesn't. -
Here some max temp so far DCA: 103 (7/4) may be challenged tomorrow? NYC: 100 (7/2) BOS: 101 (7/2) ORD: 95 (7/1 & 2) ATL: 98 (7/2) IAH: 97 (6/29) DEN: 97 (several days thus far) PHX: 113 (several days) SEA: 91(6/15)
-
2026-2027 Super El Nino
so_whats_happening replied to Stormchaserchuck1's topic in Weather Forecasting and Discussion
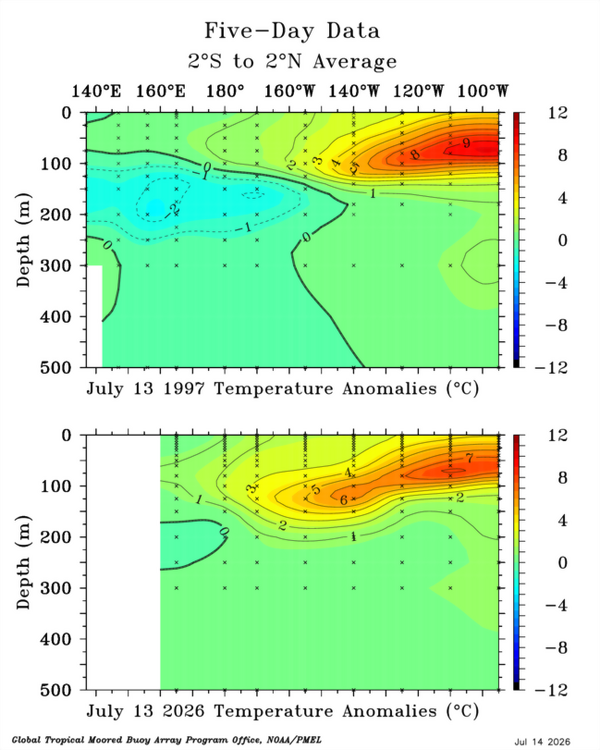
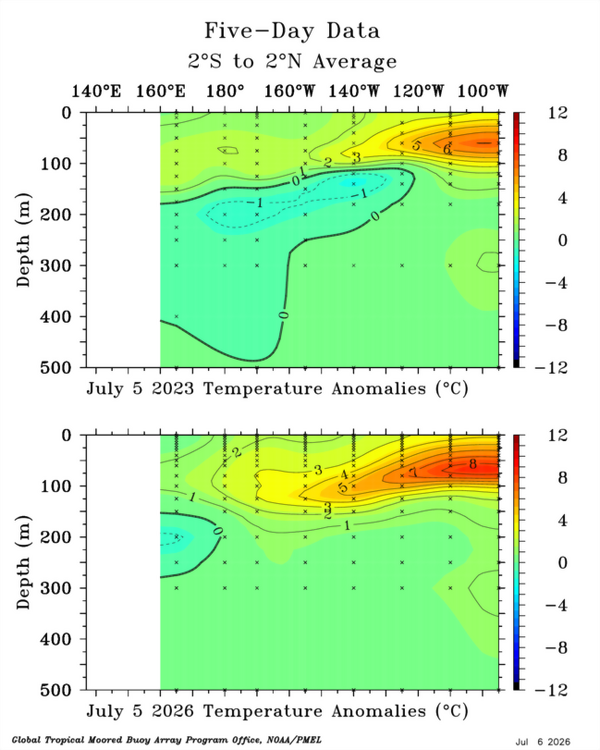
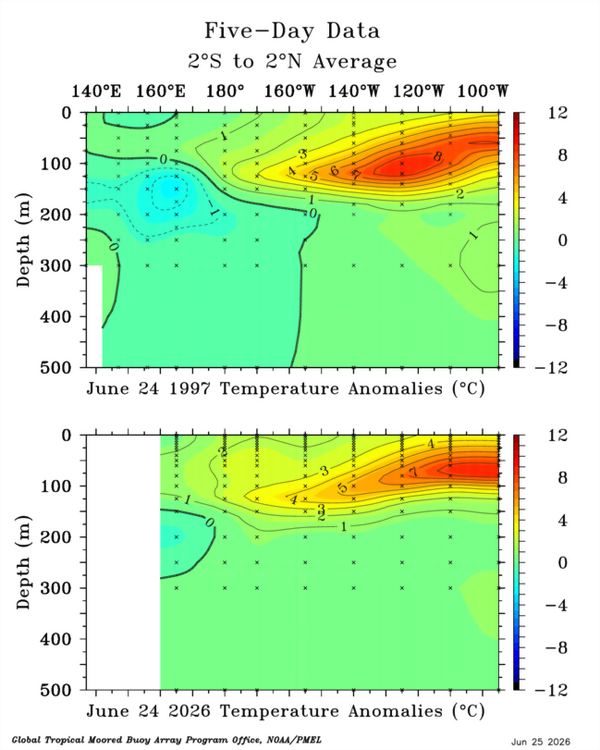
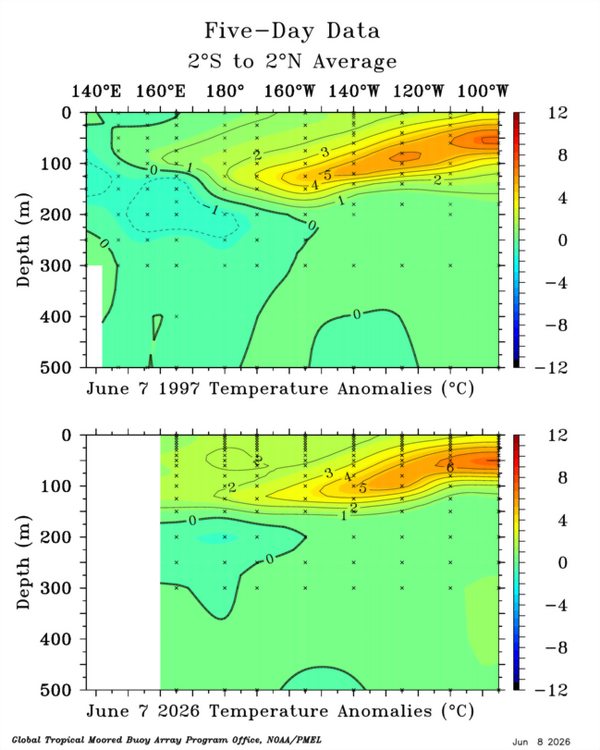
We have had this since about March around here going from 80-85 then accumulating snow the next then back to the low 80s. I would say that is more of a fall feel for this area but here nor there it has been very much back and forth. Setting some record cold lows and highs within the same month. Only thing I have noticed that we are in an increasing el nino state is the lack of tropical activity and the slightest of increase in rainfall over the last 2 months around here. This will ultimately be fun to see what happens with this next subsurface feature. Again that slight distorted look we see in the thermocline is an artifact of the -PDO state still holding. Losing its grip compared to 3 years ago during the last Nino event but still present for now..thumb.gif.fbaadca50649e550ee4525ea3f57d90a.gif)
-
2026-2027 Super El Nino
so_whats_happening replied to Stormchaserchuck1's topic in Weather Forecasting and Discussion
The difference in overall depth of the warm anomalies looks to be an artifact of the -PDO still being around. During the 2023-24 Nino this was centered around 130-140W. We also are lacking a significant negative anomaly region developing near the Dateline. I gotta ask the question though are we seeing Nino take on a new form with SSTs the way they are globally?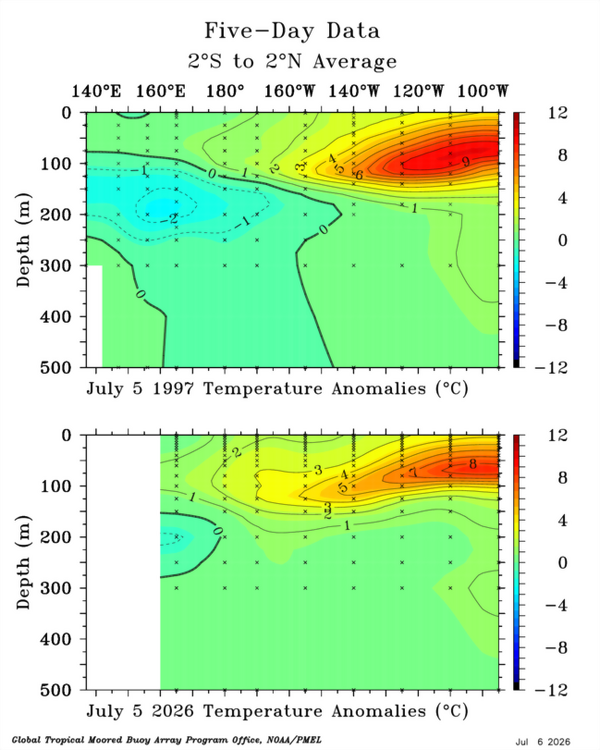
-
2026-2027 Super El Nino
so_whats_happening replied to Stormchaserchuck1's topic in Weather Forecasting and Discussion
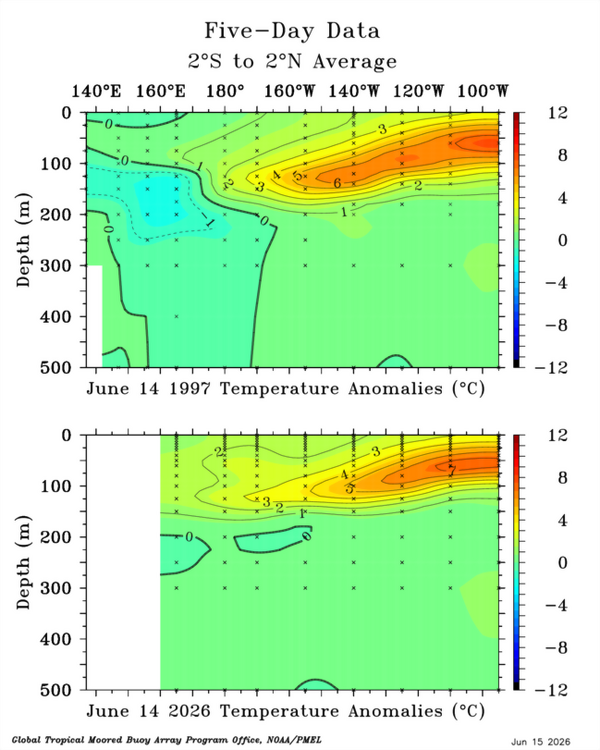
Im not going to play catch up since I have last been on here but here is TAO from May through July 4th, I'll be taking out May next update around mid month..thumb.gif.b6a5e787aef93ab1c7862c0e7be4773c.gif)
-
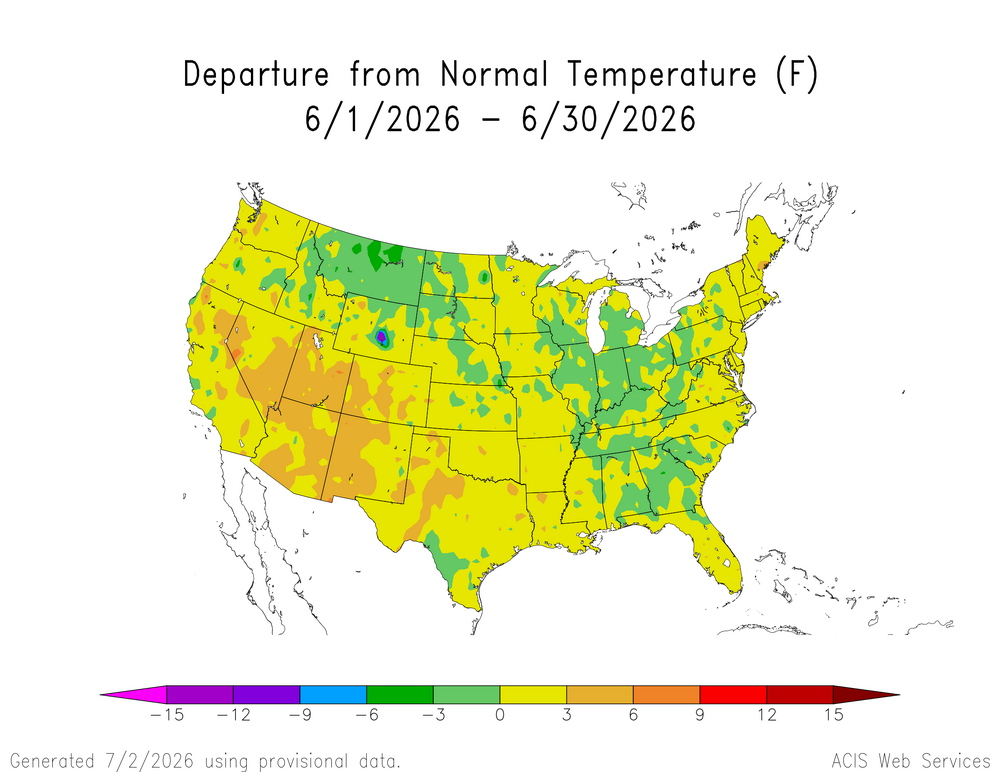
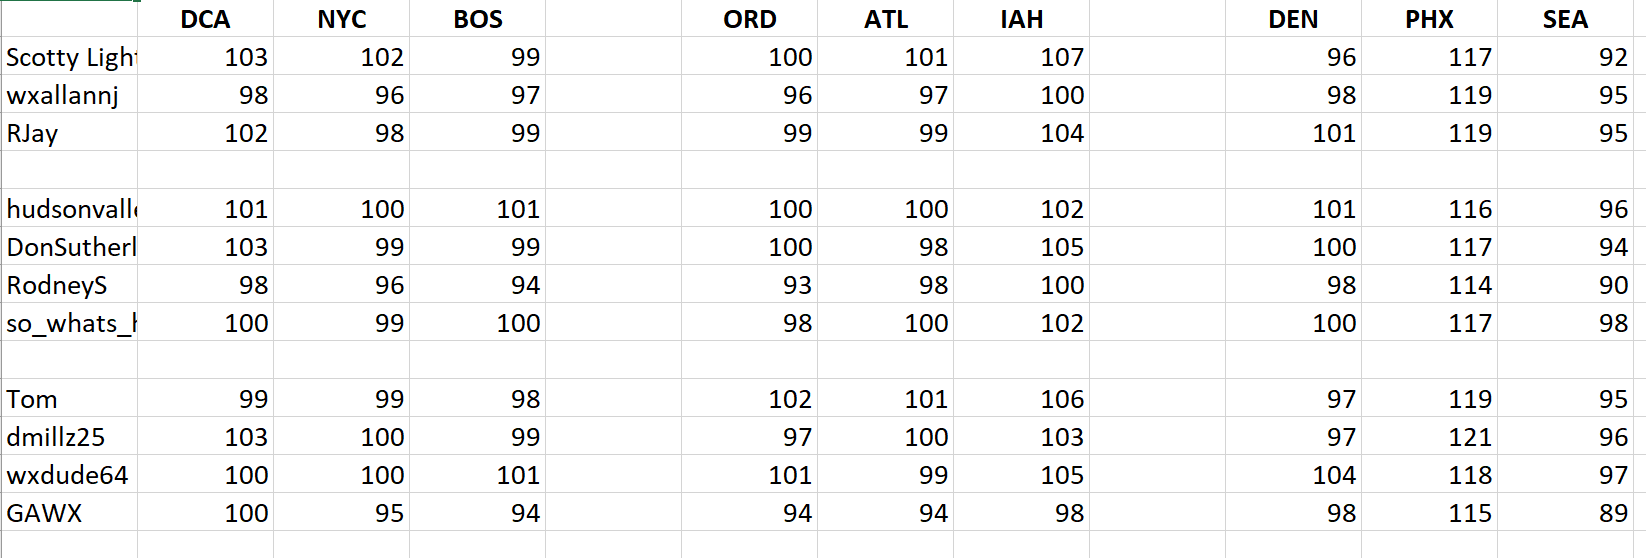
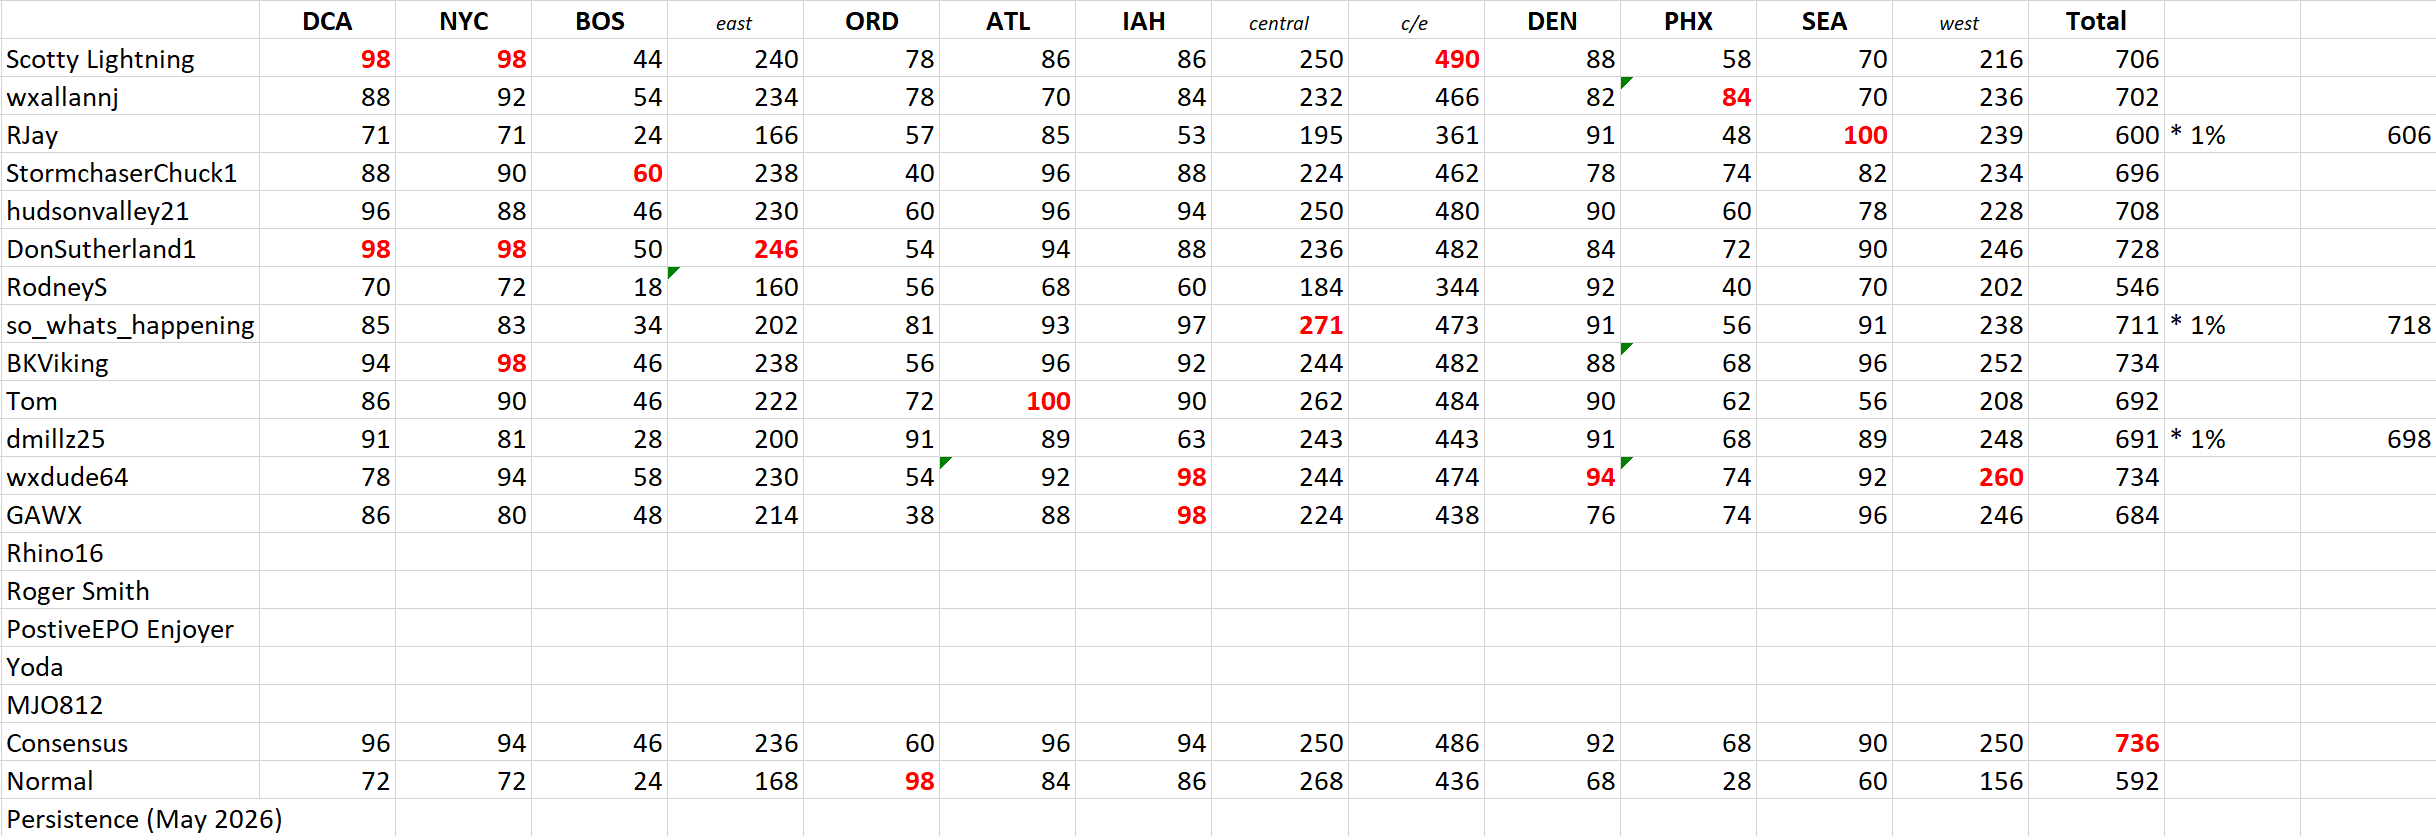
If anyone finds discrepancies in the numbers please let me know. For the deductions for June I picked 7 stations to knock down 1 point and 6 stations for RJay.
-
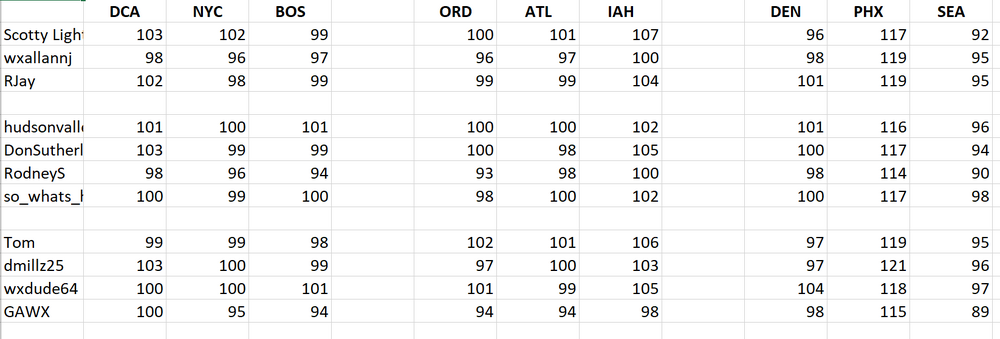
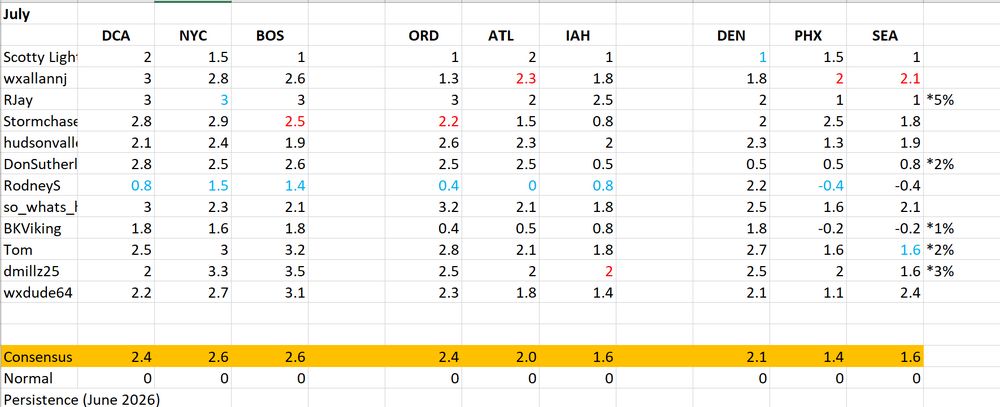
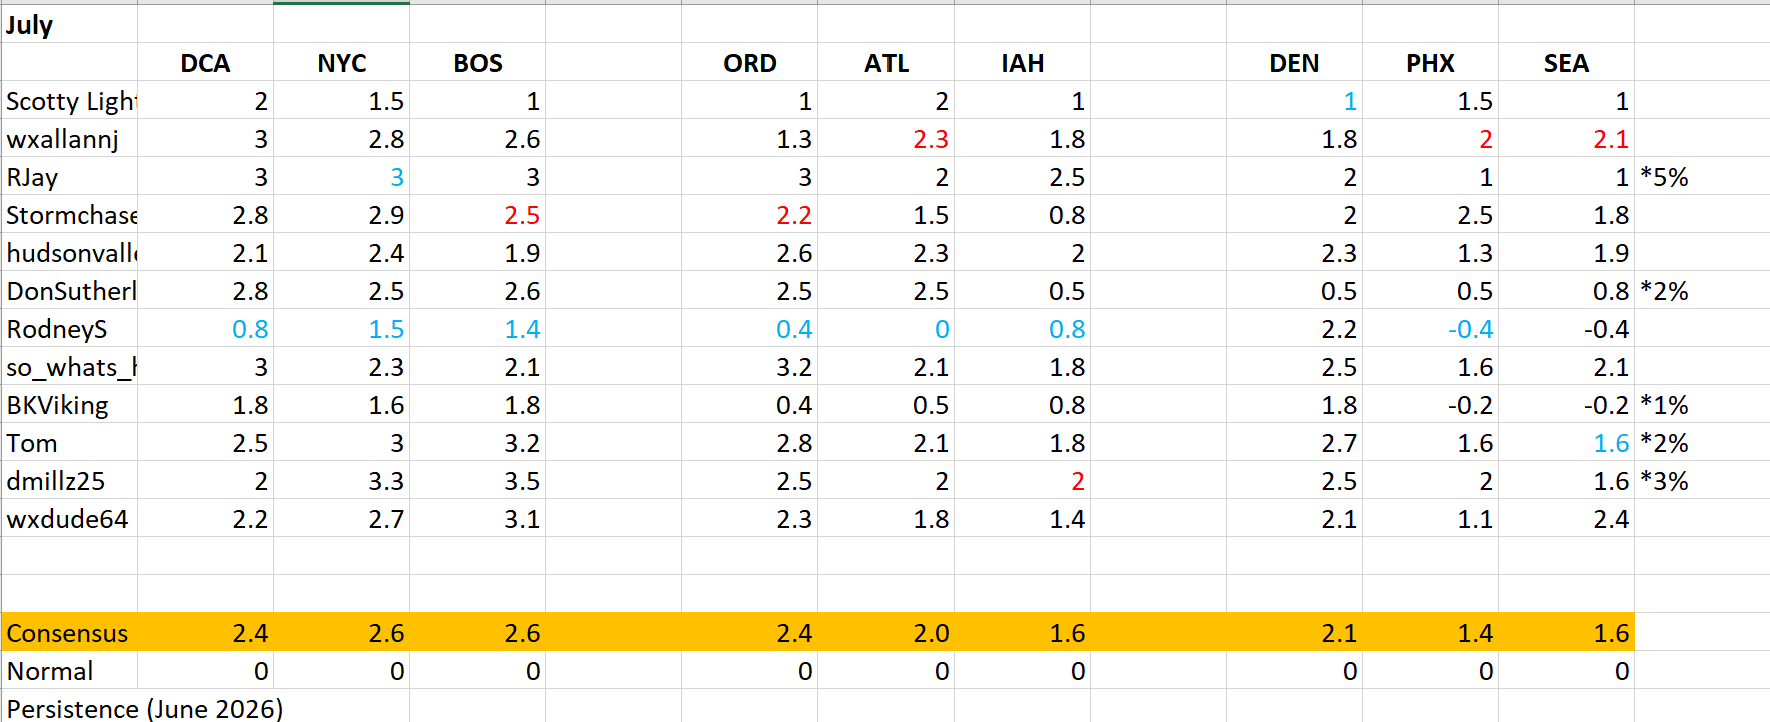
Im honestly debating on the late entries for this month (July) as it stands these are the forecasts and the what coinciding late entry percentages look like. Ill maul it over and if see if anyone else wants to chime in about it. Ill see if I can also do a quick update for max temps and where they stand thus far in a week or so.
-
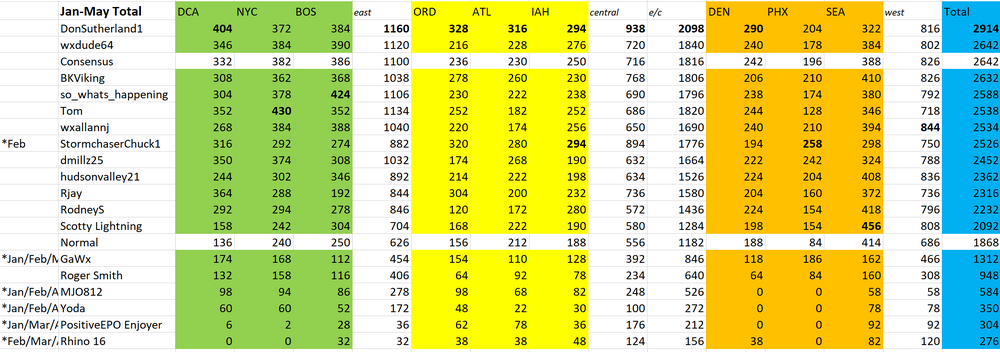
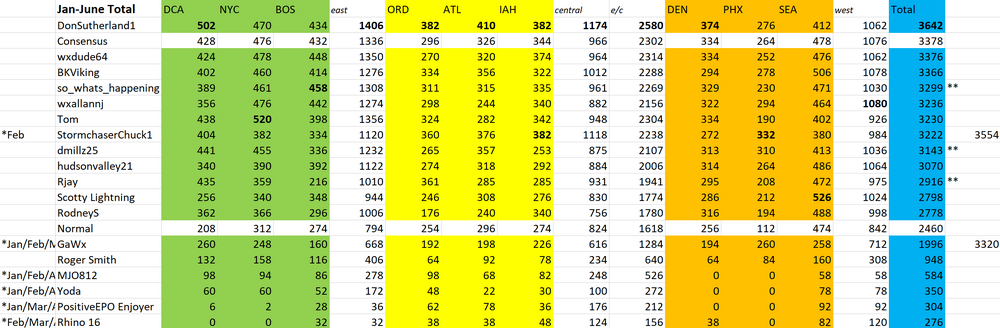
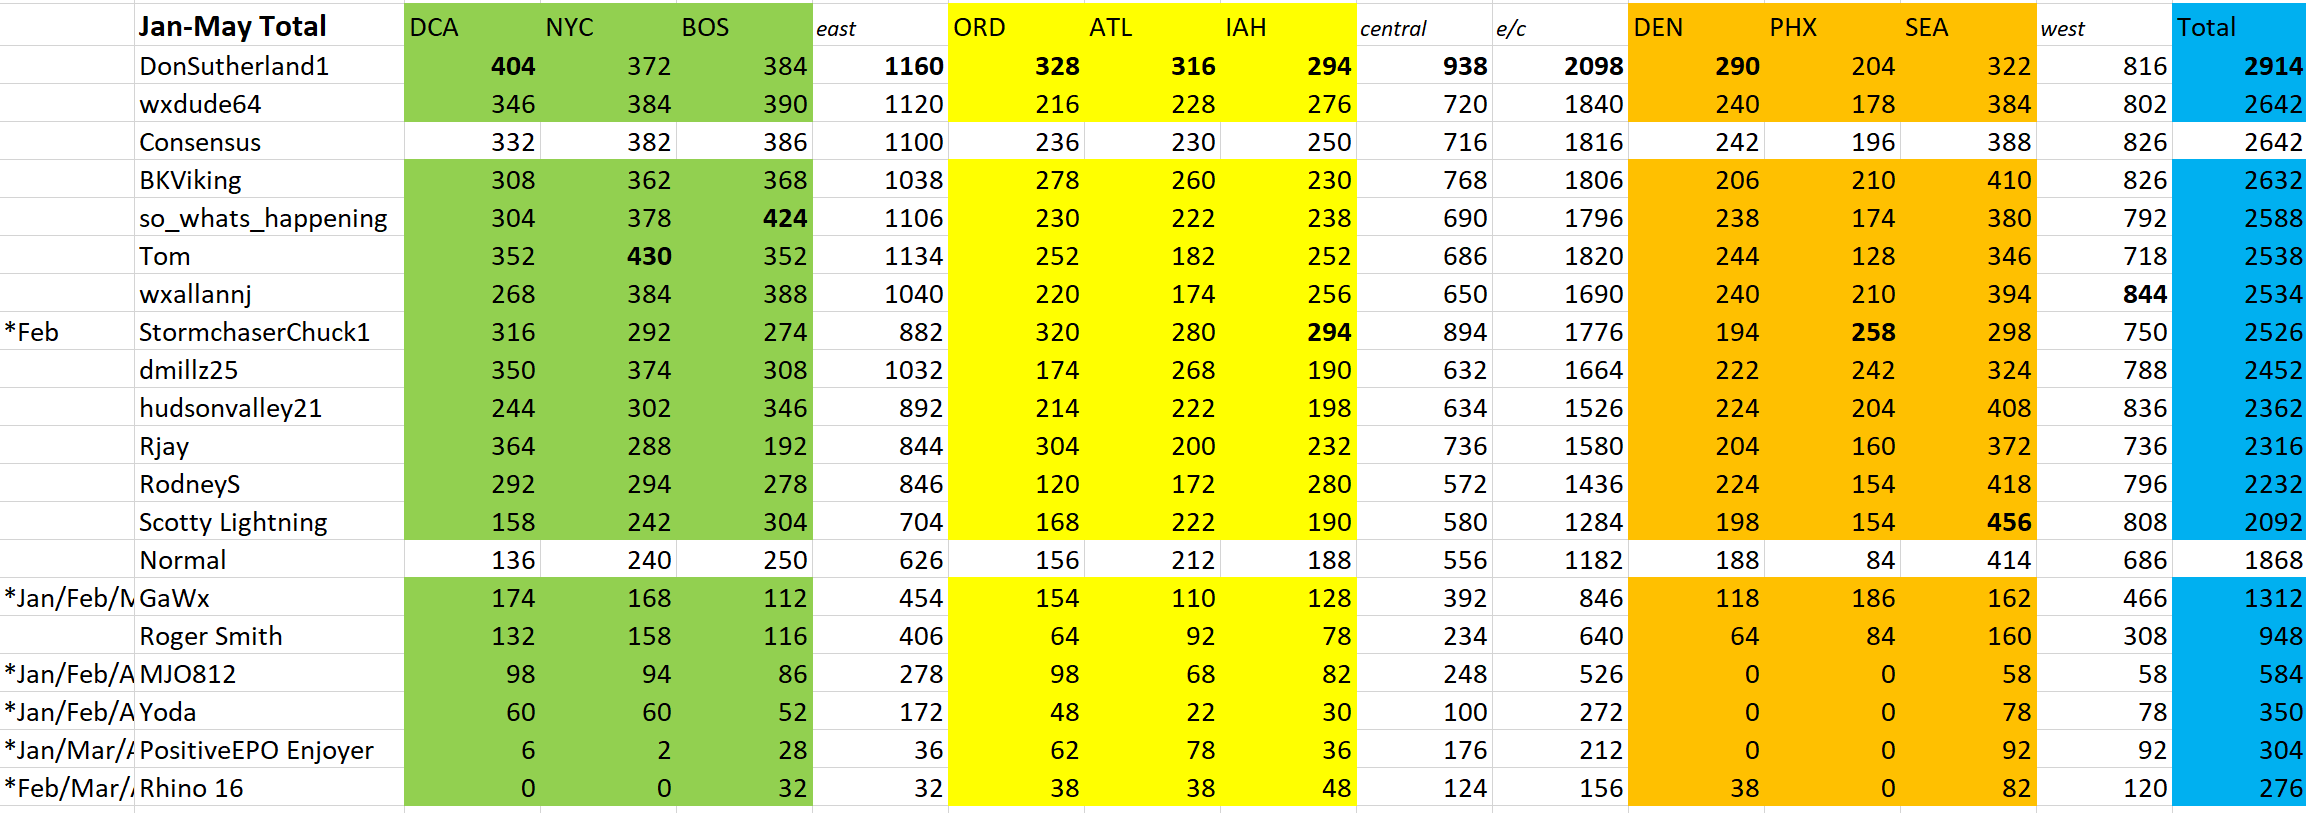
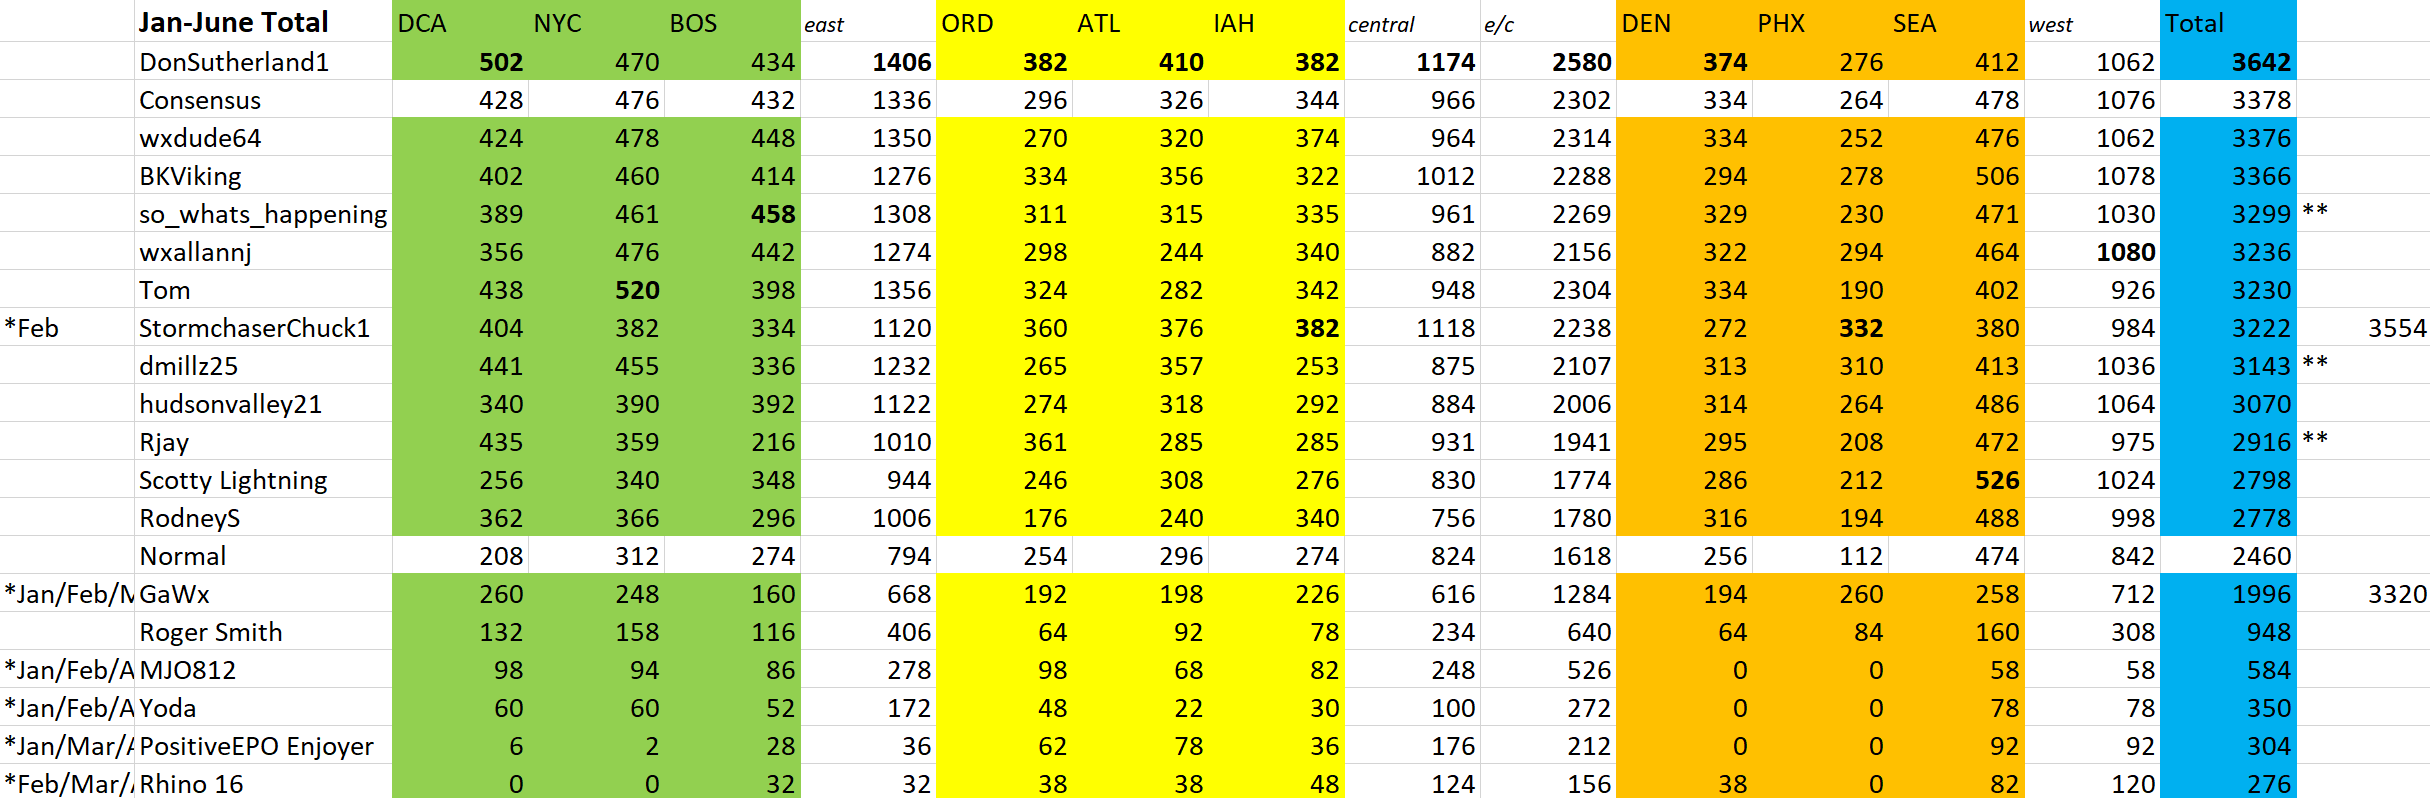
Ok sorry for the delay got back on the 4th and was bombarded by storms, lost power and internet. Then yesterday we had flash flooding still no power, hope it comes back tomorrow. We had very little movement in numbers. We had a few late entries and they are marked with * 1% for those affected most were 7 points off RJAY ended up only 6 points off the original total so not much of a difference. I included a consensus number to both GaWx and Stormchaserchuck for the months they were missing to get an idea if they had played through where they would stand in the far right column.

-
@Rjay @GaWx I think are the only 2 that have not submitted. Up to folks how they want to handle the late entries (quite a few by just a few hours). Ill be back early on the 5th so I should be able to post updates, iffy connection at times so hopefully this goes through. Happy 4th everyone!
-
2026-2027 Super El Nino
so_whats_happening replied to Stormchaserchuck1's topic in Weather Forecasting and Discussion
-
DCA: +3.0 NYC: +2.3 BOS: +2.1 ORD: +3.2 ATL: +2.1 IAH: +1.8 DEN: +2.5 PHX: +1.6 SEA: +2.1
-
Sorry I probably should have worded it a bit better. They are Max temps for the entire summer at those locations.
-
Good morning folks please place July forecasts below when you get the chance with the typical deadline of July 1st by 6z. I will be away for vacation from the 28th to the 5th of July so Ill do my best to compile all the values when I get back then. Ill try to do a quick update before I leave of what the results of June will look like around Friday (26th) since there shouldn't be major changes that occur.
-
2026-2027 Super El Nino
so_whats_happening replied to Stormchaserchuck1's topic in Weather Forecasting and Discussion
-
Here are the Max Temp forecasts
-
2026-2027 Super El Nino
so_whats_happening replied to Stormchaserchuck1's topic in Weather Forecasting and Discussion
A lot of this gets lost in the miasma of whatever happens in this thread. Thanks and I agree while records could be set if things set up perfectly that contrast west to east is important in overall effects we will see in the CONUS. We have not been able to get the contrast of warm east cool west of the tropical Pacific for awhile. I would like to think a quicker onset of the Nino might play a role in the winter outcome as well. -
2026-2027 Super El Nino
so_whats_happening replied to Stormchaserchuck1's topic in Weather Forecasting and Discussion
So when can we start to discuss the differences between how these two similiarish ENSO events will evolve?
-
2026-2027 Super El Nino
so_whats_happening replied to Stormchaserchuck1's topic in Weather Forecasting and Discussion
-
2026-2027 Super El Nino
so_whats_happening replied to Stormchaserchuck1's topic in Weather Forecasting and Discussion
Any thoughts to why we still seem to be crashing hard in Phase 7 to COD/weak 8 for MJO? We saw this in 23/24 as well. -
2026-2027 Super El Nino
so_whats_happening replied to Stormchaserchuck1's topic in Weather Forecasting and Discussion
Well for starters I feel we are not easily getting rid of the -PDO state we will need to watch how this evolves into the end of summer. Around now through August has been the timeframe we have seen the -PDO dip hard over the last 2-3 years. I do believe if we can maintain where we are now we stand a chance at having a +PDO (weak) spike as we go into winter. As for the ENSO state I have been very leery as far as overall strength of this event but currently it looks like a strong Nino is well supported, super not out of the question but I'm not sold on it yet. The -PDO will fight back on that potential and I personally can't quite place it but something feels a little off for super chances. I could be wrong with that and that is fine, a few tenths of a degree anomaly between strong to super is not going to make the world of difference on the overall effects we see come fall/winter over the Conus. Placement of ENSO forcing is the big one that needs to be watched with the second being to overall strength of the event, if we have further west VP and anomalies compared to past super events this becomes a different outcome for the forcing come winter. I would also like to really see the uptick in tropical activity that tends to take place from El Nino events through much of the Pacific. If the central Pacific tends to have more of the storms this season versus EPAC we are on the path probably to a more Modoki style Nino. The waters off Baja have cooled quite a bit over the last few months this is that kick from the -PDO still in play as well as the cooler waters around Alaska. As Bluewave states over and over, ad infinitum, the warm pool east of Japan is certainly still playing a role in how things progress and even much of the South Pacific is still very warm. In some ways we are starting to see some dual warm regions take place which is fascinating to see. You have competing factors still at play in the subtropics and mid latitudes that certainly will affect the outcome of this event. It still amazes me even with the warming of the central and EPAC tropical waters that MJO just halts at 7 and pushes to COD. Lastly the Atlantic... Are we about to witness a reversal in the AMO? We also don't have the classic Atlantic La Nina taking place yet through the tropics this will also be something to monitor coming up. If folks can make a forecast this far out and know almost close to what will happen come winter good on you but to me there are still many things that show a lot of uncertainty still exists. If I had to guess at an anomaly standpoint for this event we end up fairly similar in threshold to the 23-24 event. Nothing else other than the anomaly threshold. -
2026-2027 Super El Nino
so_whats_happening replied to Stormchaserchuck1's topic in Weather Forecasting and Discussion
Just a cesspool like twitter in here, bunch of noise with very little thought. I'll remove April in future updates..thumb.gif.960ed0184b33989049424223a22b6de3.gif)


.gif.7a1f57685c45ddf34b8ee60f840bc28f.gif)


.gif.4e45cd1241a8aea0baf60fd74c1a9574.gif)


.gif.30cd6a84e8bd5913945d7bc78961a9b3.gif)