so_whats_happening
-
Posts
1,640 -
Joined
-
Last visited
Content Type
Profiles
Blogs
Forums
American Weather
Media Demo
Store
Gallery
Everything posted by so_whats_happening
-
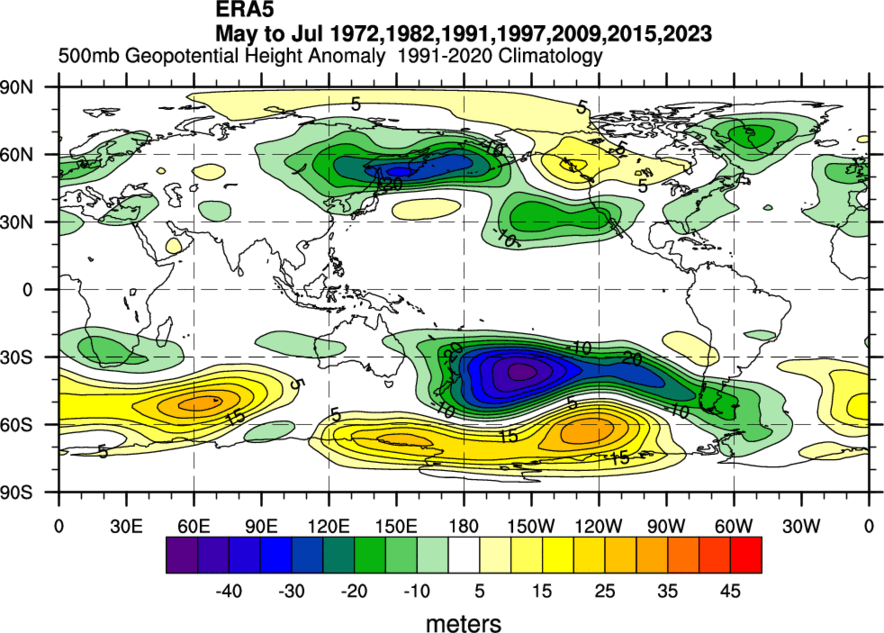
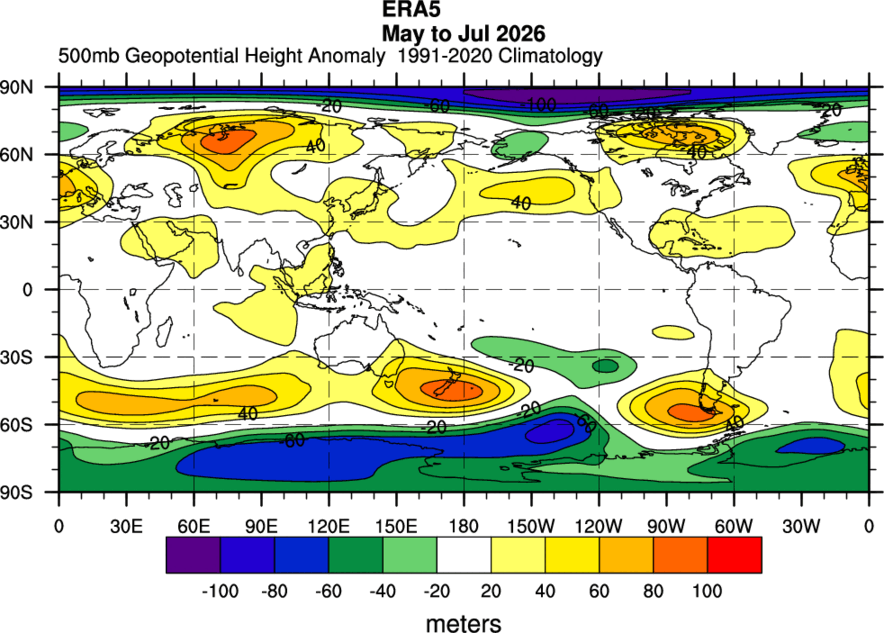
Looking through each year individually some years rhyme but you can't expect a 1:1 situation. 1991, 2015, 2023 stuck out the most as being similar to the northern hemisphere pattern we are currently seeing in the 3 month interval.
-
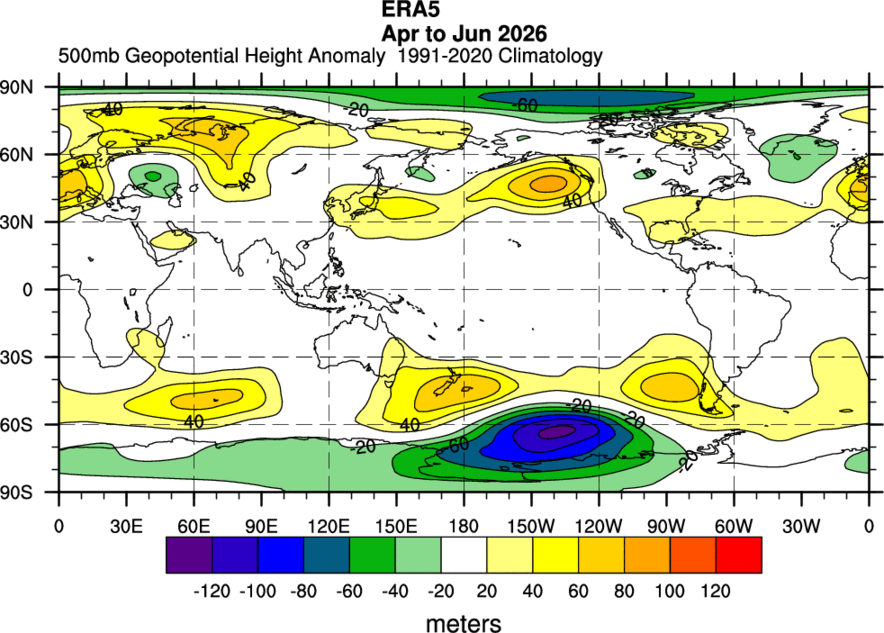
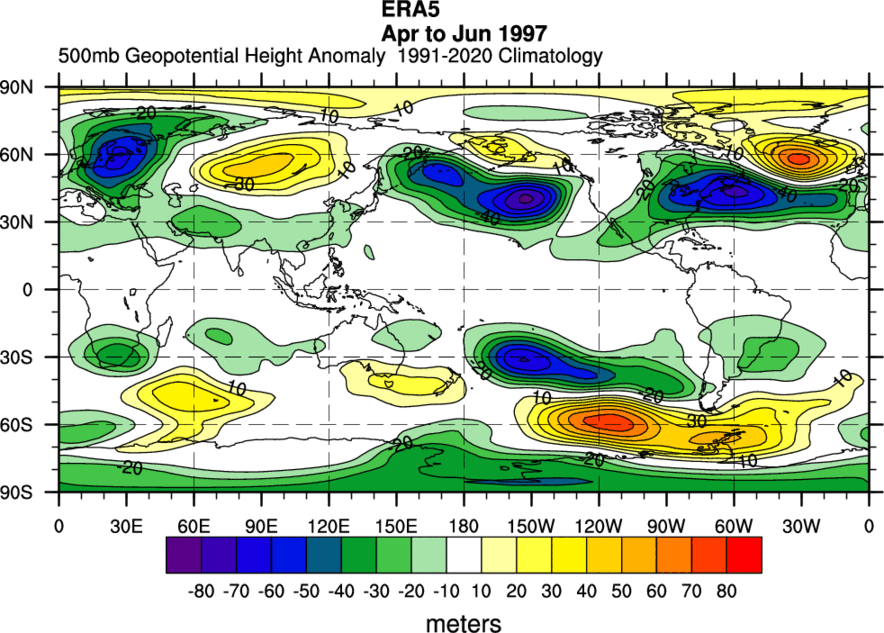
The only noticeable thing is the increase in moisture across my region specifically, still not enough to break the drought fully but working on it. The Caribbean has exceptional shear right now which is pretty typical of Nino (they are also below 30N so more in tune with what I had stated in my last post. There is quite an abundance of shear in that region that even areas of the East Pacific are being affected by this from about southern Mexico to Panama. Here are the 500mb patterns for MJJ leading into the strong to super Nino category based on RONI (since this is what we are using now). https://www.cpc.ncep.noaa.gov/products/analysis_monitoring/enso/roni/ I was reluctant to use 2023-24 since in RONI terms was only a moderate Nino (borderline strong) and comparing it to this year so far. There are some similarities this year to those past years in the southern hemisphere but overall the northern hemisphere seems to be opposite.
-
https://psl.noaa.gov/data/correlation/qbo.data goes back to 1948 monthly at just 30mb but was done being updated with a lot of other things back at the end of February 2026. Also have this pdf from awhile back again unfortunately have not seen this updated in a long time https://www.geo.fu-berlin.de/met/ag/strat/produkte/qbo/qbo_wind_pdf.pdf Updated site for ^^^ https://www.atmohub.kit.edu/english/807.php
-
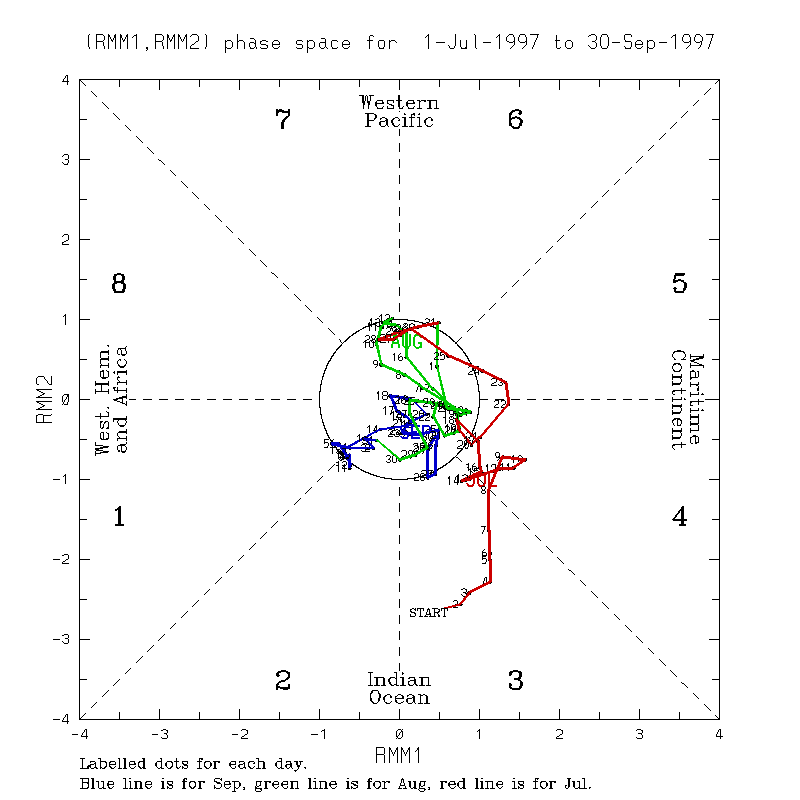
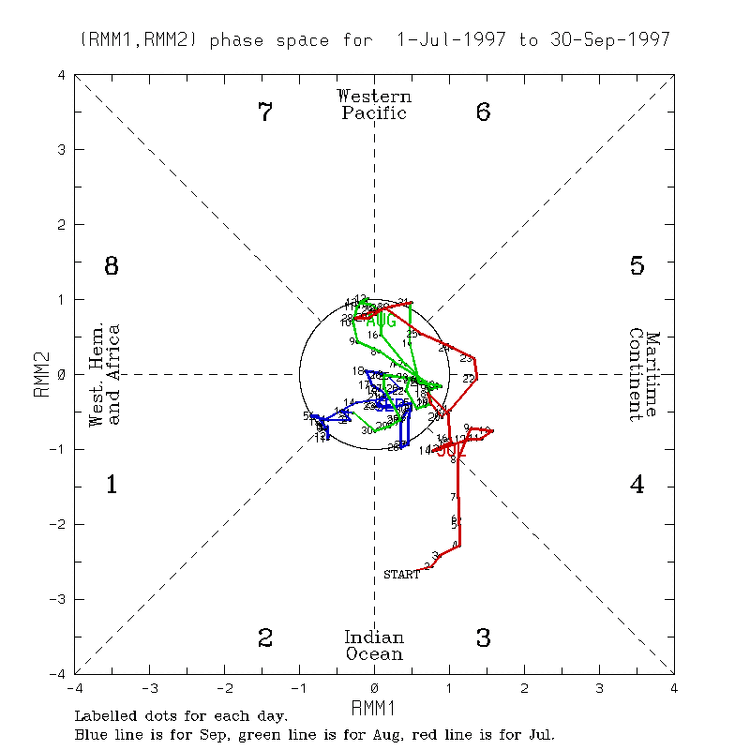
It is also very interesting to see the MJO just stuck in Phase 6 for nearly a month (with the forecast through the 25th). https://www.cpc.ncep.noaa.gov/products/precip/CWlink/MJO/CLIVAR/clivar_wh.shtml Looking back at 97-98 we were null to even having a La Nina-esque lean to the MJO through summer, I get it less influential in the summer. https://www.bom.gov.au/climate/mjo/#tabs=Monitoring Unfortunately with the cuts to data I can not find reanalysis of VP to prior time periods to match with current times, since current times are not being updated.
-
Yea we are still lacking quite a bit with the AAM into the northern hemisphere it just cuts off right 30N. So the Nino is thriving in the tropics to subtropics and the southern hemisphere but in the north it is struggling besides little bits and pieces that show up regionally. https://atlas.niu.edu/gwo/
-
This has been fascinating to see over the last month in the movement of the warm anomalies in the north pacific. Also I believe I remember seeing bluewave point this out before but you can see the warming of the waters ahead of Dolphin.
-
The closest examples I could find since the 50's (unless my eyes are deceiving me). 1983/84 region 1+2 stayed warm through at least early winter but was a La Nina at about -1ish status. 1986-1988 timeframe we had the double Nino event but they were about moderate to strong status before we cooled down. 1991-92 went to neutral and had a bit of a lagged 1+2, went cool neutral the following winter (92-93) and then 93-94 had a warm neutral. 1997-98 went pretty well into Nina mode but was west while Nino 1+2 remained neutral before tumbling at the end 98-99 winter. 2015-16 cooled through most regions while 1+2 warmed as we went into winter of 17/18 other areas being cool neutral. https://www.cpc.ncep.noaa.gov/data/indices/ersst5.nino.mth.91-20.ascii Some correlation to a weaker Nina state but not necessarily the only outcome. It really I think depends just how the Nino state breaks down what will determine the following year. Would be interesting to look at the wind patterns for the transitions of each of these years. Edit: Again all this assuming the 1+2 does not exactly cool down which is something we will have to watch as we head into fall.
-
We are finally seeing an appreciable cold pool form so we may be at the peak of WWB events in the next month, doesn't mean the WWBs can not continue but the severity of them should start to wane soon. At this rate I am also not so sure we go right into a La Nina and a deep one at that, of course time will tell.
-
Medium to long range in every model are trying really hard to disrupt the consistent ridging episodes near Japan and east of there. Let's see how things shape up mid to late month.
-
To me this would more so impact modoki or similar to 2023-24 Nino type events if we had a CP EOF versus what is currently shown above, i'm not sure having a second EOF would impact the logistics of an EP Nino like we are currently seeing take shape. The amount of CP or west based Nino events is rather low and anything typically below the threshold of moderate status (i.e. weak to neutral) in either ENSO state tends to have overriding features that dictate what midlatitudes tend to see, they just add a little flair from the tropics. V wind is important because if winds are converging the forcing in the U direction will be stronger versus that of a diffluent flow which would have less umphh to move waters. OHC is not going to dictate the strength of a Nino/Nina event always. Take for instance the Nino of 1986-1988. ONI reached 1.5 in the summer of 1987 in this multi year event, RONI actually peaked at in the winter of 1986/87 at 1.5. MEI recorded it a staggering 2.1 in the beginning of summer of 1987. OHC on the other hand barely scraping to over one and it did so for 1 month. These other variables dictate how much the OHC will rise or fall so they encompass this aspect already just not the raw number of OHC. The OHC tends to rhyme with ENSO state but never the full story of the strength of the ENSO state. I wanted to add too look at the OHC for 1983/84 after the super nino comparing it to the other metrics listed below. Again OHC rhymes (often) but is never the reason for strength. https://www.cpc.ncep.noaa.gov/products/analysis_monitoring/enso/roni/ RONI https://www.cpc.ncep.noaa.gov/products/analysis_monitoring/enso/oni/v6/ ONI https://psl.noaa.gov/enso/mei/ MEI https://www.cpc.ncep.noaa.gov/products/analysis_monitoring/ocean/index/heat_content_index.txt OHC
-
No worries, I am not sure why they decided to have two updating values. Always trying to improve is an important aspect in life. Criticisms are an important part in this field as it helps build ideas and potentially new technologies for us all to use and benefit from.
-
This is an EOF encompassed by several EOFs though (5 to be exact) so in some ways it does have multiple like many of the other indexes do just not the repetitiveness of one defining several different areas typically 2 EOFs exist per index. RONI hit 1.4, MEI hit 1.1 while SSTs showed roughly 2. You could make the argument of breaking down the east and west of SSTs as well as wind but since it still currently covers those regions I don't see how creating another EOF would improve the skill outside what we see. As 40/70 said it is strictly a metric for coupling within the tropics and I think it has done rather fine for virtually every Nino/Nina thus far. Again slow to show rapid changes but still shows when those changes occur. I would never put stock in one index to tell the whole story of what is going on whether it is SST, wind, OHC, OLR, etc. That is why the multivariate is an awesome tool NOAA could have done away with it when the old data was lost but there were many Meteorologists that reached out and wished to keep this going for reasons.
-
Never claimed to be the best met or honestly that good of a forecaster at all. Of course I like snow, not so much cold though hence why I don't live in Canada or Alaska or hell even New England or the upper Midwest. I love that I have been able to experience a near snowless winter and the most snow this area has ever seen in a matter of 12 years, I find it simply fascinating. A +10 December and a -10 February as well. Yep definitely had many reservations about this event. Stay or leave up to you. Make sure to put that little poop emoji to let me know you care!
-
You have never produced a single thing by yourself. You consistently post others thoughts from twitter and say yep this is what I think will happen as if what they are saying is exactly as you would say and will happen. I question it because it literally looks like someone else took the time to actually make this and you just copied it, then you also simultaneously demean so many others around you who have differing opinions and actually put in the effort to create their own thoughts (whether right or wrong) and images to show an idea. Then you go on a tantrum because someone doesn't believe you cursing and acting like a kid. You simply could have just said nope sorry I created this but thanks anyway. You really have a lot of growing up to do. Best of luck with that hope you find peace. Still don't believe you made it and simply do not care.
-
We are on page 127 of this thread and it is August nearly 50% of these pages are filled with crap.
-
You need to relax man twitter has you all up in a bind over nothing. You rage out on every poster who questions you. Fix those issues man.
-
You really need to start tagging other peoples work and not trying to show it off as your own even if it is from twitter.
-
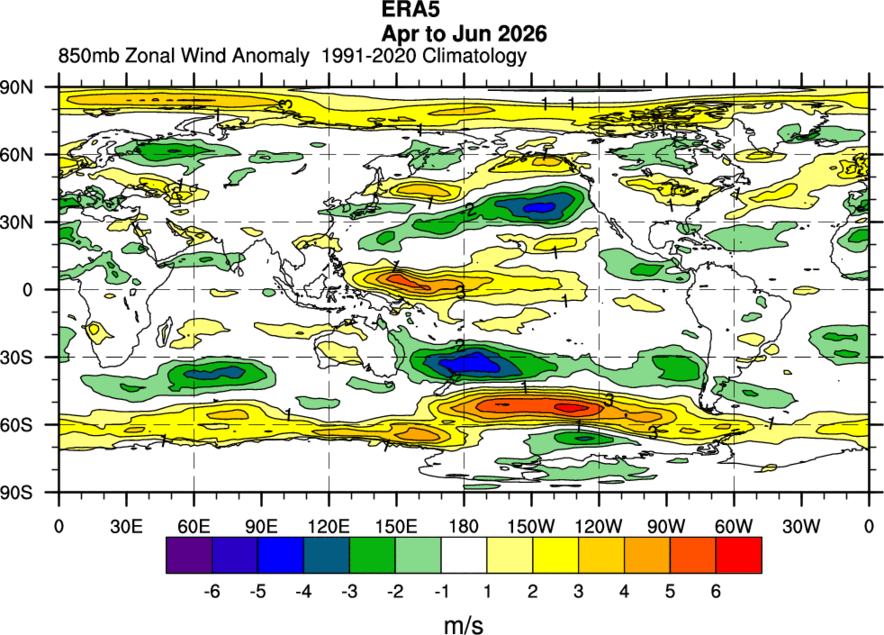
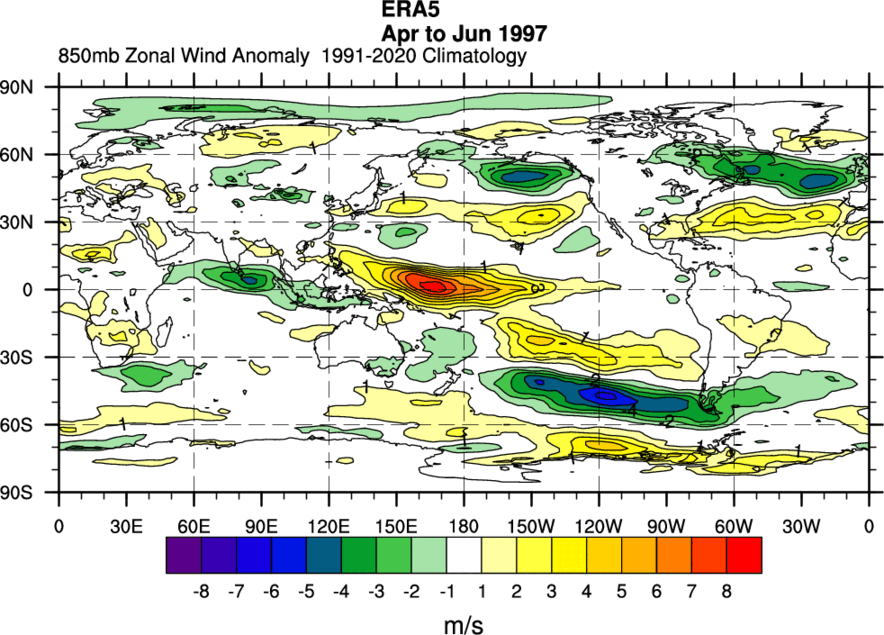
"The bi-monthly Multivariate El Niño/Southern Oscillation (ENSO) index (MEI.v2) is the time series of the leading combined Empirical Orthogonal Function (EOF) of five different variables (sea level pressure (SLP), sea surface temperature (SST), zonal and meridional components of the surface wind, and outgoing longwave radiation (OLR)) over the tropical Pacific basin (30°S-30°N and 100°E-70°W). The EOFs are calculated for 12 overlapping bi-monthly "seasons" (Dec-Jan, Jan-Feb, Feb-Mar,..., Nov-Dec) in order to take into account ENSO's seasonality, and reduce effects of higher frequency intraseasonal variability. During the typical height of ENSO during late Fall/early Winter, the canonical features of atmosphere and ocean anomalies are shown schematically below based on a composite of 11 historical El Niño and La Niña events. Key features of composite positive MEI events (warm, El Niño) include (1) anomalously warm SSTs across the east-central equatorial Pacific, (2) anomalously high SLP over Indonesia and the western tropical Pacific and low SLP over the eastern tropical Pacific, (3) reduction or reversal of tropical Pacific easterly winds (trade winds), (4) suppressed tropical convection (positive OLR) over Indonesia and Western Pacific and enhanced convection (negative OLR) over the central Pacific (Fig. 1a). Key features of composite negative MEI events (cold, La Niña, Fig. 1b) are of mostly opposite phase. For any single El Niño or La Niña situation, the atmospheric articulations may depart from this canonical view." https://psl.noaa.gov/enso/mei/ What would this second combined EOF do exactly to help with this metric? A 'V' component to wind is important just not as functional in the sloshing of waters as the 'U' wind tends to be. Wind and SLP go hand in hand so they should carry the same weight. OLR is covered over a very large area of the equatorial Pacific it literally is measuring the intensity/location of forcing within the atmosphere. WWBs being further east and west is also important into the evolution of an ENSO (El Nino) event. I completely disagree that OHC should be added, SSTs do just fine. We already have RONI which is just stating the obvious of what is happening in a warming world with warming oceans. The only criticism I would have of MEI is it plays catch up in all events but it often signals when the state has changed properly. We have been also noticing more lately that each block tropics/subtropics, mid latitudes, and polar regions have not been cohesive with each other. So while the tropics may be humming along in an El Nino the mid latitudes can react very differently and can be destructive to the evolution of ENSO in either state. Just as much as the northern hemisphere and southern hemisphere will experience ENSO events differently. This El Nino has been awfully more impactful within the southern hemisphere than so far in the northern hemisphere. This could change but have yet to see those signs show up in the 500mb pattern. Unfortunately this has not updated for July so I can't do a longer comparison but over the time period of greatest warming and exertion of a changing ENSO state these are the 500mb maps and wind anomalies we have seen between these two events. We seem to be running out of resources for plotting data so we are left with what we can find. Just because we are having something producing similar numbers in SST anomalies does not mean things will follow the exact same way as a previous event did. Overall this just tells me in the near 30 years that ocean temps have become dramatically warmer globally, to a rather drastic extent. The implications of such we do not fully understand yet or how it will affect these events as we go through time.
-
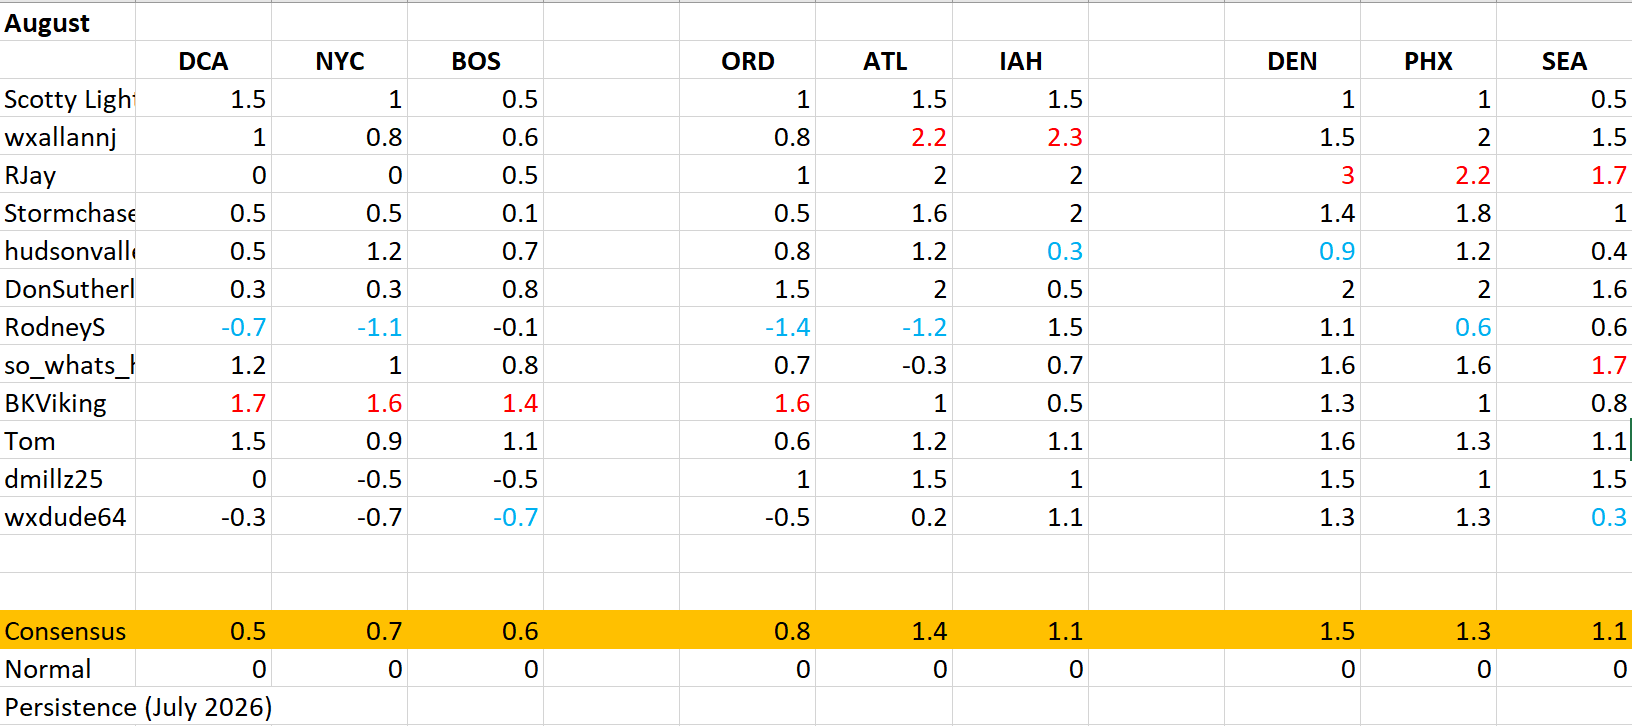
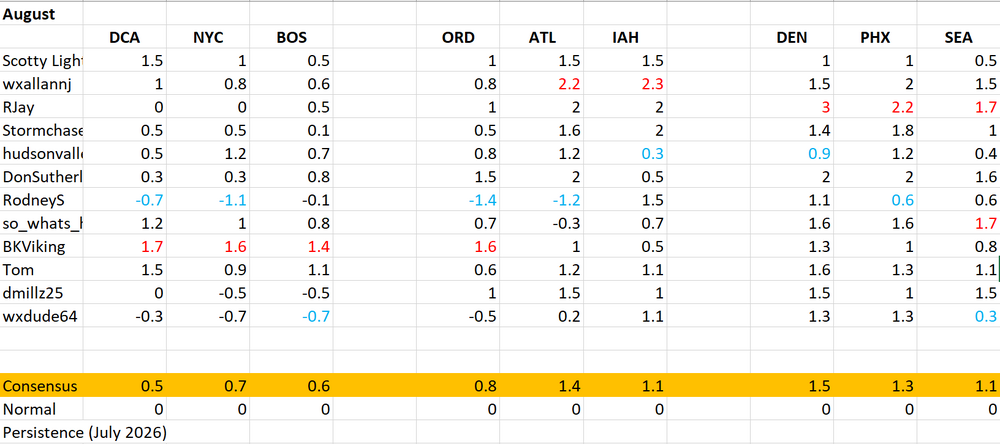
Sorry for the delay here is August. I think I want to try adding persistence into the new year. I will base it off of a 6 month running mean of the actual anomalies. If anyone has criticisms on this please feel free to let me know how best to approach something like this.
-
Now I understand, we use MEI now that it has finally caught up but before it was discredited as a metric because it was not showing what people wanted. This thread gets more funny by the day. I feel I should just create a twitter account based off this.
-
The one you seem to be discrediting has actually been more negative than the one you posted. 2020 -1.41 -1.48 -1.75 -1.32 -0.52 -0.75 -0.92 -1.33 -1.04 -0.62 -1.58 -0.98 2021 -0.61 -1.09 -1.67 -1.84 -2.04 -1.82 -2.00 -0.95 -1.96 -3.14 -2.75 -2.71 2022 -2.40 -1.91 -1.67 -2.09 -2.23 -1.31 -2.63 -2.38 -2.28 -1.81 -2.40 -2.21 2023 -1.24 -1.65 -2.45 -3.08 -2.41 -2.55 -2.54 -2.48 -2.99 -2.23 -1.79 -1.66 2024 -1.57 -1.34 -1.54 -2.11 -2.98 -3.15 -3.01 -2.91 -3.56 -3.80 -3.13 -2.03 2025 -1.29 -1.40 -1.12 -1.15 -1.66 -2.64 -4.21 -3.23 -2.31 -2.37 -1.51 -0.96 2026 -1.24 -1.00 -1.42 -1.62 -1.67 -1.71 -2.03 99.99 99.99 99.99 99.99 99.99 https://www.ncei.noaa.gov/pub/data/cmb/ersst/v5/index/ersst.v5.pdo.dat Versus 2020 -0.79 -1.12 -1.68 -1.32 -0.68 -0.86 -0.77 -0.85 -0.75 -0.29 -1.23 -0.92 2021 -0.73 -1.29 -1.70 -1.77 -2.33 -1.89 -1.93 -0.84 -1.70 -2.69 -2.37 -2.47 2022 -2.22 -1.72 -1.63 -2.19 -2.44 -1.42 -2.44 -1.78 -1.78 -1.48 -1.83 -1.85 2023 -1.24 -1.79 -2.50 -3.13 -2.46 -2.67 -2.44 -2.02 -2.52 -1.88 -1.16 -1.20 2024 -1.48 -1.33 -1.27 -1.99 -3.01 -2.93 -2.62 -2.37 -3.10 -3.24 -2.58 -1.57 2025 -0.97 -1.20 -0.81 -1.07 -1.84 -2.62 -3.83 -2.54 -1.71 -1.82 -1.02 -0.39 2026 -0.87 -0.79 -1.18 -1.28 -1.64 -1.32 -1.29 99.99 99.99 99.99 99.99 99.99 https://www.ncei.noaa.gov/pub/data/cmb/ersst/v5/v6/index/ersst.v6.pdo.dat This one is the one that site uses.
-
There seem to be 2 different sites for the PDO. https://www.ncei.noaa.gov/pub/data/cmb/ersst/v5/v6/index/ersst.v6.pdo.dat This one shows -1.29 https://www.ncei.noaa.gov/pub/data/cmb/ersst/v5/index/ersst.v5.pdo.dat This one labels it as -2.03