

so_whats_happening
-
Posts
1,579 -
Joined
-
Last visited
Content Type
Profiles
Blogs
Forums
American Weather
Media Demo
Store
Gallery
Everything posted by so_whats_happening
-
2025-2026 ENSO
so_whats_happening replied to 40/70 Benchmark's topic in Weather Forecasting and Discussion
This shows some pretty bad forecasts. Late December is the first set of images and the latter is as we close in on mid month. -
2025-2026 ENSO
so_whats_happening replied to 40/70 Benchmark's topic in Weather Forecasting and Discussion
I am honestly on the fence with it. Typically we only see a full destruction of the SPV 1-2 times a decade. I have a feeling we may have to wait but hope I am wrong. -
2025-2026 ENSO
so_whats_happening replied to 40/70 Benchmark's topic in Weather Forecasting and Discussion
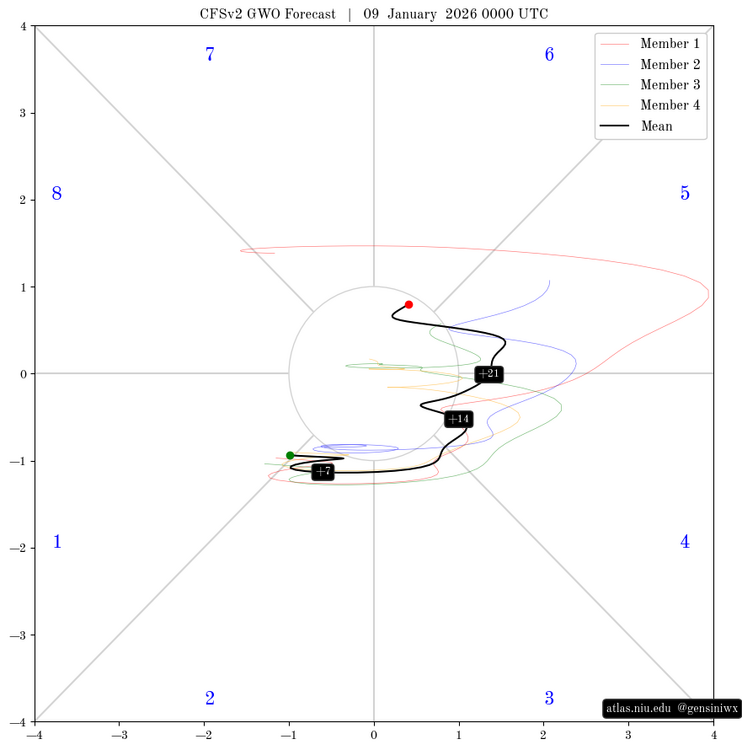
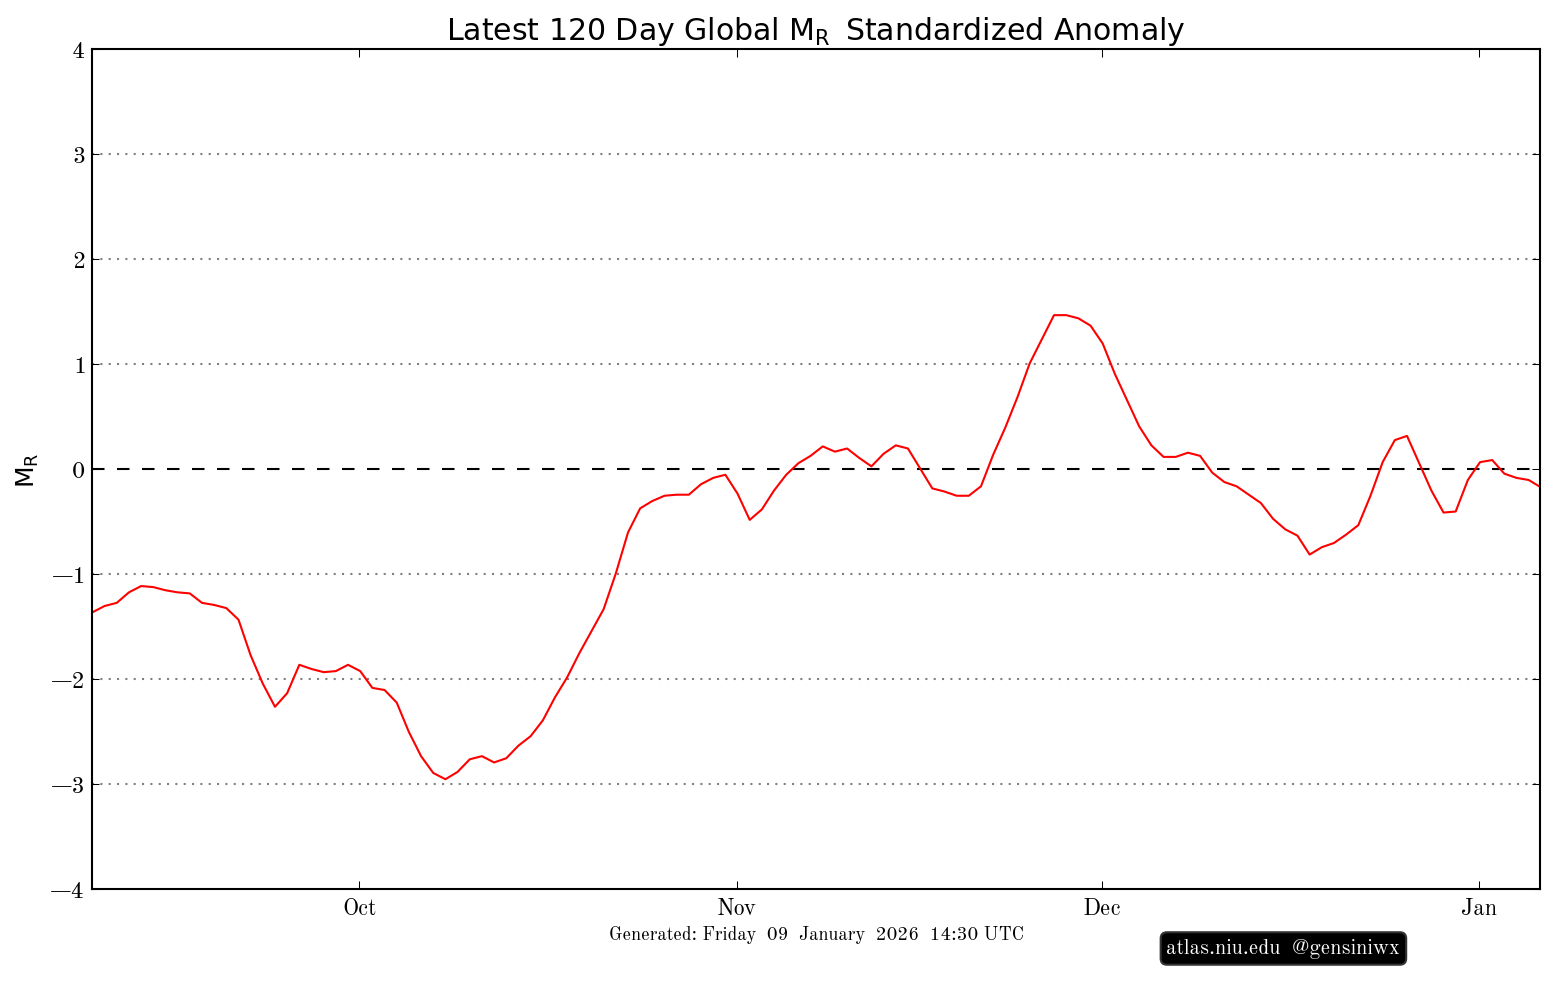
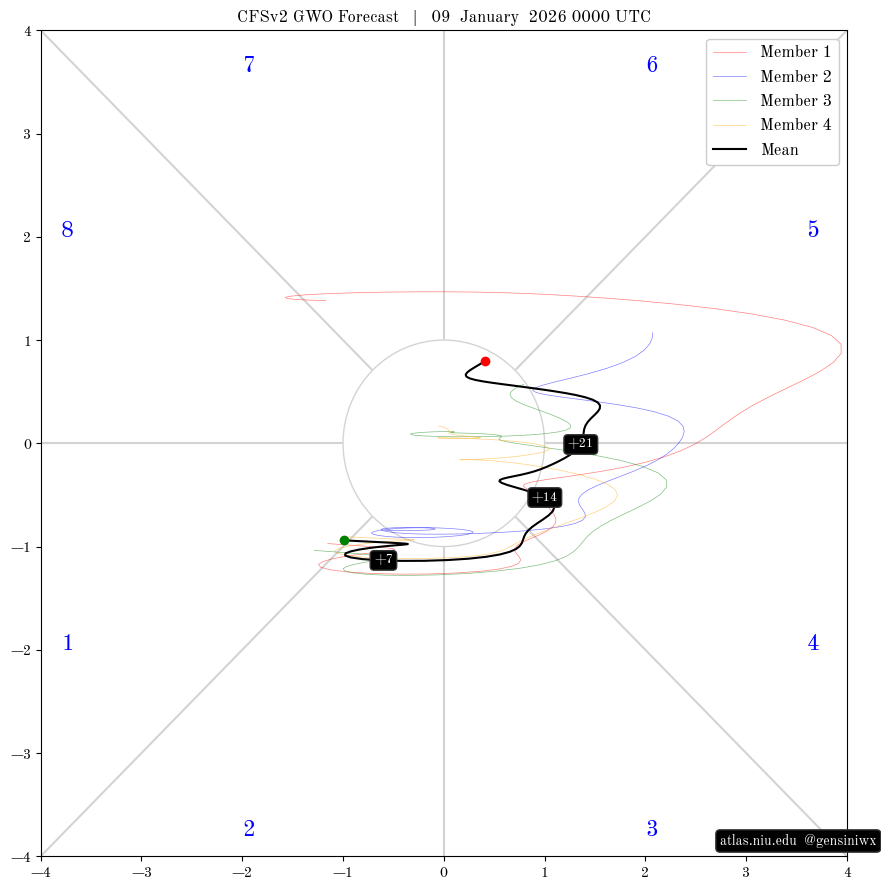
Never mind they are both standardized. For some reason the CFS forecast looks lower than the other chart. Figured I would also add these two to show the progression better and the overall potential impacts.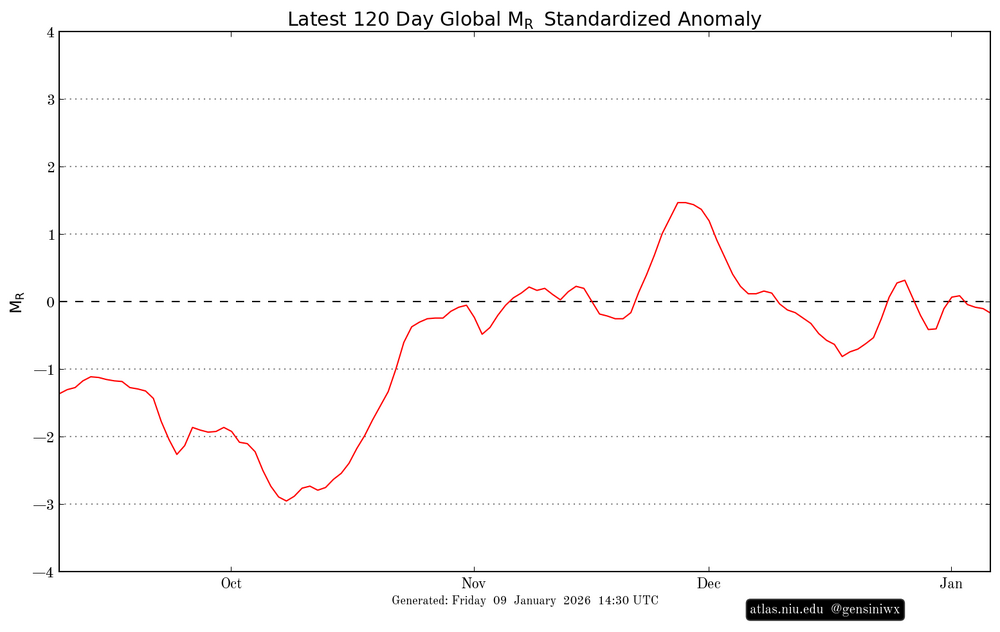
-
2025-2026 ENSO
so_whats_happening replied to 40/70 Benchmark's topic in Weather Forecasting and Discussion
Seems as though I was off a bit on overall progression of near normal for the region. Warmth extended a little bit longer than previously expected. As for the AAM maybe it is because it is standardized that it is different from the CFS forecast of showing around -1.
-
2025-2026 ENSO
so_whats_happening replied to 40/70 Benchmark's topic in Weather Forecasting and Discussion
We shall see coming up here overall it may not be needed but it would have been a nice feature to have to get a more sustained pattern to set up. -
2025-2026 ENSO
so_whats_happening replied to 40/70 Benchmark's topic in Weather Forecasting and Discussion
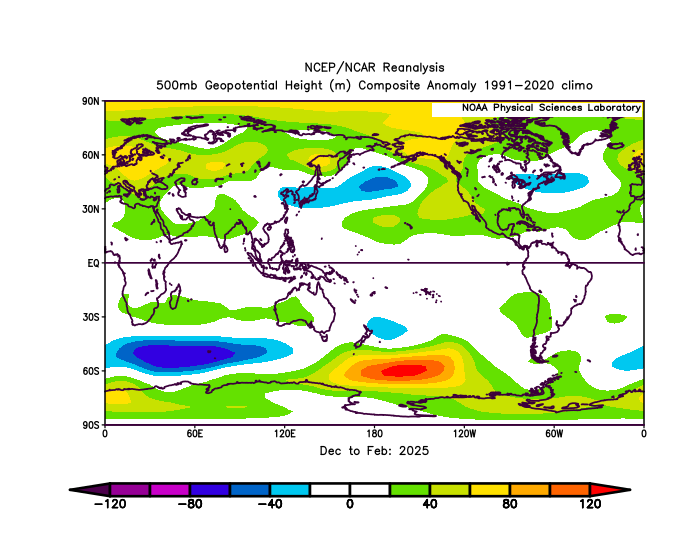
What an interesting pattern the 00z GFS showed up to 240hrs @ 10mb The 500mb maps were also very interesting, of course one run but don't think I have seen tropo/strato connection in this way with multiple 500mb lobes developing especially one still sitting in the Beaufort Sea/ CAA before. This would probably be considered a minor wave 2 event but not a whole lot of warming taking place which is something that is lacking in completely taking down the SPV..thumb.gif.6656e0906b0c1bff398c0c7187cf4c5d.gif)
-
2025-2026 ENSO
so_whats_happening replied to 40/70 Benchmark's topic in Weather Forecasting and Discussion
The issue isnt we should be doing the measuring. The issue is a reliable source for measuring there have already been 2 incidents of bad measurements in the few events we have had. When the the surrounding area is about 2.5-3" and there is clearly 2.5-3" on the ground but only 1" is reported it starts to skew climo data not in a good way. When we get paid to do virtually everything climo wise for the airport but snow is a no go it really doesn't make much sense. We still calculate the snow to liquid it doesn't take away from our duties considering for many many years it was never an issue. The numbers dropped from -1.1 (-1.2 at peak) to now -.8 becoming less coupled everyday. -
2025-2026 ENSO
so_whats_happening replied to 40/70 Benchmark's topic in Weather Forecasting and Discussion
Yea it is a fascinating climo around here. Yea I was on shift when we got that .2" lol did not expect the season to be just horrid. Unfortunately Baltimore may have some snow total issues for storms in the future. We are no longer measuring as weather observers it is across the airfield now, measured by EMS. -
2025-2026 ENSO
so_whats_happening replied to 40/70 Benchmark's topic in Weather Forecasting and Discussion
Snowiest winter near me occurred twice since 1990. 1995-96 and 2009-10 topped at around ~72" on the season for both. 95-96 had 30" in one storm, im sure you can figure out the storm, and 09-10 had back to back nearly 2 foot storms in less than a week. Just 3 years ago we set our lowest snowfall ever recorded of .9" We average around 26" -
2025-2026 ENSO
so_whats_happening replied to 40/70 Benchmark's topic in Weather Forecasting and Discussion
From December until January 2nd subsurface. You can see very little movement has occurred but there is some decent potential showing up that the WWB event showing up may in fact trigger a kelvin wave that has some umpphhh behind it. Im curious if we can finally knock out the pesky cool anomaly that has been around even during the last Nino event around 140W in the subsurface. Im not so certain we push Nino status going into Spring and summer but certainly worth watching if more WWB's start to develop as time goes on. Fun stuff! Beginning of January a bit warmer than I expected but should quickly reverse course in the next week and finally dislodge the cold across Alaska and NW Canada..thumb.gif.c96c5b0f36146a04102a552107096d07.gif)
-
Congratulations! Great job forecasting.
-
DCA _ NYC _ BOS _ ORD _ ATL _ IAH _ DEN _ PHX _ SEA -1.1 -1 -1.7 -0.5 +1.6 +1.9 +1.9 +1.6 +1
-
Man went for a warmer BOS than anticipated. Also the lack of a break in the warmth out west a bit of a surprise.
-
2025-2026 ENSO
so_whats_happening replied to 40/70 Benchmark's topic in Weather Forecasting and Discussion
I believe a +EAMT should help in maintaining the ridge in the strat and maybe inject a bit of warming aloft. If this is the case I would watch a we go into the first two weeks of January what stirs up. Also hoping we can maintain the -NAO a bit longer to finally put the nail in the coffin. -
2025-2026 ENSO
so_whats_happening replied to 40/70 Benchmark's topic in Weather Forecasting and Discussion
You can have 2 scenarios that occur. We tend to want the top-down approach for SSWs but bottom up can still be impactful for us. The issue tends to be on top-down it can start to enhance the type of pattern we want (not always of course) with blocking and many times a very wintry time period. The bottom up approach tends to mean the troposphere is experiencing the perfect conditions but things can go awry and do not tend to last as long. Over the years watching while it is nice we do focus on the 10hPa layer I tend to think we should also be focusing on 50-100hPa layers in these displacement events to give us a better understanding of how patterns shake out. This was a wind reversal in the technical sense but was a large wave 1 process that took place with actually limited warming. I think the warming is very important in conjunction with wind reversals as sort of a 1-2 punch. The Atlantic just would not cooperate with us this go around hence the lack of a wave 2 response after the displacement. The Atlantic only just started working for us in allowing, in the last about 2 weeks, this -NAO pattern to set up. If we had the stout ridge from the wave 1 process still around from early in December we would have certainly entertained the idea of a split as we finish out the month. Also don't worry many of us are still trying to better understand the connection the processes have, even myself after many years of looking over the data..thumb.gif.aa28cd3e3a18aaba3b27e364cdf6016f.gif)
-
2025-2026 ENSO
so_whats_happening replied to 40/70 Benchmark's topic in Weather Forecasting and Discussion
Here is the latest subsurface from November to present. The wind anomalies have all but halted but things are primed if we get another solid weakening event of trades. Right now we are just maintaining the Nina SST profile. I will say it is fascinating to see how active the sun has been going into winter and us getting a pronounced -NAO periods showing up now multiple times..thumb.gif.2f198aeff236b0d0767d2751f47b4a8d.gif)
-
2025-2026 ENSO
so_whats_happening replied to 40/70 Benchmark's topic in Weather Forecasting and Discussion
Fun! Let us see if it shifts more west in time, as of this look Maine and Nova Scotia get the fun. -
RONI vs. ONI
so_whats_happening replied to so_whats_happening's topic in Weather Forecasting and Discussion
I do not have an issue with the idea of what RONI is to show, which is the impact we have seen from a warming world in response of increases with CO2 and others. My issue is say we get to a point where there is such a difference that is large enough to become an error in a way. An example would be if ONI reads -.5 but RONI reads it as moderate event so < -1 creating a difference of nearly 0.5 or more do we believe the RONI value to be more representative of the atmosphere or do we believe ONI has a better handle? I guess this is the million dollar question of course. I mean they even mention it towards the end themselvesThe cyclical aspect will be interesting to follow coming up here, AMO seems to be throwing some curveballs right now I would have liked to have seen just how much difference does continue to show and maybe was used more in conjunction with seeing differences and the impact on atmospheric events in comparison to ONI values. BOM must know something more than we do in now using RONI versus ONI values. @donsutherland1 -
RONI vs. ONI
so_whats_happening replied to so_whats_happening's topic in Weather Forecasting and Discussion
These are two of the posts I wanted to bring over that sparked this conversation.
-
Lets give this a shot I am not sure if this will be able to be downloaded and opened. In the Excel sheet I created a decade by decade side by side of RONI and ONI from CPC and charted them out to get an idea of how things sort of coincided with each other (RONI, ONI). These are trimonthly readings dating back from 1950 to present, I'll let the data speak for itself but please excuse the X-axis in the charts. The numbers are just place filler for the data to the left and it would have been rather tedious and clogged up to have date and trimonthly with the charts. RONI vs. ONI.xlsx
-
2025-2026 ENSO
so_whats_happening replied to 40/70 Benchmark's topic in Weather Forecasting and Discussion
I hate to even be abhorrent to the idea of a retrogression but this is not the first time models have shown a Scandi like ridging pattern and no actual retrogression took place. I do hope that it comes to fruition but I think the Nina background state is still causing issues overall. The flow is just too damn fast even with the -WPO in the tank. I think what this could at least open up for us in the east is the potential of more precip east of the rockies and then we play the game of can it happen with cold air still holding on enough to allow snowfall. We can't keep this dry train going. -
2025-2026 ENSO
so_whats_happening replied to 40/70 Benchmark's topic in Weather Forecasting and Discussion
Ill ask my work colleague as I am also interested if there is something out there. I don't see why there wouldn't be. I start vacation this weekend into the new year so I'll have free time to finally catch up on things online (thankfully). I know I keep saying this but I will set up the thread this weekend to chat about RONI. Im still surprised so many folks are caught off guard by this warm up and the potential of it being an extensive one at that, I wouldn't go as far as to say we are 'torching' but some areas especially in the southern plains and even lower midwest could hit record territory. Been beating this warm drum since about the beginning of the month. Even with the prospects of a deep -NAO coming up this does not cause any bit of a cooldown for much of the east after christmas into the new year, as should be expected. I would not be surprised to see temps get to average if not slightly below average a few times during the week before the end of the year but overall much of the cold that has been across the eastern 1/3rd of the country should take a solid beating on the monthly scale. The cold is locked in Alaska and NW Canada I do expect as we get into the new year and especially after the first week for us to push a more normal state temp wise and eventually that cold should dislodge and make a run into the CONUS. We should know the models have a hard time grasping these types of pattern evolving (the potential retrogression) just like they tend to rush a -NAO out much quicker than reality suggests. -
2025-2026 ENSO
so_whats_happening replied to 40/70 Benchmark's topic in Weather Forecasting and Discussion
Nice looks like the call for a trimonthly of ~ -0.6 was a good call. Should continue to rise from here slowly. Unfortunately I do not think this will be an 'official' La Nina based on ONI numbers but darn close like last year. Still liking my call of about the week of Christmas into the new year being the warm up time frame leaving the tail end of phase 8 into 1. Here is an updated subsurface from beginning of October to December 1st. Also @donsutherland1 I'm still working on chatting with you about RONI. I may just create a different thread and tag you instead of keeping it in this one, we will see. Hope to be done by this weekend. Work and life just taking precedence right now unfortunately..thumb.gif.fef884beb57aaa9892dc228e3b124baa.gif)
-
DCA _ NYC _ BOS __ ORD _ ATL _ IAH __ DEN _ PHX _ SEA -1.4 -1.3 -1.6 -2.6 +.8 +1.2 +1.1 +2.1 +.6 DCA _ NYC _ BOS ___ ORD _ DTW _ BUF __ DEN _ SEA _ BTV 14" 23" 39" 42" 40" 91" 38" 4" 87" Sorry im late, time just flies by.
-
2025-2026 ENSO
so_whats_happening replied to 40/70 Benchmark's topic in Weather Forecasting and Discussion
https://www.cpc.ncep.noaa.gov/products/precip/CWlink/MJO/Composites/Temperature/


.gif.0d0706d840113a9e2f09addcdc8a5351.gif)

.gif.75bdf5ae326c56fd192e4a9230a5b389.gif)
.gif.68e8ac736b9ea384d65b607322f40c68.gif)
.gif.67489d4eb9462e976c7ac38b7e4a1995.gif)
.gif.59f481e87ce86cba7dd7edf152c4f8e7.gif)