so_whats_happening
-
Posts
1,581 -
Joined
-
Last visited
Content Type
Profiles
Blogs
Forums
American Weather
Media Demo
Store
Gallery
Everything posted by so_whats_happening
-
DCA _ NYC _ BOS __ ORD _ ATL _ IAH __ DEN _ PHX _ SEA -1.4 -1.3 -1.6 -2.6 +.8 +1.2 +1.1 +2.1 +.6 DCA _ NYC _ BOS ___ ORD _ DTW _ BUF __ DEN _ SEA _ BTV 14" 23" 39" 42" 40" 91" 38" 4" 87" Sorry im late, time just flies by.
-
2025-2026 ENSO
so_whats_happening replied to 40/70 Benchmark's topic in Weather Forecasting and Discussion
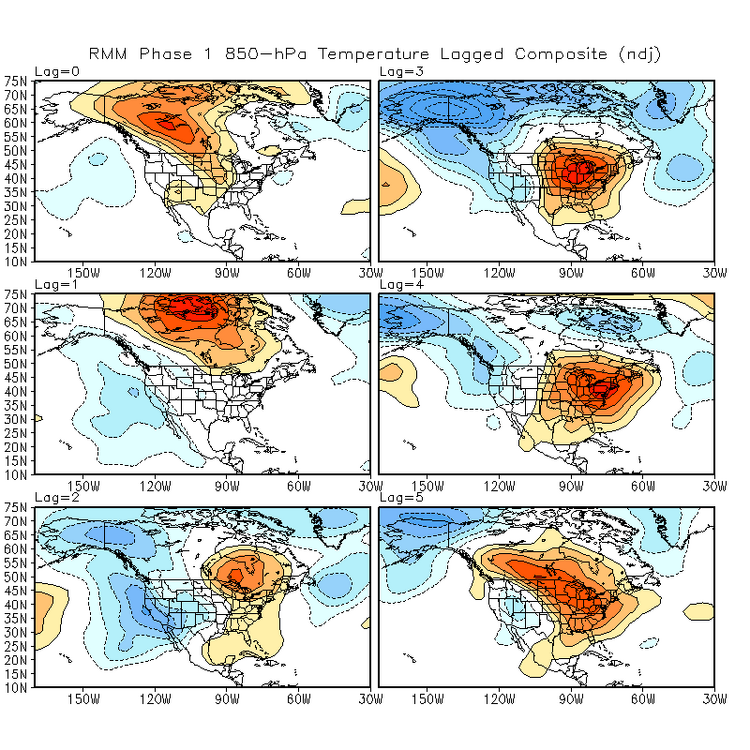
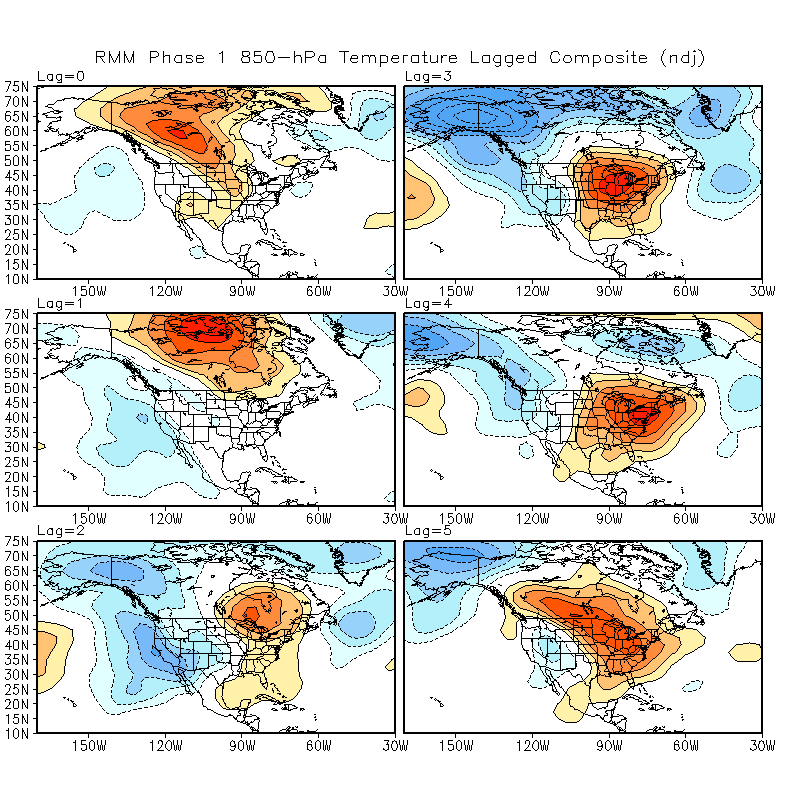
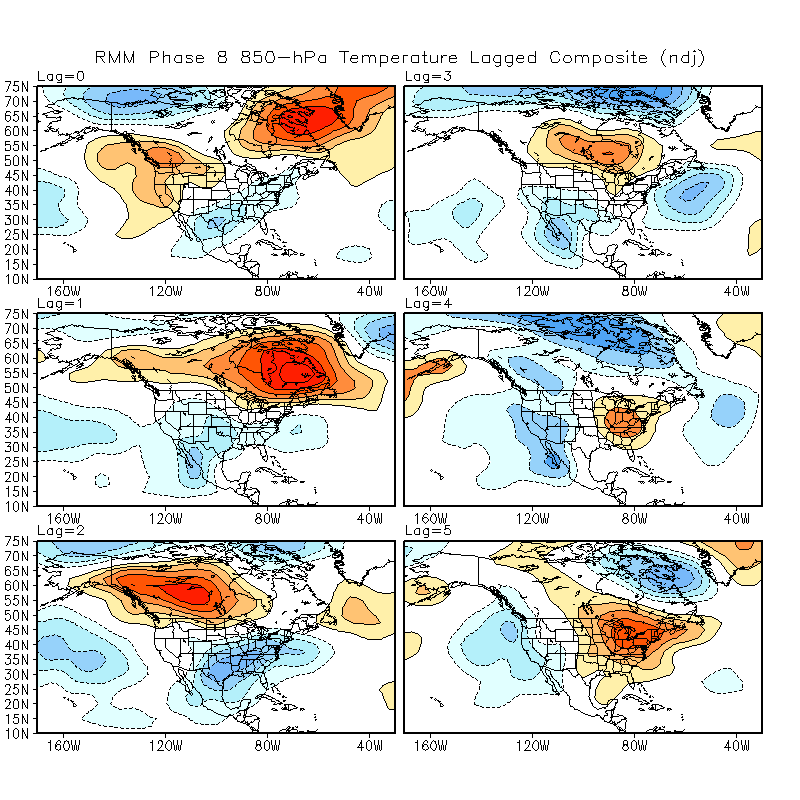
https://www.cpc.ncep.noaa.gov/products/precip/CWlink/MJO/Composites/Temperature/ -
2025-2026 ENSO
so_whats_happening replied to 40/70 Benchmark's topic in Weather Forecasting and Discussion
It is based on RMM phases not specific to La Nina or El Nino. Phase 8/1 doesn't become as conducive until we head into January and February for the east. I wouldn't expect blazing temps but I certainly wouldn't expect downright frigid outside of the colder period until about mid December/3rd week. Still feel pretty confident in the warming potential as we move into christmas week and the new year. Surely things can change and it will be interesting to see if it does but overall I would expect near normal through much of the east with above normal across the SE. The true test will be what happens with the December 2nd/3rd system and how that sets up. We will be able to see if the models are overzealous in either direction with respect to the SER or cold pressing into SE Canada. -
2025-2026 ENSO
so_whats_happening replied to 40/70 Benchmark's topic in Weather Forecasting and Discussion

-
2025-2026 ENSO
so_whats_happening replied to 40/70 Benchmark's topic in Weather Forecasting and Discussion
I would put the warm up around the week of christmas (unfortunately) and into the new year as of now. The MJO is in no real hurry so we may not get into 1/2 until January but start the warm up process at the tail-end of the potential phase 8. Going to be a tough forecast for December in the temp anomaly contest thread. -
2025-2026 ENSO
so_whats_happening replied to 40/70 Benchmark's topic in Weather Forecasting and Discussion
Subsurface has been in a steady state for a bit now but we are starting to see a sharpening of the thermocline both warm and cold pockets so we may have some impact starting to show up in the 2 weeks from the MJO..thumb.gif.55e24896f9c5cb21f7d2233e9adbca79.gif)
-
2025-2026 ENSO
so_whats_happening replied to 40/70 Benchmark's topic in Weather Forecasting and Discussion
Honestly I wish it could be as simple as saying we are going into a phase 8 pattern thus it should look like this. The issue going on is we are still in a Nina like background state but we are getting intrusions of Nino like features popping up. I honestly never thought this setup would work out as well as it is. Lets see how things continue
-
2025-2026 ENSO
so_whats_happening replied to 40/70 Benchmark's topic in Weather Forecasting and Discussion
This is a wonderful site for people to get lessons from and implore many folks to check it out. There are a few tropical courses that touch on this subject of SPV and MJO propagation that could be very useful. I believe it is still free and no student email is needed. https://www.meted.ucar.edu/ -
2025-2026 ENSO
so_whats_happening replied to 40/70 Benchmark's topic in Weather Forecasting and Discussion
This is correct. So in QBO-E years it is fairly typical to see a disturbed SPV early on just as we are seeing in November and early December, namely a wave 1 response takes place. QBO-W years tend to have this take place around January leading to a stronger SPV (take last year as an example. The wave 1 response is due in part to a strong MJO passage through phase 3. Within about 2-3 weeks we typically see the passage through phase 7 (which is about where we are). The phase 7 is tricky though because it does not always push into a split scenario but I think we have a better chance with a much more pronounced stratospheric ridging staying in place and strength. I would like to see more negatively tilted troughs into the Atlantic to start to get more excited for that potential, these are the mechanisms to allow for poleward eddy flux versus a deflection as bluewave has noted. The Pacific has shown many negatively tilted troughs over the past few weeks hence the already well pronounced ridge. I hope we can get some type of Scandi ridging in the troposphere as we move into December. This is why I have been saying for awhile now I will wait to see that potential split scenario as we get close to the end of December but this remains to be seen. First let us actually have a push into phase 7 and see how the pattern lands. I will not be surprised to see with this displacement event a brief period of wintry weather in December (mid month area) to us quickly recovering and maybe having an early January 'thaw' type setup. -
2025-2026 ENSO
so_whats_happening replied to 40/70 Benchmark's topic in Weather Forecasting and Discussion
No, there is nothing to suggest it even goes above average as we move into January. -
2025-2026 ENSO
so_whats_happening replied to 40/70 Benchmark's topic in Weather Forecasting and Discussion
This is impressive to see though models are showing the potential destruction of the Nina like atmosphere coming up as we go into December. This really should kick into effect a downwelling kelvin wave from the warm pool sitting around 160E below the surface.
-
2025-2026 ENSO
so_whats_happening replied to 40/70 Benchmark's topic in Weather Forecasting and Discussion
Yes there has been nothing to suggest more than a displacement event taking place. The warming overall is very muted and while the semi-permanent ridging is impressive leading to a much weakened zonal flow there is more to it than just a weakened zonal flow. The SPV is still very much intact just getting knocked around for now. This certainly feels like there is potential for a 2-3 week period of wintry like effects as we get to mid December and on due to this. -
2025-2026 ENSO
so_whats_happening replied to 40/70 Benchmark's topic in Weather Forecasting and Discussion
Sorry life has been something else the last week. I would like to revisit this hopefully over the weekend I get some free time to chat about this and go further. Ill take a look at the article/ journal you posted then. -
2025-2026 ENSO
so_whats_happening replied to 40/70 Benchmark's topic in Weather Forecasting and Discussion
This might help you out https://acd-ext.gsfc.nasa.gov/Data_services/met/ann_data.html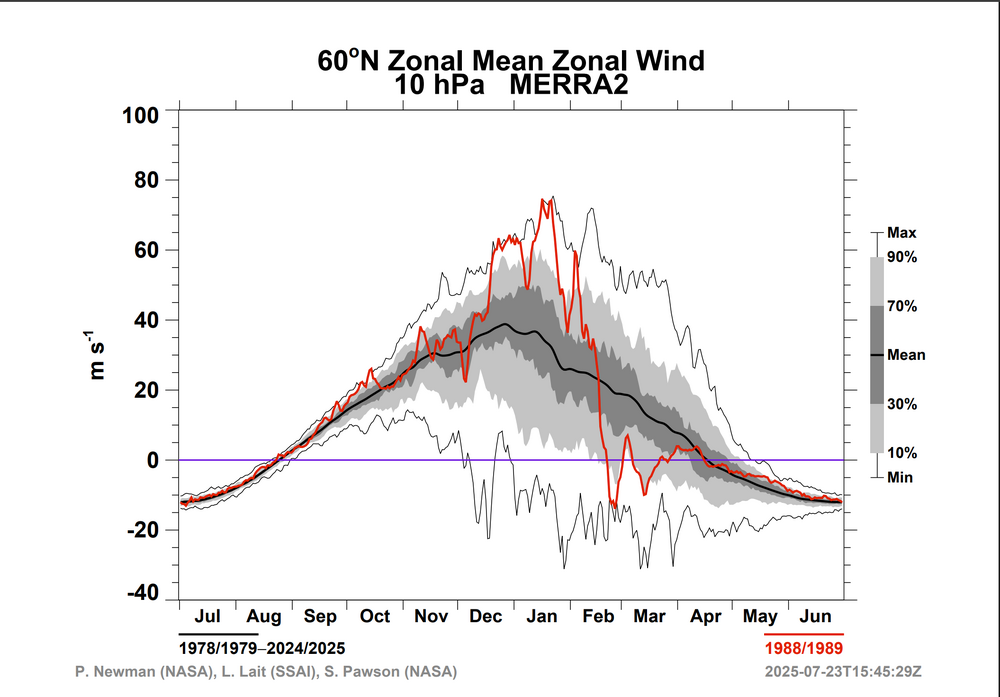
-
2025-2026 ENSO
so_whats_happening replied to 40/70 Benchmark's topic in Weather Forecasting and Discussion
Oh man I feel like we go through this every winter. Warmings occur all the time this is not a new occurrence by any means. I do like to see there is some connection through the layers to show maybe some extended connection as we go through time but anything past 240hr is typically a crapshoot call even with something like the stratosphere which doesn't tend to have too much change. My biggest issue with the use of RONI being implemented what if for some reason this process does actually switch up and ONI does become more representative than RONI are we going to switch back to using ONI data as reliable indication of Nina/Nino severity? To me RONI is like the equivalency of saying well if we take out the warming of the last 50-100 years in something like air temperature (just an example) to show that in fact temps would have been cooler during this time period to me means nothing. Ok we have deduced that it is warmer now than in the past. The processes that are involved with ENSO/ IOD/ PDO/ AMO have not seemingly changed, they all still evolve in the same manner. Are we trying to say that RONI is showing enhancement of La Ninas specifically? Are you and bluewave stating that because RONI showed -1.12 last winter for DJF that the winter acted like a moderate La Nina versus cold neutral? I mean just taking a quick glance at years of similar ONI where we never officially hit Nina status by measurements (some awfully close like last year). I did not match scales so forgive me on that. Only difference I see is a slightly more poleward low position in the pacific. I feel this is more of a PDO situation.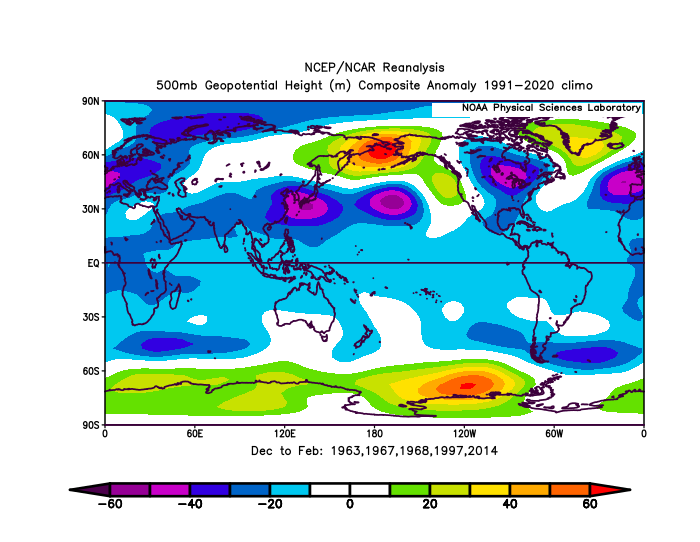
-
2025-2026 ENSO
so_whats_happening replied to 40/70 Benchmark's topic in Weather Forecasting and Discussion
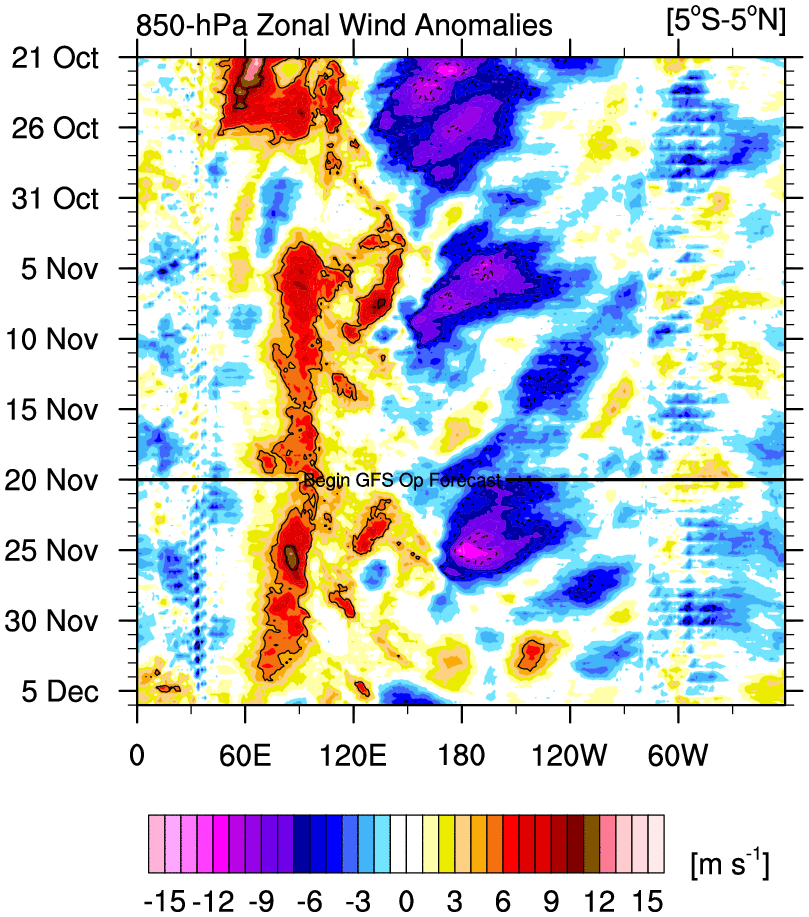
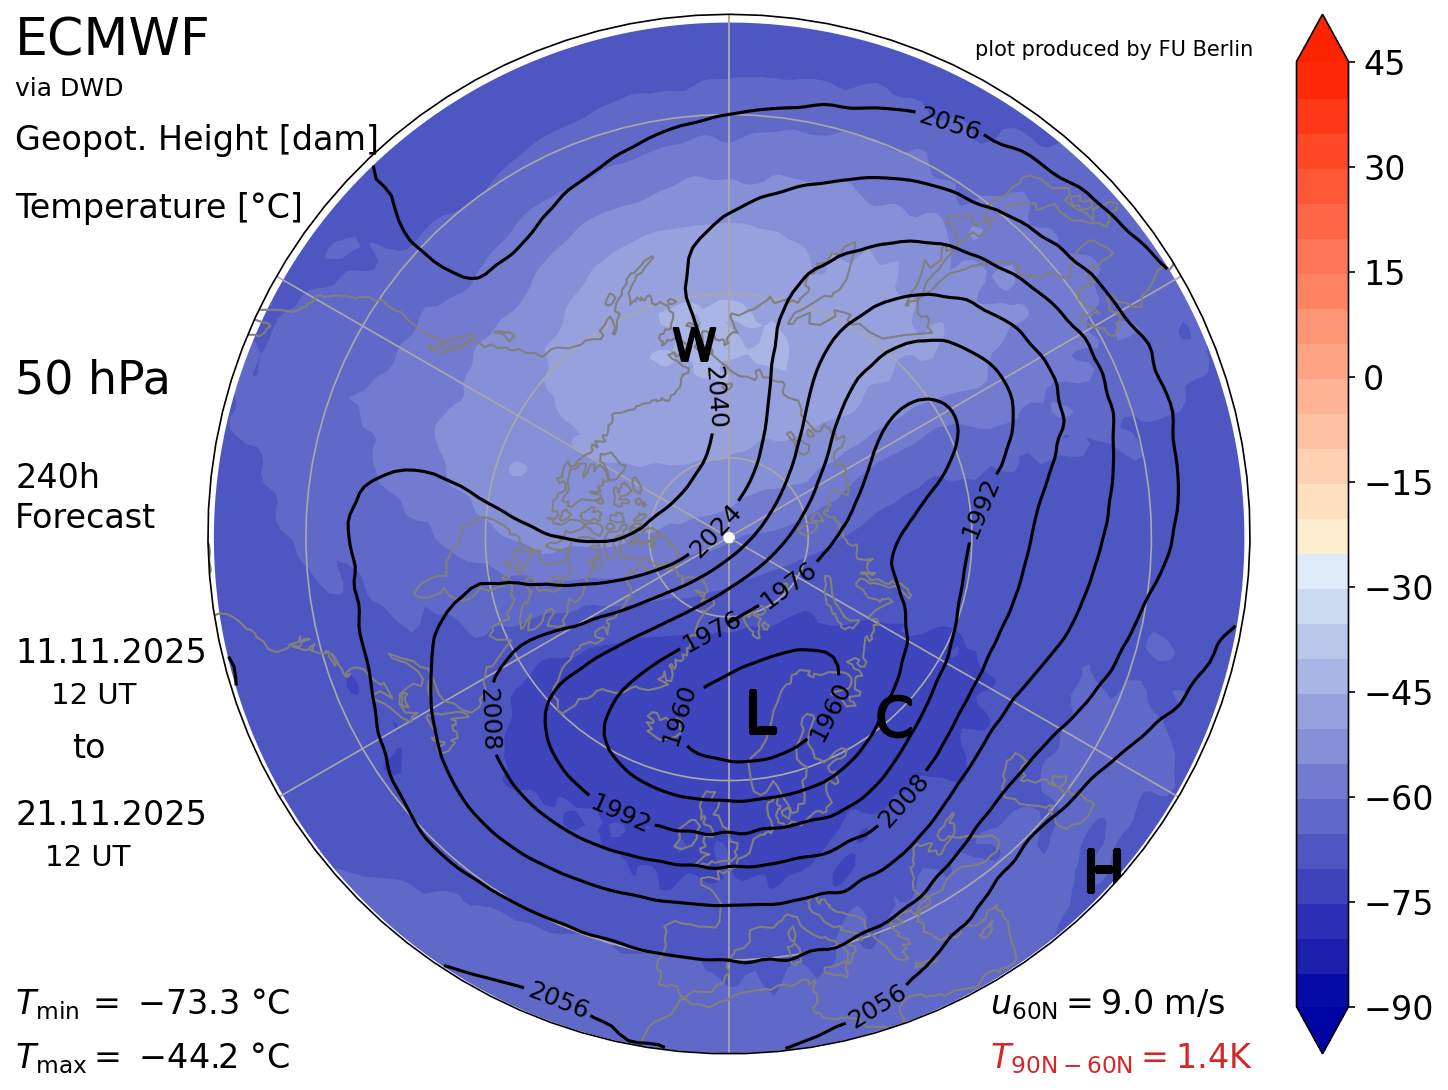
This is turning into a nice wave 1 displacement event as we go into the end of the month. Shame we lose the -NAO signal and it is not allowed to grow with depth. Here is the 50mb Euro 240hr forecast for the SPV we did not have the classic approach of a Scandinavian high retrograding into the NAO domain we typically see that helps enhance a wave 2 response so the -NAO is rather shallow in the atmosphere. Now the question becomes then after this relaxation period in the troposphere do we see a re-emergence of the -NAO as aloft ridging(through the strat) gets pushed over into the NAO domain and we somehow get a connection through the layers? This has been a theme of these events (this one still looks rather mild) over the last 5 or so years. This is not looking like a significant warming event as of now. It is pretty rare to see something major this early I would look closer to the new year and there after for potential if we can maintain a weakened SPV. Sorry they loaded as 2 pdfs versus visuals. Heat flux.pdf Zonal wind.pdf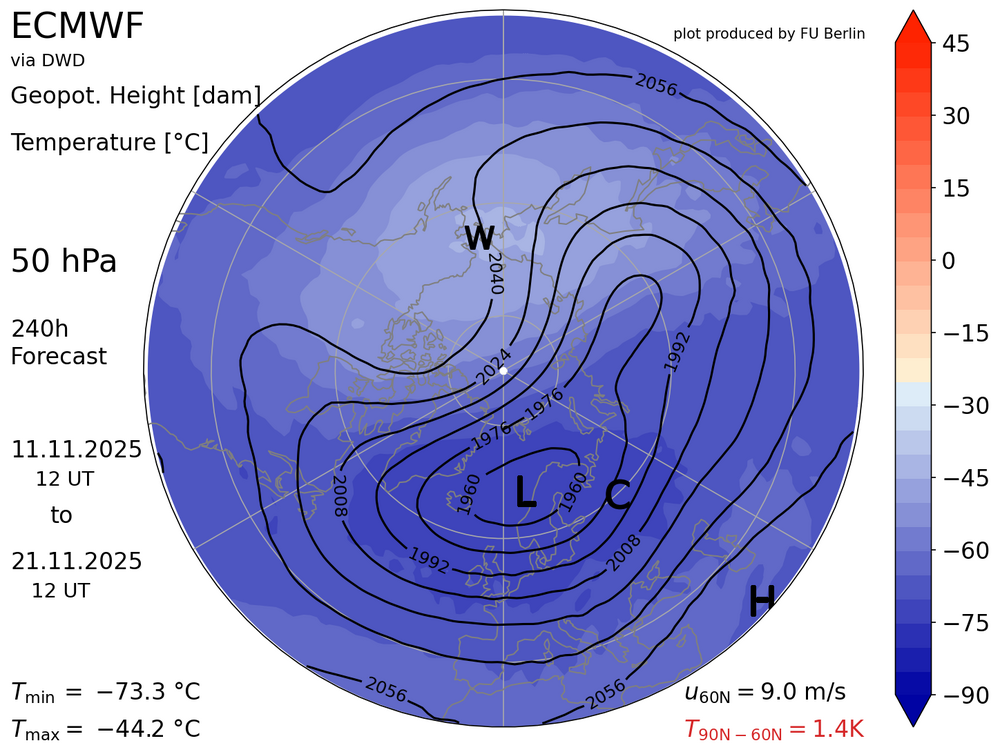
-
2025-2026 ENSO
so_whats_happening replied to 40/70 Benchmark's topic in Weather Forecasting and Discussion
This is the wonderful thing of strong blocks and poleward flux. Ill have to take a look back and see what exactly caused the flow to buckle so much over the last 2-3 weeks. -
2025-2026 ENSO
so_whats_happening replied to 40/70 Benchmark's topic in Weather Forecasting and Discussion
Lol parade of storms you would be lucky to get one maybe two good KU style storms in a season during the performative Nino style years. My goal this year is one 1 foot snowstorm and move on. Who knew that La Ninas produced quite the rains starting to show up for central and southern California in the medium range. -
2025-2026 ENSO
so_whats_happening replied to 40/70 Benchmark's topic in Weather Forecasting and Discussion
If you don't wish to post photos it is fine, I do wish you would at least reference the sites so that people could see what you are mentioning is all.

-
DCA NYC BOS ORD ATL IAH DEN PHX SEA 1.1 1.4 1.9 1.4 1.1 2.1 2.4 2.4 .8
-
2025-2026 ENSO
so_whats_happening replied to 40/70 Benchmark's topic in Weather Forecasting and Discussion
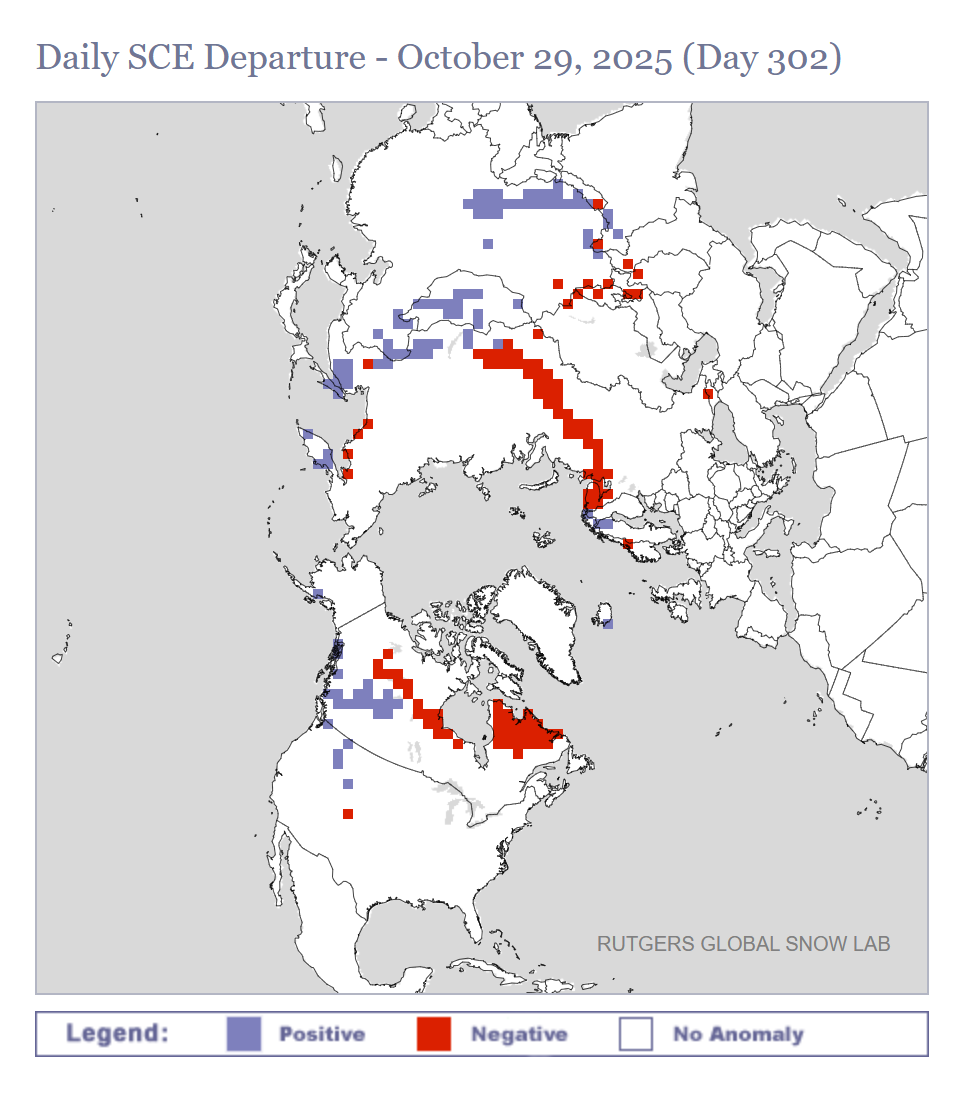
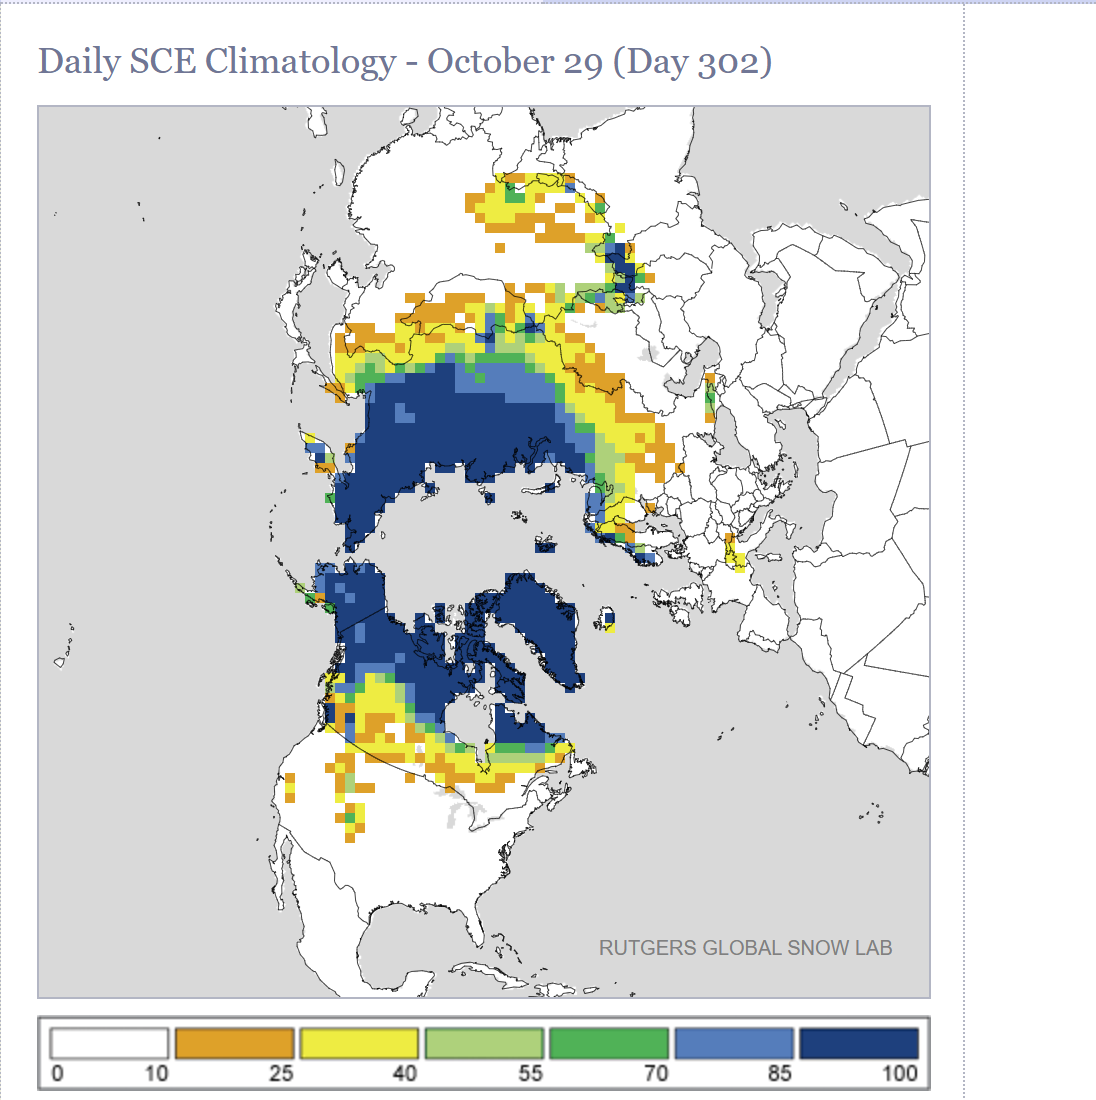
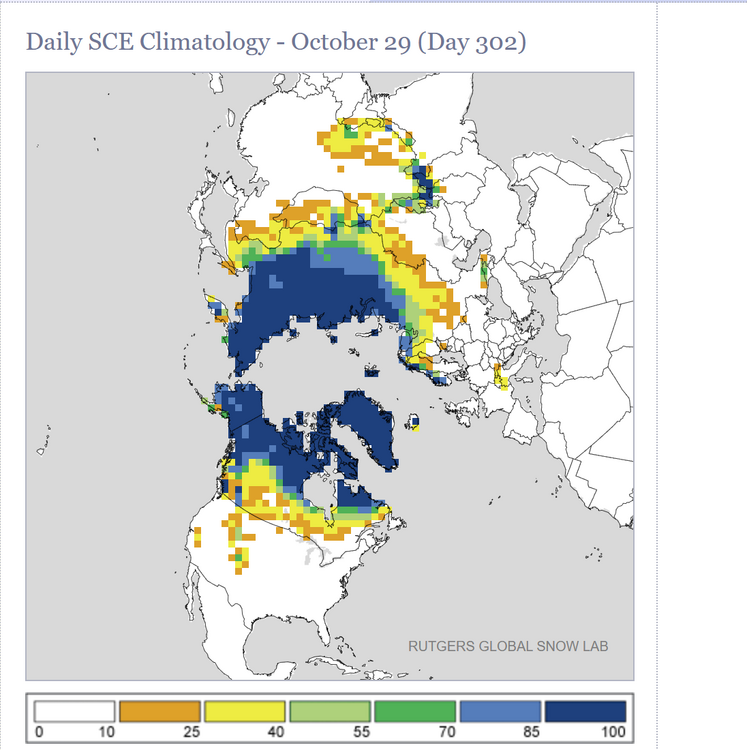
If you are going to show a snowfall coverage map you need to include the departure from average as well. Blocky but gets the point across. The first shows departures from climo and the second shows what climo should look like this time of year. Based on September 1970- August 2000. https://climate.rutgers.edu/snowcover/chart_daily.php?ui_year=2025&ui_day=302&ui_set=2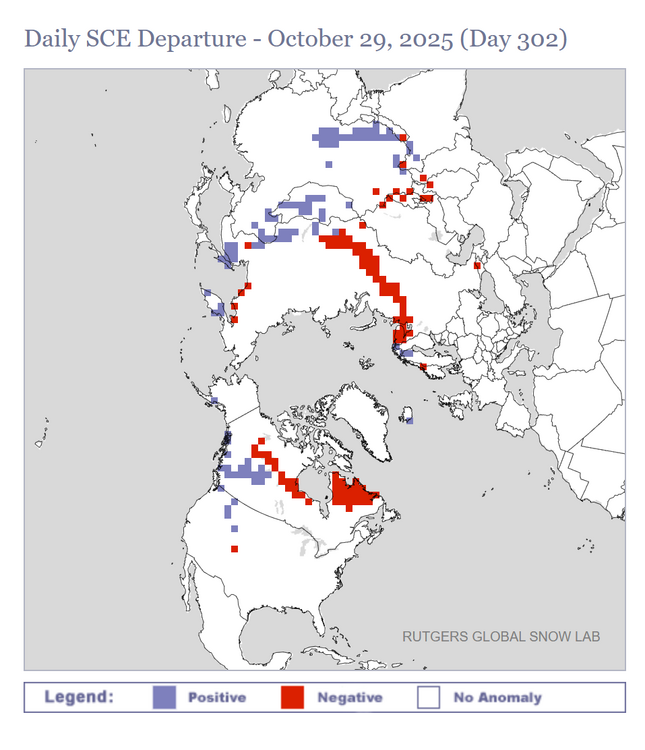
-
2025-2026 ENSO
so_whats_happening replied to 40/70 Benchmark's topic in Weather Forecasting and Discussion
Ehh he put words together to still make him relevant that is about all I got from it. -
2025-2026 ENSO
so_whats_happening replied to 40/70 Benchmark's topic in Weather Forecasting and Discussion
I still do not know why you guys focus so much on this guy. If you have issues with what he says call him out on the platform he is posting this information on. -
2025-2026 ENSO
so_whats_happening replied to 40/70 Benchmark's topic in Weather Forecasting and Discussion
Love the confidence but have my doubts To add according to the post by GAWX earlier the IOD normalized was positive in 1967 -
2025-2026 ENSO
so_whats_happening replied to 40/70 Benchmark's topic in Weather Forecasting and Discussion
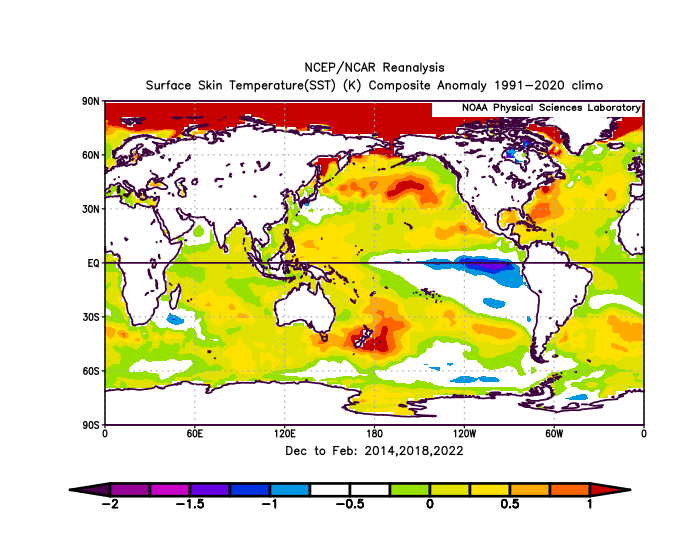
I equate this IOD event to something similar like 2019/20 season. That IOD event was on par to some the most intense Nino events we have seen in the last ~30 years (1997/98, and 2015/16) yet when it came to oceanic temps we hit weak Nino status that year. If you look at the subsurface during this time you also had a downwelling kelvin wave in September and October making it look like we were about to really see this event go. I think the IOD in this case simply made it so the Nina like conditions stayed around just enough versus us pushing into weak Nino territory this year. I will say though subsurface on this event is deteriorating rather fast though there is a small chance we hit a trimonthly of about -0.6.


.gif.9e899df009896fb0fef1c25165d05a21.gif)