

so_whats_happening
-
Posts
1,590 -
Joined
-
Last visited
Content Type
Profiles
Blogs
Forums
American Weather
Media Demo
Store
Gallery
Everything posted by so_whats_happening
-
2025-2026 ENSO
so_whats_happening replied to 40/70 Benchmark's topic in Weather Forecasting and Discussion
Man a lot to catch up on but it surely has been fun watching the forecasts for MJO over the last week or so. Also just saw OISST just updated they have been doing upgrades so things have been delayed quite a bit, call me whatever but I have this feeling we bottomed out already for ONI numbers will have to see as we go into early October if we continue to see it flatline if not rise. I forget how to look the post up for this I made earlier in the thread but still liking the idea of this look as we go into winter.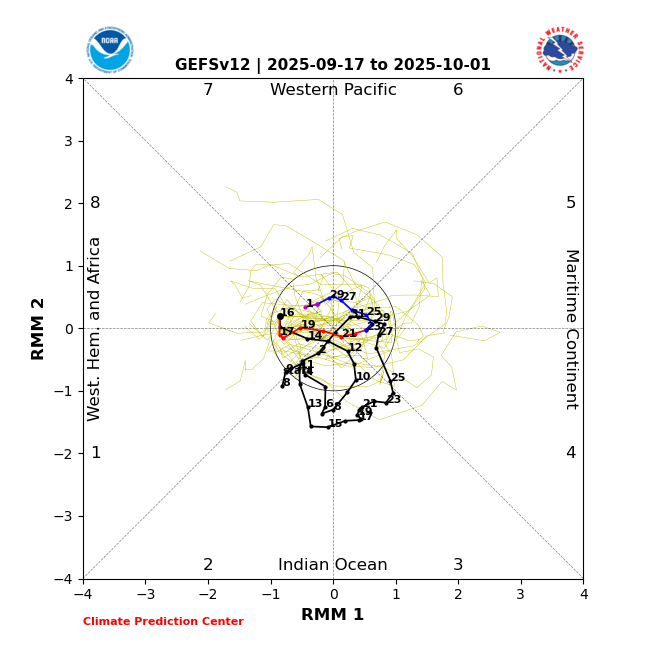

-
2025-2026 ENSO
so_whats_happening replied to 40/70 Benchmark's topic in Weather Forecasting and Discussion
Not necessarily but it should help chances. -
2025-2026 ENSO
so_whats_happening replied to 40/70 Benchmark's topic in Weather Forecasting and Discussion
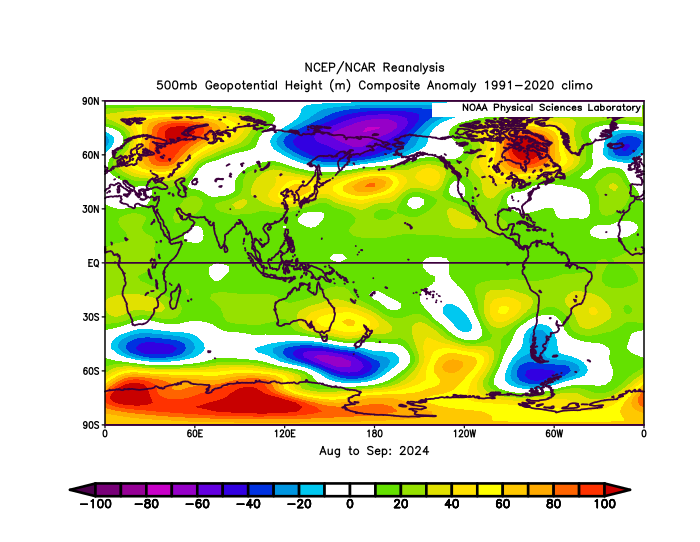
Lucky for you I have an anomaly map I saved from last year around this time. Im going to have to delete some images from earlier on this thread and last thread because im running out of space again. 400mb is a killer
-
2025-2026 ENSO
so_whats_happening replied to 40/70 Benchmark's topic in Weather Forecasting and Discussion
Never said it was going to warm back up only said the pattern is still well entrenched, but we are continuing to see changes occur (slowly). The storm track was much further north last year than this year. Here is the first 25 days of August last year and this year. (Can't get to the end of the month because it has not updated) Here is August and September last year storm track significantly further north and toward the Bering sea with a strong low.
-
2025-2026 ENSO
so_whats_happening replied to 40/70 Benchmark's topic in Weather Forecasting and Discussion
Nice little storm took place in the north Pacific this past week. Wiped a out some of the warmer waters, but still very much entrenched though. Need quite a few more larger systems to really knock it out. The most noticeable change from last year to this year is the cool pool is not set up in the Bering sea or gulf of Alaska.
-
2025-2026 ENSO
so_whats_happening replied to 40/70 Benchmark's topic in Weather Forecasting and Discussion
They have been in every season for some time now. While daytime does get to some extreme levels for the different times of the year consistently the nights are well above average in every season. The most noticeable of seasons at least around here has been in winter. I mean it was like 2 years ago I think we had one evening below 20F around Baltimore the entire winter the rest were in the 25-35 range, that is huge in winter around here. -
2025-2026 ENSO
so_whats_happening replied to 40/70 Benchmark's topic in Weather Forecasting and Discussion
Last year to this year look at the subsurface.
-
DCA _ NYC _ BOS ___ ORD _ ATL _ IAH ___ DEN _ PHX _ SEA -.3 0 +.2 +.3 -.5 -.5 +1.2 +1.4 +1.3 Sorry late by a few hours again
-
2025-2026 ENSO
so_whats_happening replied to 40/70 Benchmark's topic in Weather Forecasting and Discussion
Also wanted to post the latest for July and August via TAO on the subsurface look between 2N and 2S..thumb.gif.62b3ab872b6d52afd701d41cc007a7bf.gif)
-
2025-2026 ENSO
so_whats_happening replied to 40/70 Benchmark's topic in Weather Forecasting and Discussion
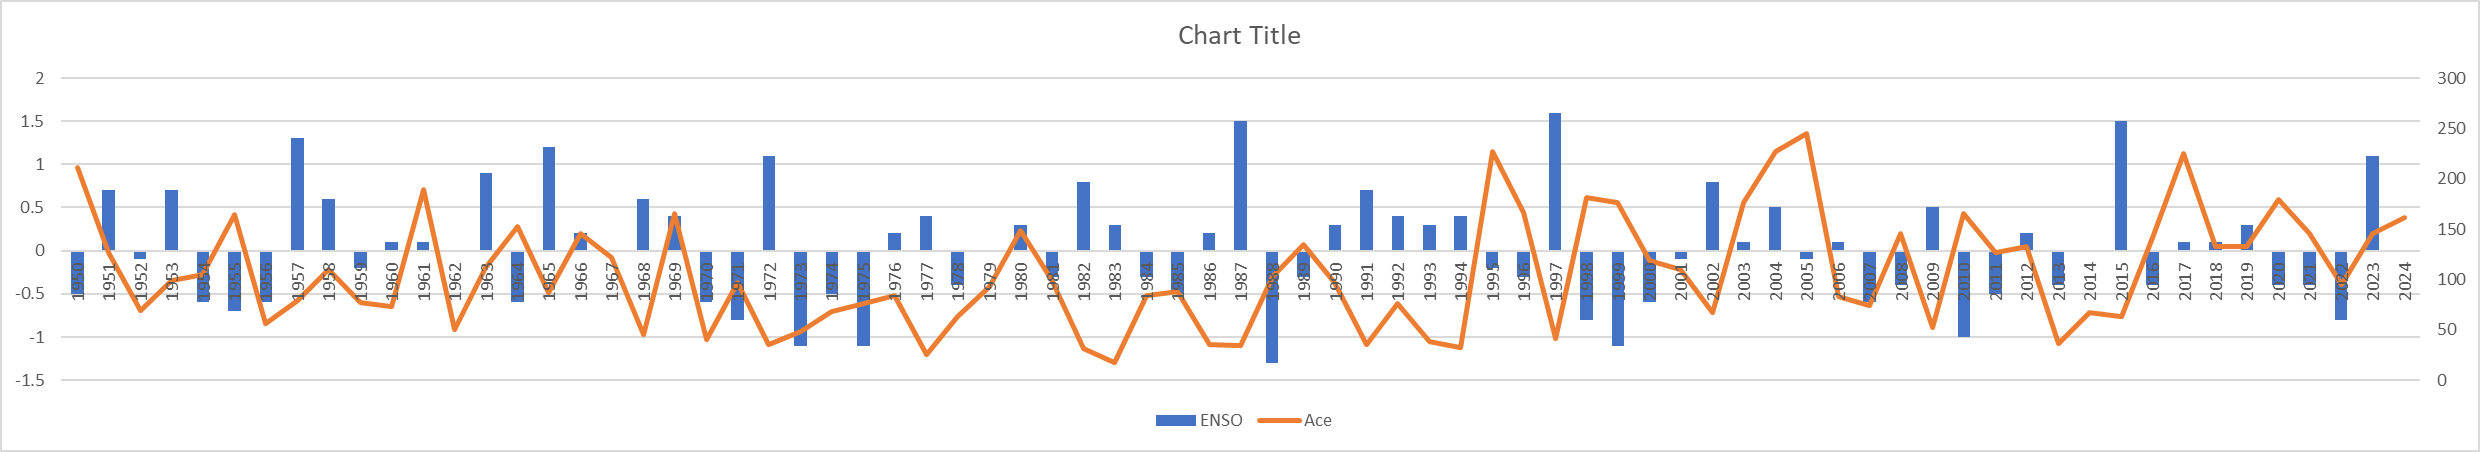
Did a very quick rather busy chart on excel. Basically it is the JJA ENSO data from CPC in blue and Ace numbers for the season in orange. Now this doesn't help explain where we came from like previous winter may have been Strong Nino and we crashed to weak nina by summer as an example which could play a role. This is for every year from 1950 to 2024. Edit: Had to fix it so you could see every year. Shame it does not have dots for Ace to see the years better.
-
2025-2026 ENSO
so_whats_happening replied to 40/70 Benchmark's topic in Weather Forecasting and Discussion
Looks like we circle 1-2-3 again coming up through the last 3 weeks of September, some even show 8 with the cool neutral look we currently have (we wlll see). Should open up the door for a handful of systems but where we go into October will leave us with clues going into winter. Definitely weird we would have a slow season if we are indeed in a Nina state as well as getting recurves typically not a normal occurrence of being in a Nina state and a cool ending to summer also does not add up either. -
2025-2026 ENSO
so_whats_happening replied to 40/70 Benchmark's topic in Weather Forecasting and Discussion
Yea it was interesting to watch the Beaufort region this year not many years have remained intact in this region. If we did not have such an abysmal growth season we could have managed a rare positive uptick within the downtrend. Will be interesting to see when we officially hit the floor and just how the beginning of the season sets up. We did just get a massive warm region showing up over the last couple months in the Atlantic near northern Europe that im sure will play a role in how this year goes for growth. -
2025-2026 ENSO
so_whats_happening replied to 40/70 Benchmark's topic in Weather Forecasting and Discussion
Nice 90 day loop -
2025-2026 ENSO
so_whats_happening replied to 40/70 Benchmark's topic in Weather Forecasting and Discussion
Seems reasonable the atmosphere looks really nice coming up and in a good warm pocket. Should at least get 3 days of major hurricane status. -
2025-2026 ENSO
so_whats_happening replied to 40/70 Benchmark's topic in Weather Forecasting and Discussion
Rough guesstimate depending on just how strong the system gets coming up here but we should get close to about 30 ACE on the year which for the date will be just slightly above average, have 6.6 right now. Will be interesting if we get any follow up storms after this one to end out the month. https://tropical.atmos.colostate.edu/Realtime/index.php?loc=northatlantic -
2025-2026 ENSO
so_whats_happening replied to 40/70 Benchmark's topic in Weather Forecasting and Discussion
It is the same issue I had with folks thinking there were not 2013/14 style patterns showing up last season but since it did not snow nearly as much last year it was not a match. Not everything is exact and unfortunately you will not change the minds of folks, it is what it is. To redistribute that amount of warming you likely need consistent typhoon recurves and at that strong consistent synoptic activity coming off China/ Koreas/ Japan. Tropical activity has been very sluggish in the WPAC for some time and when we do have activity the main track has been almost due west at low latitudes with the stronger systems (maybe 1 or 2 systems in a season actually recurving) or 'home grown' systems (close to land formation). Honestly let's just see how it all plays out. -
2025-2026 ENSO
so_whats_happening replied to 40/70 Benchmark's topic in Weather Forecasting and Discussion
I mean there is a lot of warmth with depth that has yet to be mixed. We do need much more in the way of tropical/ synoptic activity to really overhaul this region which will take time. There is definitely a noticeable shift trying to take place but the pattern is still very much entrenched across the region. As much as I want it to change it still needs time to make these changes.
-
2025-2026 ENSO
so_whats_happening replied to 40/70 Benchmark's topic in Weather Forecasting and Discussion
Pick your poison a week plus out you either get the threat of TC landfall and warmth over much of the East or you get cool and storms get scooped up out to sea. -
2025-2026 ENSO
so_whats_happening replied to 40/70 Benchmark's topic in Weather Forecasting and Discussion
I still find it very weird that we can use new baselines and the anomalies that are associated with them as facts (especially temps) but yet we use this chart above as fact taking out that baseline increase... https://psl.noaa.gov/map/clim/sst.anom.anim.week.html https://coralreefwatch.noaa.gov/data_current/5km/v3.1_op/animation/gif/ssta_animation_30day_large.gif -
2025-2026 ENSO
so_whats_happening replied to 40/70 Benchmark's topic in Weather Forecasting and Discussion
It is trying we need to continue to see the onslaught of tropical/ synoptic activity holding the ridging pattern out there at bay. It more so looks at this point the waters are just being displaced yet again across the region like we saw last year. One noticeable feature has been the warming of waters around the Bering Sea versus the last couple of years where we saw a large cool pool which would thwart any effort into ridging staying in the EPAC. Still got a long ways to go but good signs none the less. Kind of still liking this idea of a 500mb pattern as we get into winter. It allows some relaxing of the horrible winter pattern we have had over the last at least 5 years across the Mid Atlantic.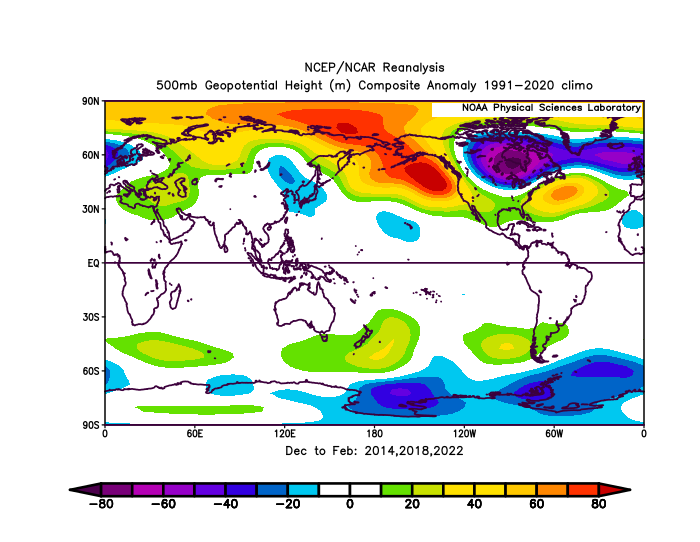
-
2025-2026 ENSO
so_whats_happening replied to 40/70 Benchmark's topic in Weather Forecasting and Discussion
Legitimately if this had not started out as one of the lowest winter time volumes recorded this would have been an amazing retention year. The pattern was damn near perfect to lock in ice and cooler temps. The biggest help has been the lack of Canadian warmth up to the Archipelago. I don't even think the NW passage will open this year given we have about 3-4 weeks left of melt, unless this pattern completely flips on us. -
2025-2026 ENSO
so_whats_happening replied to 40/70 Benchmark's topic in Weather Forecasting and Discussion
Should have saved this until tomorrow but whatever here is all of June/July and the 1st of August..thumb.gif.0021e29577555823a16db19042180018.gif)
-
2025-2026 ENSO
so_whats_happening replied to 40/70 Benchmark's topic in Weather Forecasting and Discussion
To me at least this is telling me we are slowly cooling off the WPAC with no real discernable changes in the central and EPAC with SST. Baby steps. -
2025-2026 ENSO
so_whats_happening replied to 40/70 Benchmark's topic in Weather Forecasting and Discussion
Yea TAO has the cool pool further west and a smidge cooler. Overall though placement of warm anomalies isn't too far off from each other. This is the second weakening of trades that has occurred over the summer last was around early June so I'm curious if we start to see the westerlies that have been stuck around 90E start to wane in any shape and develop further east toward the maritime continent (120-150E). We still keep getting random bouts of a Nino like response even with the -PDO where it is and the weak cool/ neutral SST profile.


.gif.0189dd4b12ebe985883091371d289dfa.gif)


.gif.e9d1e3089fe326ec88e0a635e4a7cab5.gif)
