

so_whats_happening
-
Posts
1,581 -
Joined
-
Last visited
Content Type
Profiles
Blogs
Forums
American Weather
Media Demo
Store
Gallery
Everything posted by so_whats_happening
-
DCA _ NYC _ BOS ___ ORD _ ATL _ IAH ___ DEN _ PHX _ SEA +1.7 +1.6 +2.1 +1.4 +1.1 +1 +2.1 +1.3 +2.1
-
Typically the low will occur just before sunrise and the high will occur in the afternoon. Weather conditions of course change this up but to simplify it if you were to have for example 83/62 as your forecasted high and low. The high will occur around 2-5pm (depending on the season) and the low will usually occur 3am-6am. The low temp is usually going into not coming from. So if you happen to have a low of 58 in the morning when hitting that 83 forecast that same day the low going forward is forecast to be 62 for the next morning. So the day before the forecast would have maybe looked like 78/58 going into the 83/62. When the low or high hits it may just be for a brief moment and not a multi hour situation. Hope this helps.
-
2025-2026 ENSO
so_whats_happening replied to 40/70 Benchmark's topic in Weather Forecasting and Discussion
While oceanic temps have definitely increased probably the most drastic of changes has been in the Arctic over the last 50 years I feel this probably is the biggest reason we have been having issues with pattern semblance over the last decade or two, more notably. It may very well be the reason for such changes to the PDO state but im not ready to make those accusations or conclusions. Over the last 5 years the Antarctic has suffered rather drastic changes to the ice sheet I wonder if we start seeing similar results within the southern hemisphere as we have seen in the northern with the idea of permanence taking shape. -
2025-2026 ENSO
so_whats_happening replied to 40/70 Benchmark's topic in Weather Forecasting and Discussion
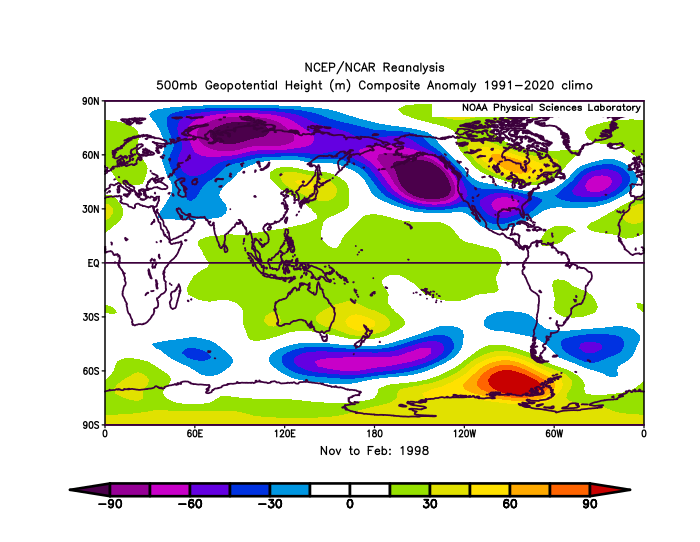
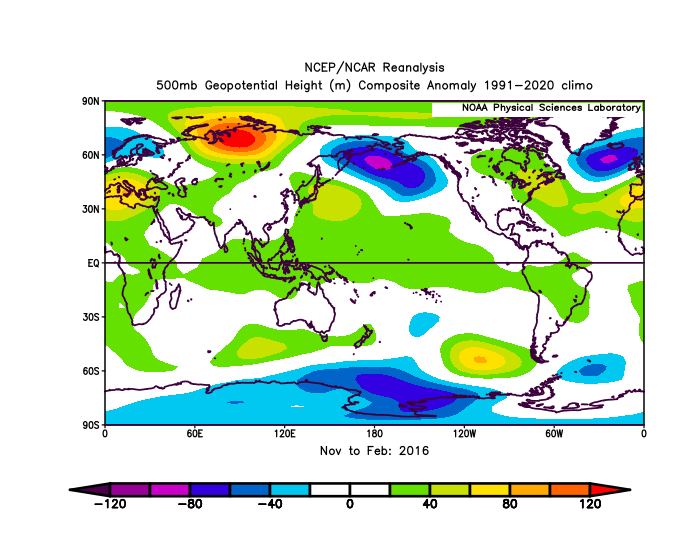
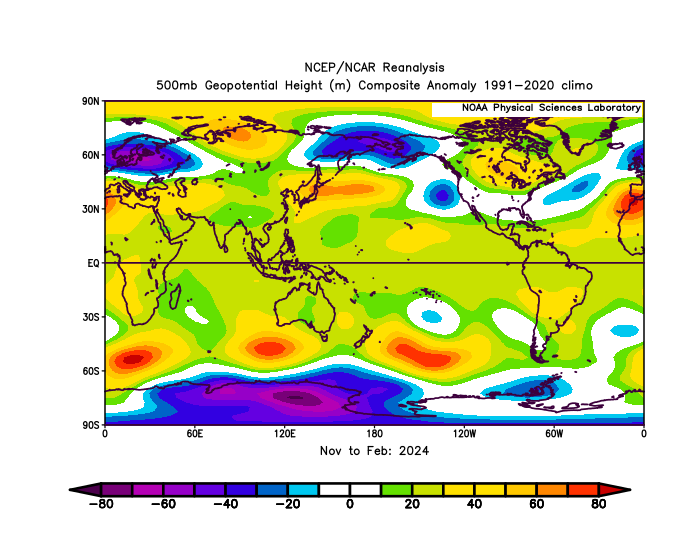
RONI peaked in 2015/16 NDJ of 2.38. ONI of ~2.6 RONI peaked in 1997/98 SON also at 2.38. ONI of ~2.4 https://www.cpc.ncep.noaa.gov/data/indices/RONI.ascii.txt Im personally still not on the RONI bandwagon as being a reasonable indicator of what will occur but to each their own. This type of atmospheric pattern in 2023/24 was closer to the strong/super Ninos even with the RONI showing barely strong status. I included 1972/73 as that was the last deeply -PDO/ +ENSO we experienced of course it is apples to oranges as nearly 50 years of oceanic warming have changed things up a bit.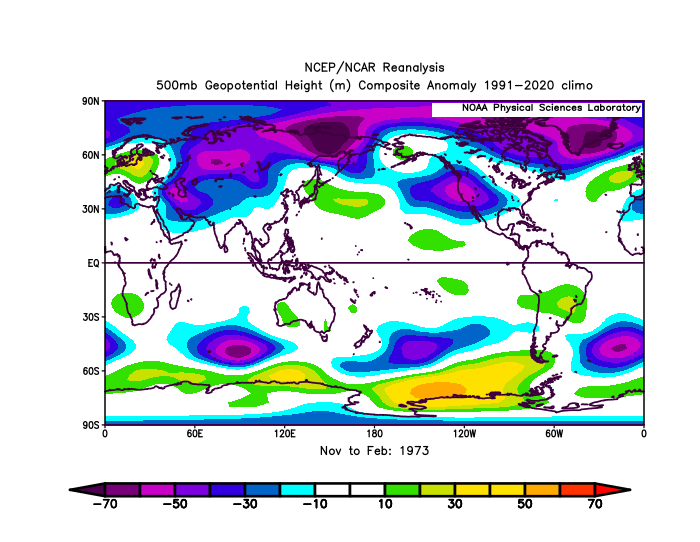
-
2025-2026 ENSO
so_whats_happening replied to 40/70 Benchmark's topic in Weather Forecasting and Discussion
We had a strong/super El Nino just 2 years ago and wasn't able to break it. So what you would be suggesting is a higher than 2015/16 scenario given the WPAC has still warmed during that time frame which would mean an ONI above ~2.6C probably closer to 3C consistently over several months to reset the system? Honestly I feel that is not reasonable if 2 El Nino, as strong as what we have seen one being nearly the strongest we have physically recorded, can not cool the WPAC having a stronger one won't change that fact. I feel we need to give it time to see how this all plays out and feel it is too early to draw conclusions on something to say permanence has set in. Im not trying to play a gotcha moment if it does in fact change up over the next few years to decade or stays exactly the same. Would rather let it play out and get better understandings versus making such claims one way or the other. It would be awfully weird to make these claims that things have changed for the worst and then we get another 5-10 year block of crushing snows again. -
2025-2026 ENSO
so_whats_happening replied to 40/70 Benchmark's topic in Weather Forecasting and Discussion
We would need to start seeing signs emerge if it was to tilt one way or the other more than just neutral. Nothing is catching my eye and overall as Bluewave has said it does look like things want to try to progress eastward in the tropics and switch things up a bit but the subsurface would not be super conducive to produce a weak or moderate El Nino right now if that were to actually start to show up. I think it is important to remember that La Nina is just a further enhanced state of what base state looks like as 40/70 has mentioned it is important on location of oceanic and even atmospheric features that dictate overall how things progress. We are pushing out from the spring barrier so we should start to see some signs emerge, what they are yet is anyone's guess. I gotta get to bed though I work tonight so ill be back on later. -
2025-2026 ENSO
so_whats_happening replied to 40/70 Benchmark's topic in Weather Forecasting and Discussion
We have seen this back and forth so much recently I am not confident this holds at all but for the mean time yes we are still having a La Nina atmosphere, even while weak to non existent SST profile, still holding the helm. Slow fade into Fall to neutral/warm status and maybe even a quick flare up of Nino like conditions atmospherically. No guarantee but the way things want to try and setup it seems this is possible. The biggest tell tale right now is the lack of WPAC typhoons should hit the record with no issue. Thoughts haven't changed in that aspect. There is no doubt though the warm pool has largely shifted now comes if it rebuilds in any meaningful way or we have another episode of end of summer/ fall push again. Yea I guess it will technically still register ENSO neutral but with a flare to Nino style is my current thought. We really may see the battle re establish again where we see a back and forth like last year. MJO is dead so it will be interesting if we follow a similar path as last year where a weak wave started moving again come end of June into July. -
Oh man that was close. Congrats @hudsonvalley21 As always thanks Roger!
-
2025-2026 ENSO
so_whats_happening replied to 40/70 Benchmark's topic in Weather Forecasting and Discussion
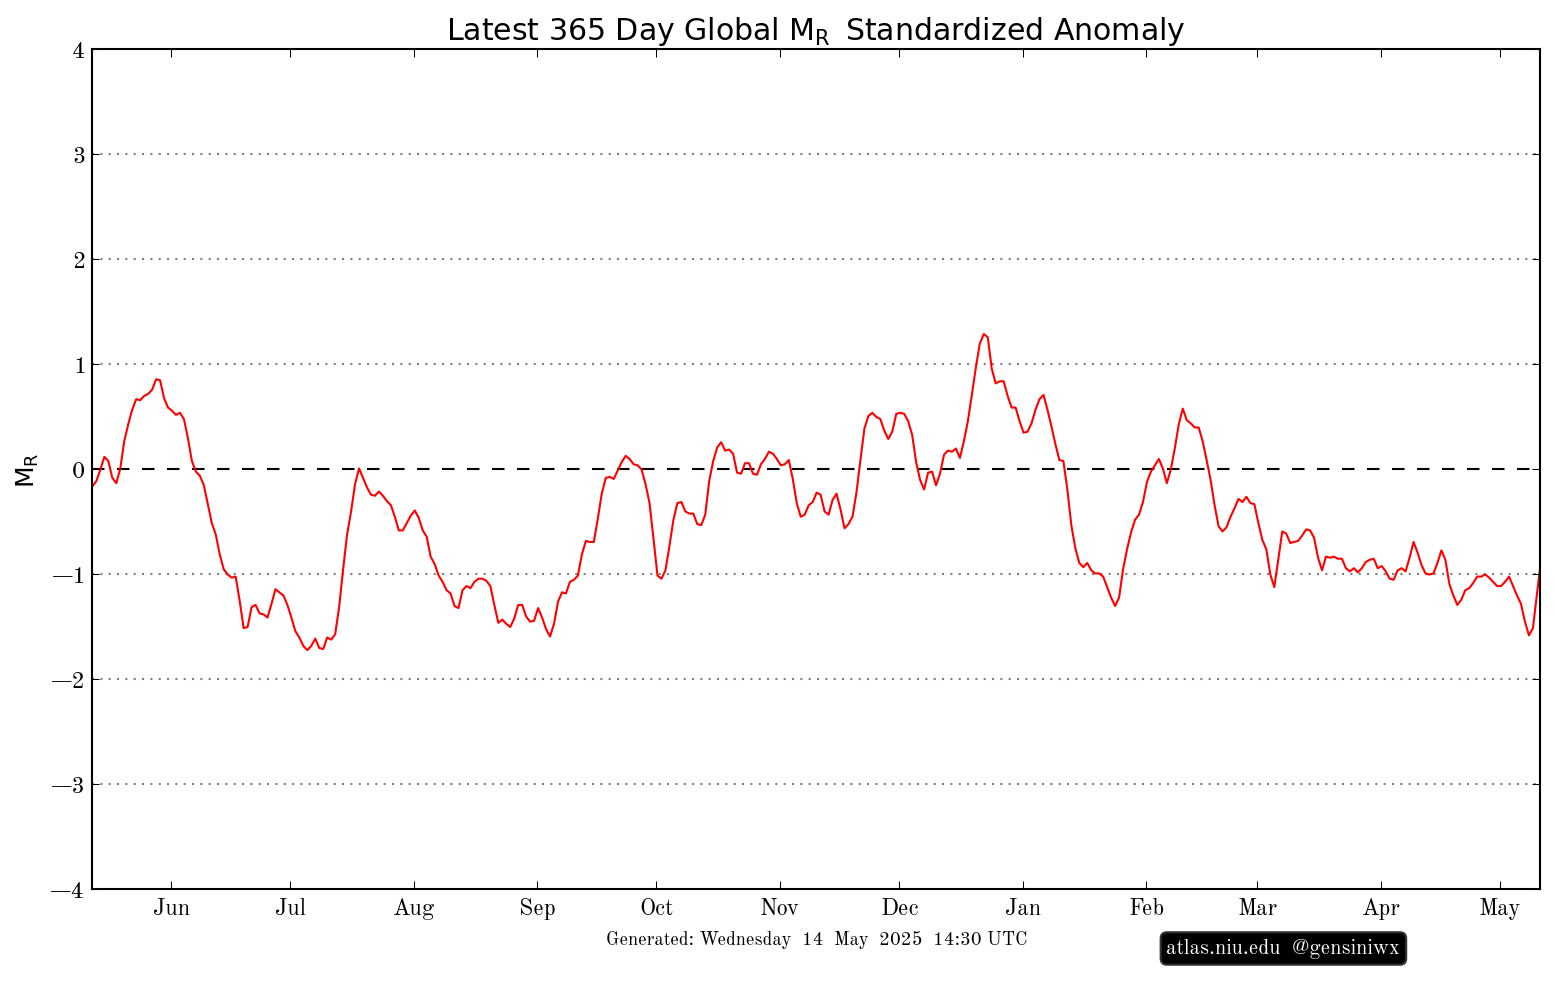
Anyway here is the last month and a half of TAO data showing the increase in OHC GAWX just showed. This should still maintain a Nina-like atmosphere through at least most of the summer would not be surprised if we start to see some flare ups of Nino-like progression into Fall just not enough to flip the script..thumb.gif.d4fe30e8eef26478d2ae8a13fb9118c3.gif)
-
2025-2026 ENSO
so_whats_happening replied to 40/70 Benchmark's topic in Weather Forecasting and Discussion
So we are just done talking about ENSO in an ENSO thread and this has now become a historical catalog for snowfall accuracy and debating climate? -
2025-2026 ENSO
so_whats_happening replied to 40/70 Benchmark's topic in Weather Forecasting and Discussion
Since this thread turned into a semi Climate thread warmer oceans and atmosphere allow for more water vapor leading to hefty rain events. Feast or famine seems to be the name of the game as of now with weather patterns. Just hope we have not turned on the faucet like we did in summer of 2018. -
2025-2026 ENSO
so_whats_happening replied to 40/70 Benchmark's topic in Weather Forecasting and Discussion
Only has been two ULLs one at the end of April to the first few days of May then we had about 2-3 days of clear weather, small system around last weekend (Friday/Sat) that zipped through and just this one the last about 3 days. It seems like it has been a lot longer but it really hasn't been extraordinary by any means. Again training and orographic lift played huge roles in this issue in western VA/ Eastern WV and Western MD unfortunate for sure but a reality of living near mountains. Again I hope we continue this rainfall we are still nearly 7-8" below average on the water year around here we should have better soil conditions to help with this next bout of rain come next week. Largely this weekend will not be as threatening as once looked a couple days ago too much west flow down here, maybe a little something from Central Pa into Southern NY early Friday into early Saturday. -
2025-2026 ENSO
so_whats_happening replied to 40/70 Benchmark's topic in Weather Forecasting and Discussion
That is not a very long time in a cutoff low situation. BTW for your snowfall thought you are talking about two completely different seasons with two completely different jet configurations. Rain in winter is usually in and out just as quick as snowfall. -
2025-2026 ENSO
so_whats_happening replied to 40/70 Benchmark's topic in Weather Forecasting and Discussion
Training is the name of the game with this one not sure I would call this a stuck pattern but to each their own. By definition what length of time do you consider a stuck pattern? Yes when you get 2-3" of rain within 24 hours anytime of the year it won't be a great situation let alone coming after such a long dry period the ground can not quickly revert to a sponge. -
2025-2026 ENSO
so_whats_happening replied to 40/70 Benchmark's topic in Weather Forecasting and Discussion
We have only had appreciable precip within the last maybe 3 weeks at this point. This will be the first month, at least in the BWI area, that we have seen near to above average precip in nearly 9 months. If it weren't for Debby last August we would have had almost a year and some months of below normal precip and we really didn't get a whole lot from Debby that was into the mountains (WV, VA) and Western PA. It is a bit late for us to be getting these ULL patterns but not unheard of. I would love to see us finally get back to at least average over the next couple months and hope that this is not just a fluke situation. -
2025-2026 ENSO
so_whats_happening replied to 40/70 Benchmark's topic in Weather Forecasting and Discussion
Yea big reason I feel we see a brief warm neutral state arise by winter time I do not believe the atmospheric state will have enough tipping to allow a Nino like atmosphere throughout but it could very well be a back forth scenario just as we experienced this year. Unless we start to see some pretty drastic reversals occur within the subsurface over the next two or so months. -AAM in full swing which would indicate at least atmospherically there should be a La Nina signal still well about. This will be important in the coming few months for the hurricane season. As others have mentioned, with a -AAM, we should still be seeing a pretty decent PV as we get into winter although it will be interesting to see what happens if we do indeed flip the QBO state by fall/winter. I would not expect record levels like we saw this past year. I do want to see how the pacific typhoon season sets up have yet to see a storm in the WPAC so we may very well see a record again for the latest system to form. The monsoon looks to be rather weak but starting up toward the end of the month across SE Asia. It looks like we continue with the cool tongue/ -PDO look from the Baja to the central Pac with brief bout of warming into Nino 1+2 and 3. Been awhile since I have looked but thoughts a modoki/ west based la Nina pattern trying to setup?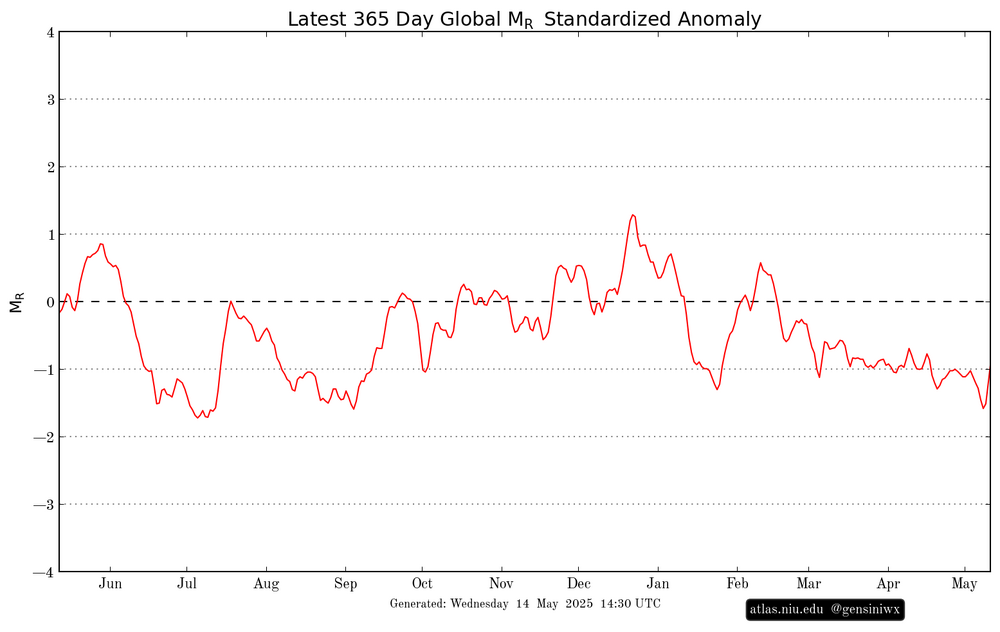
-
2025-2026 ENSO
so_whats_happening replied to 40/70 Benchmark's topic in Weather Forecasting and Discussion
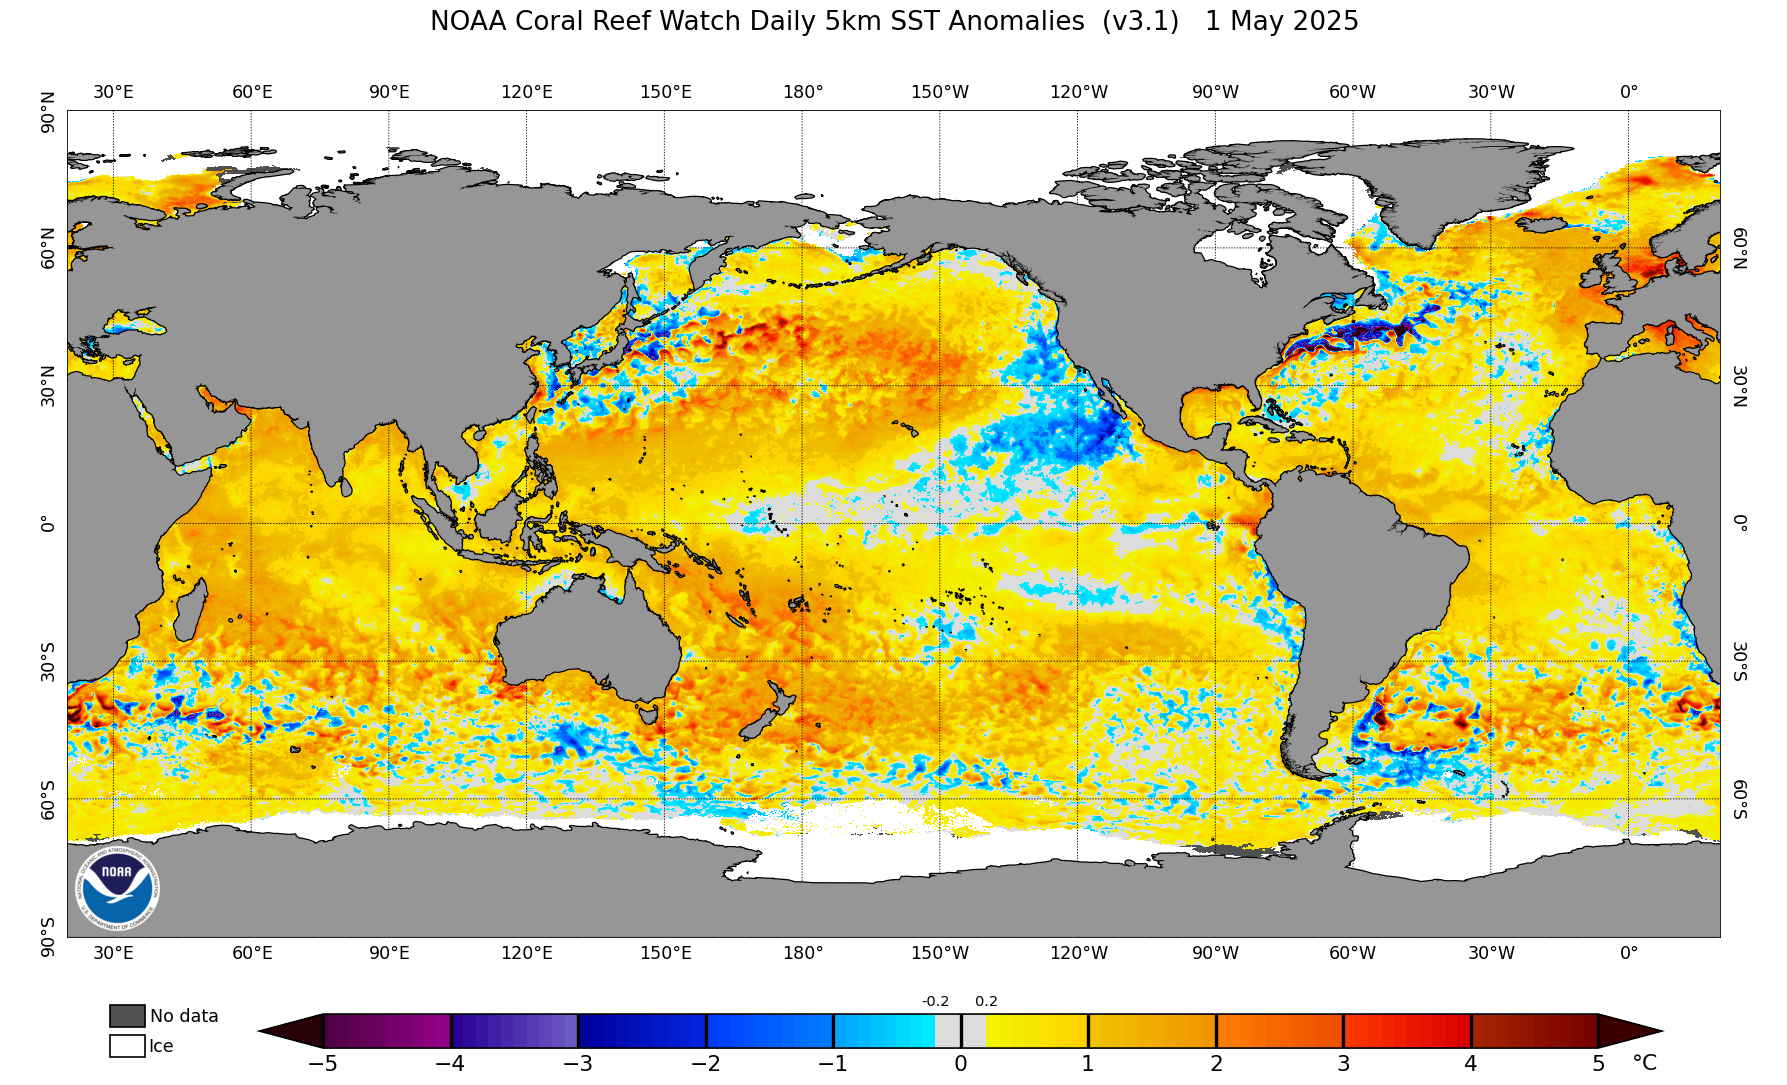
https://psl.noaa.gov/map/clim/sst.anom.anim.week.html Yea we are starting to see some impressive warming on the eastern portion of the warm tongue that has been ever present (due north of Hawaii and SW of the Aleutians). What is interesting to note is the shift of these warmer waters around Japan to areas further east. Many areas around mainland China, Koreas, and near Japan have actually held near average to just slightly above average, nothing like what we saw this time last year where many areas were about 2-4 above average widespread. Another region to also look at of recent is the cooling down of waters near the maritime continent, again not quite near average but not raging warmth like we have seen occur. The Baja has been interesting to watch hold through most of the late fall/winter time frame this area finally linked up with the -ENSO state so I would not expect it to be crushed so quickly. I do still think there is a chance at a warm neutral winter next year as we start to try and erode the equatorial subsurface over the next 6 months+, prospects of El Nino development should go up for 2026/27. I will be curious to see how the western Pacific Typhoon season goes. So far we have not seen a single storm form and we may start to run toward the record again. The idea I have been discussing has been a potential booming late season for the West Pac but probably still end up below normal.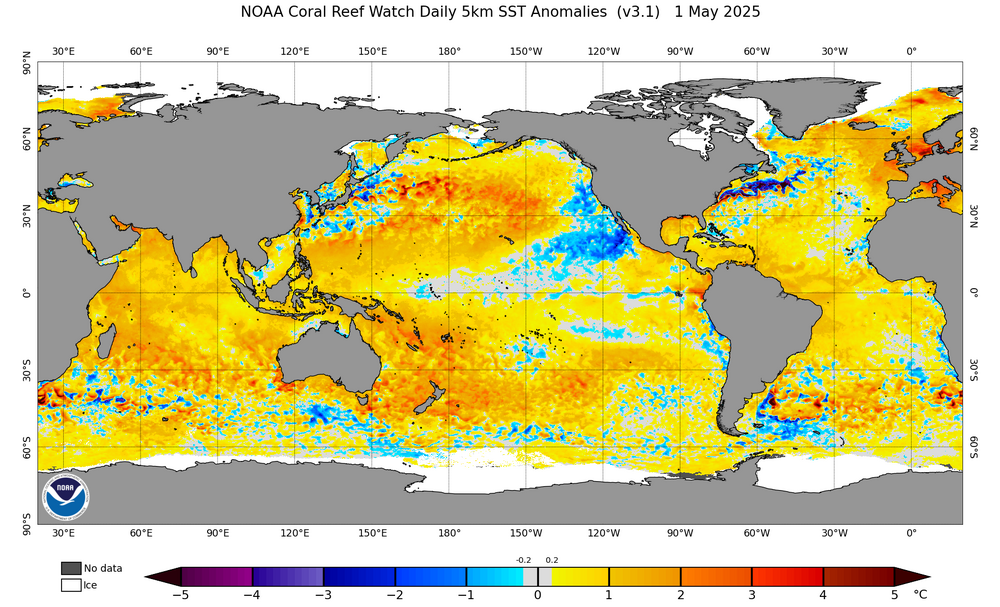
-
DCA _ NYC _ BOS __ ORD _ ATL _ IAH ___ DEN _ PHX _ SEA +1.4 +1.6 +1.7 +1.9 +.5 -.2 +1.5 +.3 +.5 Oh man almost forgot
-
2024-2025 La Nina
so_whats_happening replied to George001's topic in Weather Forecasting and Discussion
Latest subsurface look, lets see how things go from here..thumb.gif.5e777245b51533e229f4bbdebfbaa9de.gif)
-
2025-2026 ENSO
so_whats_happening replied to 40/70 Benchmark's topic in Weather Forecasting and Discussion
Funny I work at BWI currently as an observer so these comments have been fun to read. I was not there 15 years ago as I was in my first year of college but I do remember the crew who worked during that time. We do not actually report snowfall anymore (even though we still record it ourselves) since the place we do snowfall observations is on a roof and the board is right next to an HVAC system lol. They sent it down the EMS/ fire team which is about 1 mile away from us and closer to the bay which I feel has an influence on totals. Unfortunately there are many times we find inconsistencies with their report and ours so Sterling still calls us for snowfall records to match and get a better understanding. The way I use to measure snow when we did have it was split the board in half. On 1/2 the snow would be untouched showing the total depth of the storm then on the other half we would split that in half again( 2 quarters) the one would be the 6 hour total (00, 06, 12, and 18z) while the other half (or quarter) would be the hourly snowfall accumulation so we could get an idea for SNINCR within the remarks. End of day would be a depth and 24hr total new snowfall which would be done at 12z each day. Now that we do not by FAA standards do snowfall recordings we leave everything blank. -
2024-2025 La Nina
so_whats_happening replied to George001's topic in Weather Forecasting and Discussion
'It shows that the stratosphere is not an overpowering force that can be relied upon for anticipating surface weather tendencies 3+ weeks ahead.' I feel this is not the best take with this as sometimes it does actually overwhelm the troposphere and dictates what the setup looks like, it does not happen often as to expect it with every stratospheric warming event but it happens enough to be noticeable. There is still a lot to be learned about how the different layers interact with each other and will be interesting to learn as we go on, Don has pointed this out in several posts as well. My best take with everything stratosphere is typically it is started through patterns evolving within the troposphere that leads to these stratospheric disruptions, whether it is a split over a large wave 1 displacement that destroys the SPV is up to how everything evolves. We saw this year just like last year we had a fairly large wave 1 displacement leading to the weakening (this year being a total quick destruction) of the SPV. The pattern at 500mb then evolves over time to the familiar we usually associate with warm west/ cool east and that stratospheric warming can either enhance/ lock this pattern or let it play out and evolve to a relaxation period which typically allows for flattening out or a flip flop of cool west/ warm east. While we have been analyzing the balance between the 2 layers many have definitely noticed there have been on several occasions these 2 layers do not always move in tandem but when they lock in together in either direction they typically really lock in. Impressive chart this year to say the least this reversal was strong even for a wave 1 event from record setting levels at 60N to creating a record on the opposite end. u60n_50_2024_merra2.pdf -
2025-2026 ENSO
so_whats_happening replied to 40/70 Benchmark's topic in Weather Forecasting and Discussion
Highly localized area unfortunately. As of last month we are down about 3-3.5" on the year at BWI and if I include all of last year and so far this year we are sitting at about 10-11" below average which we have not seen in a very long time. I believe these numbers are even worse across SE PA, I know my area even after receiving about 1.5" of rain the other day 31st into the 1st we still have water restrictions across the area that were hoisted in November. Not very often we see something go into affect when it typically should start to be our wettest portion of the year. With this rain going on over the Ohio/Mississippi river valley region we should see some type of moisture inflow into this region but every model run closer to present we tend to get drier and drier. I think between now and Monday we should manage .5" to 1" of rain but I worry as getting to near normal is a step in the right direction but we are quickly approaching the time of year where we do not tend to see large synoptic style rain events. Stalled fronts and thunderstorms is the name of the game from about mid may onward and we all know this is hit or miss. All I can say is that it has not been terribly dry which is good but consistently not hitting the average mark for several months is a bit concerning especially going into summer. I feel the only way to get us close to average is through tropical systems, maybe this is our year. -
2025-2026 ENSO
so_whats_happening replied to 40/70 Benchmark's topic in Weather Forecasting and Discussion
No expert but I do enjoy watching things evolve in the Pacific. I would personally watch how the warm waters around and east of Japan set up. If we see a resurgence due to high pressure/ ridge dominance than we reset things. I would also watch to see how the WPAC typhoon season goes. It has been rather lackluster (not near average) for some time if there is an uptick this year changes certainly are afoot. In the EPAC I would watch around the Baja to see what happens with those waters as well. This semi -PDO setup is holding on and that may be a clue into fall and winter. -
DCA _ NYC _ BOS __ ORD _ ATL _ IAH ___ DEN _ PHX _ SEA +1.2 +1.1 +.8 +.9 +1.1 +1.2 +.8 +2.1 +.4 Sorry
-
2025-2026 ENSO
so_whats_happening replied to 40/70 Benchmark's topic in Weather Forecasting and Discussion
Fair point


.gif.afb8fc82838dad7742c3da096b410c0d.gif)
.gif.578e386dde5aae97931dca9a258fa39f.gif)