so_whats_happening
-
Posts
1,588 -
Joined
-
Last visited
Content Type
Profiles
Blogs
Forums
American Weather
Media Demo
Store
Gallery
Everything posted by so_whats_happening
-
2024-2025 La Nina
so_whats_happening replied to George001's topic in Weather Forecasting and Discussion
Latest subsurface look, lets see how things go from here..thumb.gif.5e777245b51533e229f4bbdebfbaa9de.gif)
-
2025-2026 ENSO
so_whats_happening replied to 40/70 Benchmark's topic in Weather Forecasting and Discussion
Funny I work at BWI currently as an observer so these comments have been fun to read. I was not there 15 years ago as I was in my first year of college but I do remember the crew who worked during that time. We do not actually report snowfall anymore (even though we still record it ourselves) since the place we do snowfall observations is on a roof and the board is right next to an HVAC system lol. They sent it down the EMS/ fire team which is about 1 mile away from us and closer to the bay which I feel has an influence on totals. Unfortunately there are many times we find inconsistencies with their report and ours so Sterling still calls us for snowfall records to match and get a better understanding. The way I use to measure snow when we did have it was split the board in half. On 1/2 the snow would be untouched showing the total depth of the storm then on the other half we would split that in half again( 2 quarters) the one would be the 6 hour total (00, 06, 12, and 18z) while the other half (or quarter) would be the hourly snowfall accumulation so we could get an idea for SNINCR within the remarks. End of day would be a depth and 24hr total new snowfall which would be done at 12z each day. Now that we do not by FAA standards do snowfall recordings we leave everything blank. -
2024-2025 La Nina
so_whats_happening replied to George001's topic in Weather Forecasting and Discussion
'It shows that the stratosphere is not an overpowering force that can be relied upon for anticipating surface weather tendencies 3+ weeks ahead.' I feel this is not the best take with this as sometimes it does actually overwhelm the troposphere and dictates what the setup looks like, it does not happen often as to expect it with every stratospheric warming event but it happens enough to be noticeable. There is still a lot to be learned about how the different layers interact with each other and will be interesting to learn as we go on, Don has pointed this out in several posts as well. My best take with everything stratosphere is typically it is started through patterns evolving within the troposphere that leads to these stratospheric disruptions, whether it is a split over a large wave 1 displacement that destroys the SPV is up to how everything evolves. We saw this year just like last year we had a fairly large wave 1 displacement leading to the weakening (this year being a total quick destruction) of the SPV. The pattern at 500mb then evolves over time to the familiar we usually associate with warm west/ cool east and that stratospheric warming can either enhance/ lock this pattern or let it play out and evolve to a relaxation period which typically allows for flattening out or a flip flop of cool west/ warm east. While we have been analyzing the balance between the 2 layers many have definitely noticed there have been on several occasions these 2 layers do not always move in tandem but when they lock in together in either direction they typically really lock in. Impressive chart this year to say the least this reversal was strong even for a wave 1 event from record setting levels at 60N to creating a record on the opposite end. u60n_50_2024_merra2.pdf -
2025-2026 ENSO
so_whats_happening replied to 40/70 Benchmark's topic in Weather Forecasting and Discussion
Highly localized area unfortunately. As of last month we are down about 3-3.5" on the year at BWI and if I include all of last year and so far this year we are sitting at about 10-11" below average which we have not seen in a very long time. I believe these numbers are even worse across SE PA, I know my area even after receiving about 1.5" of rain the other day 31st into the 1st we still have water restrictions across the area that were hoisted in November. Not very often we see something go into affect when it typically should start to be our wettest portion of the year. With this rain going on over the Ohio/Mississippi river valley region we should see some type of moisture inflow into this region but every model run closer to present we tend to get drier and drier. I think between now and Monday we should manage .5" to 1" of rain but I worry as getting to near normal is a step in the right direction but we are quickly approaching the time of year where we do not tend to see large synoptic style rain events. Stalled fronts and thunderstorms is the name of the game from about mid may onward and we all know this is hit or miss. All I can say is that it has not been terribly dry which is good but consistently not hitting the average mark for several months is a bit concerning especially going into summer. I feel the only way to get us close to average is through tropical systems, maybe this is our year. -
2025-2026 ENSO
so_whats_happening replied to 40/70 Benchmark's topic in Weather Forecasting and Discussion
No expert but I do enjoy watching things evolve in the Pacific. I would personally watch how the warm waters around and east of Japan set up. If we see a resurgence due to high pressure/ ridge dominance than we reset things. I would also watch to see how the WPAC typhoon season goes. It has been rather lackluster (not near average) for some time if there is an uptick this year changes certainly are afoot. In the EPAC I would watch around the Baja to see what happens with those waters as well. This semi -PDO setup is holding on and that may be a clue into fall and winter. -
DCA _ NYC _ BOS __ ORD _ ATL _ IAH ___ DEN _ PHX _ SEA +1.2 +1.1 +.8 +.9 +1.1 +1.2 +.8 +2.1 +.4 Sorry
-
2025-2026 ENSO
so_whats_happening replied to 40/70 Benchmark's topic in Weather Forecasting and Discussion
Fair point -
2025-2026 ENSO
so_whats_happening replied to 40/70 Benchmark's topic in Weather Forecasting and Discussion
Yea again it just boggles my mind that folks expect an analog year(s) to literally follow to a 'T' month to month, when reality shows it is extremely difficult to have a repeat season even with similar variables that take place. A great example was this past hurricane season even with a dwindling El Nino state and a rather unforgiving upper air pattern over the Atlantic for much of the season we still had average to slightly above average numbers in several categories. In times we had large scale suppression we still managed storm formation and then times with what looked like perfect conditions for storm formation it was quiet as can be. Just goes to show we do not quite understand every aspect of weather and that is a wonderful thing because it helps to innovate to a better understanding of these processes in the future through further research. I don't ever want to be in the 90-100% accuracy range personally as then weather starts to become boring in my view when predictability is damn near perfect. I do appreciate the effort though of people wanting to put out long range forecasts but nothing is ever concrete and I hope we can go further into discussion without too much negativity to help the science. Anyway yea as for winter a better Pacific does look to be trying to setup Im still unsure about the Atlantic because as we have seen in the past it can flip rather quickly in state. It will be important to watch the severe weather season this year and how things setup going into late spring/early Summer. As for ENSO im in the same department essentially neutral to warm neutral I don't think we touch weak Nino status though. -
2025-2026 ENSO
so_whats_happening replied to 40/70 Benchmark's topic in Weather Forecasting and Discussion
Again you can not expect every single season to mimic exactly how a previous season went but there were some really strong similarities to how this season progressed like it did back in 2013/14. The huge drop in the -PDO, rather consistent -EPO pattern, the arctic air intrusions that led to impactful snow in the deep south, +QBO, and high solar just to name a few. I don't remember anyone predicting record snowfall and cold like we saw that year but a very similar setup still occurred, unfortunately I think we are in quite the drought situation in the east and have been for the last year and half. We even discussed this before snowfall/precipitation in general varies way too wildly from season to season to even have consistencies to predict the reality of what could occur, this season behaved very much like 2013/14 in a warmer base state even from the already warm base state we saw back then. Sucks snowfall did not work out but many areas in the mid atlantic and even SNE have been in drought like conditions for quite some time there is something bigger not allowing us to flip to a wetter pattern. Maybe the PDO was in such an intense negative state that it sent a shock into the system that we have yet to snap out of? Would love to know myself. I think the bolded we need to realize that not every season will follow a path of snow and cold if we have a -EPO/ west ridge/ -NAO it leads us to a better chance of a snowier colder pattern but never guarantees one and I believe this is just another example in that book. I believe Raindance and even myself have mentioned it but we seemed off by a month this whole season especially going from end of summer into early winter. Comparing Oct 2024 to Sept 2013 yields very similar conditions occurred with moving a month forward until about we got to about January that is when things started to diverge between the two seasons. I think with us not totally flipping the PDO state hurt the continuation of us following a 2013/14 style season but going from a -3.8 PDO to about a -1 to -1.4 range still yielded a fairly similar drop which started to setup the pattern we just couldn't keep it going so we yielded a different setup given a fairly similar background change. Our cold tends to come from a -EPO not a -NAO pattern, a -NAO pattern can help lock in a pattern but we can have a -NAO and not actually get cold to infiltrate the region. Again not 1:1 and no season will ever fit perfectly (I would be impressed if something like that actually occurs) big reason why many folks use multiple seasons to help bring in different elements that could occur. I also would not expect us to go into a 14/15 style season going forward. -
2025-2026 ENSO
so_whats_happening replied to 40/70 Benchmark's topic in Weather Forecasting and Discussion
I hate to toot horns but bluewave does have a point with this Pac jet setup and those waters in the Pac mid latitudes are still playing games with the overall pattern progression. That is why im thinking the ocean tries to push a Nino but fails to actually connect and fully setup. Feel '26-'27 stands a better chance of Nino popping up, have to wait until we get through the spring barrier to see how things shape up because this shakes up severe weather season and eventually hurricane season. I don't expect a 14-15 season going forward although it would be very interesting to see happen lol
-
2025-2026 ENSO
so_whats_happening replied to 40/70 Benchmark's topic in Weather Forecasting and Discussion
For sure again not everything is 1:1 in similarity but is interesting to see why the differences are occurring though. First third of the month has been strikingly similar in the 500mb setup, not to say it continues. You can start to see where the differences are with much more established +PDO pattern in 2014 we also were not fighting hard right now to quell a Nino like pattern through the EPAC trying to setup with flairs of Nina still around. The cold neutral in 13-14 didn't quickly erode through the east pac like we are seeing this year.
-
2025-2026 ENSO
so_whats_happening replied to 40/70 Benchmark's topic in Weather Forecasting and Discussion
It was really amazing to see the constant nay saying of a 2013-14 style repeat even when the signs of it really started to show at the end of summer into fall. As always there is never a 1:1 situation just wish folks would look at the broader sense of what is going on sometimes. -
2024-2025 La Nina
so_whats_happening replied to George001's topic in Weather Forecasting and Discussion
Yes we would have a late bloomer of sorts if they did connect at some point but the strength is very apparent and would only look to sustain at best a touch to moderate but most likely weak scenario, again if that were to occur. This though could set us up for an event around 2026/27 winter again a lot up in the air right now. Should have a better idea into April when things start to settle down. -
2024-2025 La Nina
so_whats_happening replied to George001's topic in Weather Forecasting and Discussion
Impressive! I unfortunately have not had a lot of time to look at the strat recently. I still don't know how we can claim that this was the first decent stratospheric warming event this season. Of course the middle to end of January one was impactful but we have not had a pattern sustain this winter and since no reversal occurred of course the SPV was able to maintain with the benefitting factor of a WQBO still very prevalent. There was some brief connection over the Alaska/ NW Canada region for a bit this year again sustainability was the issue. I don't know how anyone could make the claim a near record fast/strong SPV could suddenly disintegrate like that and have a near 90m/s+ drop that is unheard of. I'm sure at some point in the past it may have happened but not within our records. It is typically common to have a solid attack weaken the structure and then have a second attack that finishes it. The thing is there is not always a second attack so that was always the question at hand. Maybe it was the faster pac jet that was able to cause the pattern to not be able to sustain this year? Will be interesting to look at over the summer. -
2024-2025 La Nina
so_whats_happening replied to George001's topic in Weather Forecasting and Discussion
This will be very interesting to see what happens. Subsurface would suggest as of now a potential rejected EL nino but that does not mean it doesn't try to spread some warmer regions rather than cool neutral. It does look to be building though and there is a possibility if we do get some sort of decent WWB event it could trigger a weak Nino.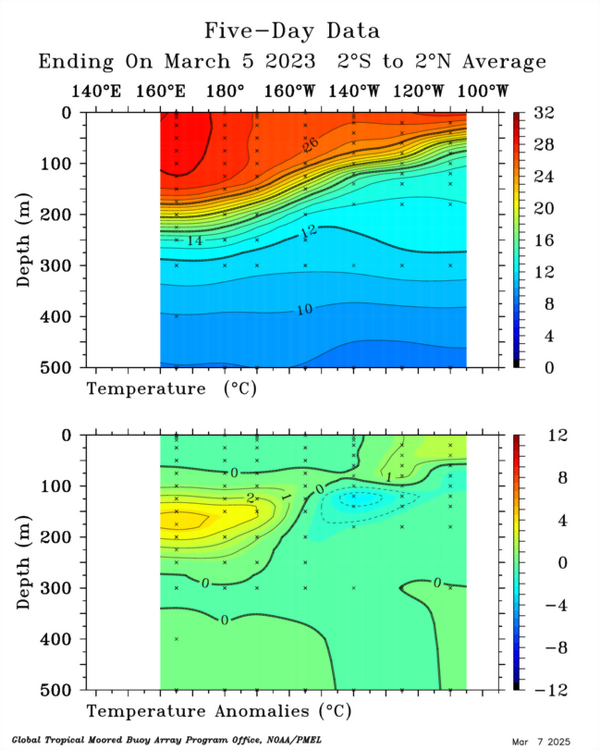
-
2024-2025 La Nina
so_whats_happening replied to George001's topic in Weather Forecasting and Discussion
Early guess but I would expect a warm neutral ENSO next year. Im not currently seeing signs the La Nina atmospheric pattern just dissolves even if the Ocean temps don't quite resemble a weak Nina in time. It is however really impressive to see the westerly anomalies in such scope and intensity for this time of year around 1+2/ eastern 3. I think when we cross the spring barrier we should slowly continue to wane the Nina like presence into summer then by early fall having neutral stance in all regions. I do think Nino 1+2 is a bit of an eye opener but nothing looks to sustain that warmth at present. Here is the subsurface look for the past 2 months. We are not really dislodging that cold pool in the subsurface and the warm pool in the WPAC is not gaining much steam just yet I know the time stamps between the two images is not perfect 1 to 1 but you can see differences in the setup in this potential ENSO for Summer into Winter. This alone would make me think we see a decent Nino event for '26-27.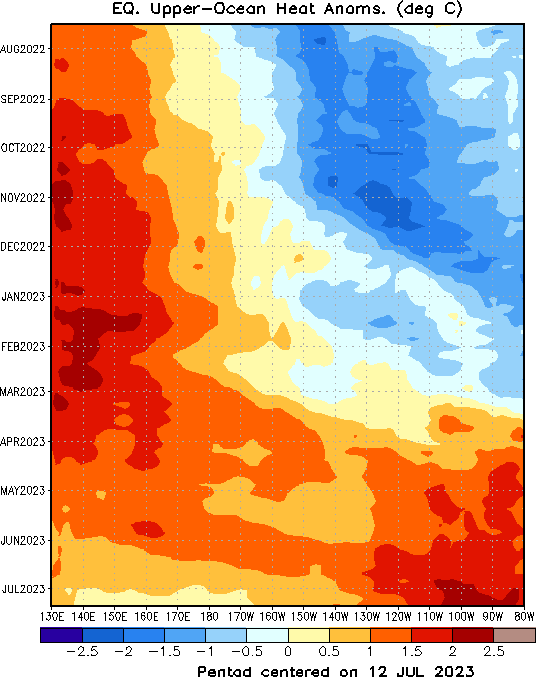
.thumb.gif.a4629a1ebac9e073ab33ad1c9a4095d3.gif)
-
DCA _ NYC _ BOS __ ORD _ ATL _ IAH __ DEN _ PHX _ SEA +4.5 +3.9 +2.2 +4.8 +4.2 +4.1 -.5 -2.8 -1.6
-
2024-2025 La Nina
so_whats_happening replied to George001's topic in Weather Forecasting and Discussion
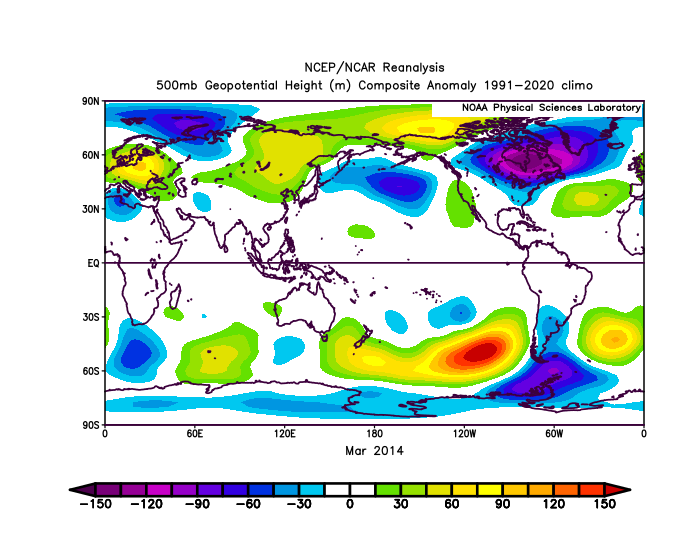
Impressive changes in the PDO state over the last 3 months of SSTA. Here was the associated 500mb pattern during this time, certainly was not expecting a look like this. It is interesting to watch the PDO state try to change still unsure myself what exactly kicked off this chain reaction from constant ridging in the WPAC. In my opinion there still seems to be a disconnect between tropics and mid latitude that we would have such a strong -PDO during the Nino last year (strong/super) and to have not quite flipped but weakened significantly the -PDO with a Nina state. I still don't think we see a tri monthly below -.5 and this Nina may just get one blue numbering for trimonthly (NDJ), even I thought around -1.0 was possible this go around. Lastly, it is interesting seeing the 500mb pattern across the Pacific with the more latitudinal shift just NW of Hawaii, I believe bluewave has touched on this several times. The waters across the Pacific must have just been far too warm a lot of it seemingly just shoved further east and south. It will be interesting to see if there are lagging effects of the Nina across the Atlantic this summer for the hurricane season.
-
2024-2025 La Nina
so_whats_happening replied to George001's topic in Weather Forecasting and Discussion
Yea I went too warm for Boston in the February forecast, bummer. Also impressed by the overall snow amounts so far this year in the mid atlantic was expecting better than the last few years but being at average to possibly quickly going to above average is nice to see. Glad an overall wetter pattern whether it be rain or snow is taking place, still in a severe drought so any bit helps. -
2024-2025 La Nina
so_whats_happening replied to George001's topic in Weather Forecasting and Discussion
Didnt they just have a similar event like this 2 years ago? -
2024-2025 La Nina
so_whats_happening replied to George001's topic in Weather Forecasting and Discussion
Lol so if a snowstorm is shown at hour 240 that makes it a reality? This notion that because a model shows in this case a split is to be believed that far out (well over 240hrs) is wild. If you bought into that is on you, people really need to start thinking for themselves honestly and stop listening to folks on social media you only lead yourself down a path of nonsense with that. Edit: To add onto this I don't think there was a single person that mentioned a split would occur just that a stratospheric warming would occur. If there was quote em. -
2024-2025 La Nina
so_whats_happening replied to George001's topic in Weather Forecasting and Discussion
Sorry for the late response I will have to take a look at the paper when I get a free chance then. -
2024-2025 La Nina
so_whats_happening replied to George001's topic in Weather Forecasting and Discussion
I still do not understand why everyone is so hellbent on this being a SPV split or not. -
2024-2025 La Nina
so_whats_happening replied to George001's topic in Weather Forecasting and Discussion
My god im sorry I even posted that there would be warming event in the strat. The twitter campaign out in full force cant even have a sensible discussion anymore. -
DCA _ NYC _ BOS __ ORD _ ATL _ IAH __ DEN _ PHX _ SEA +2.8 +2.6 +2.4 +2.9 +4.2 +4.8 +1.1 +1.7 -3.2 Whoops my bad
.gif.578e386dde5aae97931dca9a258fa39f.gif)


.gif.b27d04124c2fab3735192c1f524b694a.gif)