so_whats_happening
-
Posts
1,579 -
Joined
-
Last visited
Content Type
Profiles
Blogs
Forums
American Weather
Media Demo
Store
Gallery
Everything posted by so_whats_happening
-
2026-2027 Super El Nino
so_whats_happening replied to Stormchaserchuck1's topic in Weather Forecasting and Discussion
The strength of the of westerlies will fluctuate over the next week but it is more so the actual motion and presence that are the more important factors, showing things have at least started to change. As of now it looks like the MJO and the westerlies are not in tandem, MJO seems to be front running but if MJO slows or westerlies speed up they will be much more connected which could mean we have finally reached the point where things really start to get going with the Nino event. Time will tell -
2026-2027 Super El Nino
so_whats_happening replied to Stormchaserchuck1's topic in Weather Forecasting and Discussion
Here is the February to March 19th (every about 5 days) TAO look. We will be having the WWB take place over 130-140E and progress E. You can see what the last one was able to do back in mid February. Very slow rotation going on but could be one heck of a WWB if this holds. Be mindful the zonal wind anomalies shown are not always what reality equates to but more so movement is the key strength will vary along the way..thumb.gif.86c0123df9efc29a4edbaad587c816a9.gif)

-
2026-2027 Super El Nino
so_whats_happening replied to Stormchaserchuck1's topic in Weather Forecasting and Discussion
We shall see I do wonder that with this being so far north in comparison to the past few super El Nino events, this seems to have a bullseye around roughly 5N. Will we follow similar paths to those events or create a new way we have yet to see (something similar to what Stormchaserchuck showed in earlier pages) and would we actually remove the heat basin? In comparison to the last 4 super Nino events in ~50 years.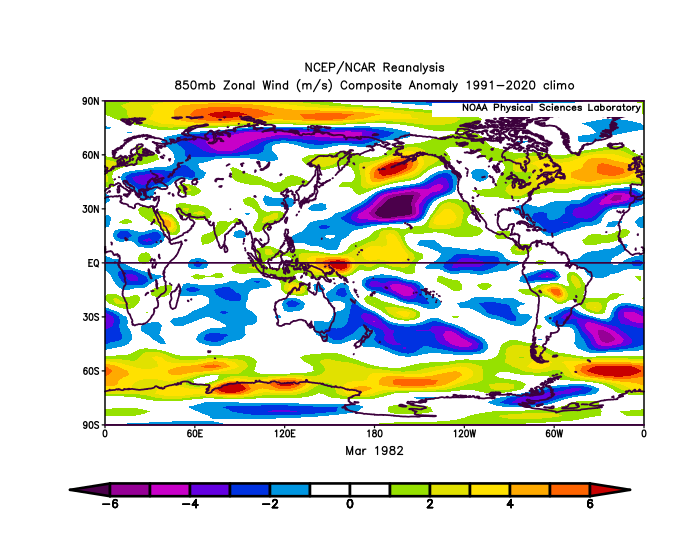
-
2026-2027 Super El Nino
so_whats_happening replied to Stormchaserchuck1's topic in Weather Forecasting and Discussion
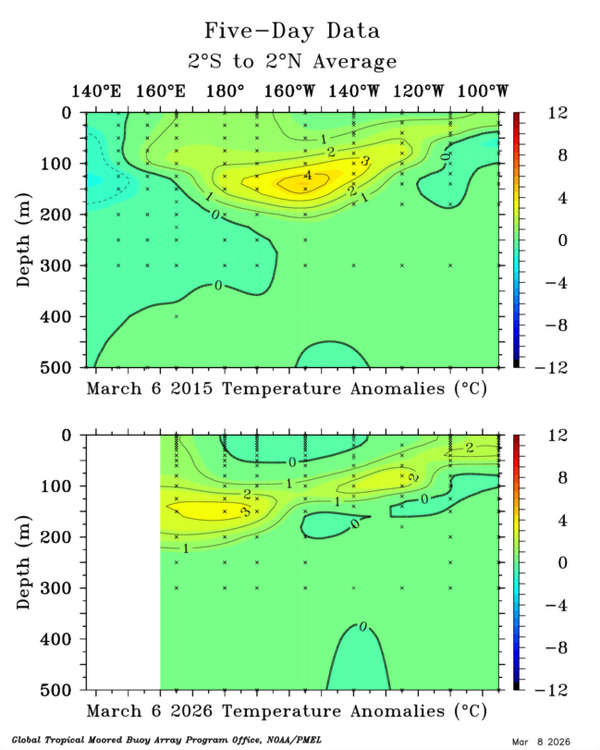
Ill wait of course until we actually start to see things evolve the next few weeks but I think I remember Bluewave mentioning awhile back about what would be the threshold needed to overcome such a dipole of west to east Pac. We saw ONI from 2015 reach 3C in the intra timeframes overall 2.8 trimonthly and we were still left with a healthy WPAC warm pool. -
2026-2027 Super El Nino
so_whats_happening replied to Stormchaserchuck1's topic in Weather Forecasting and Discussion
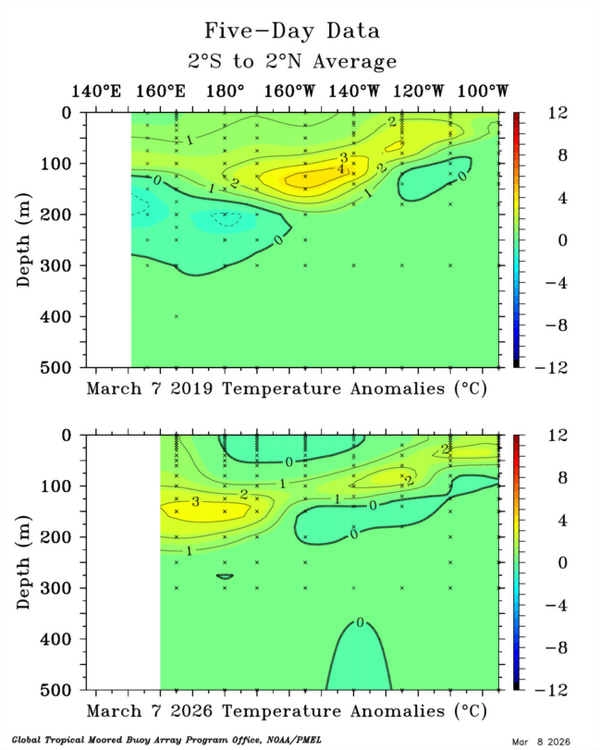
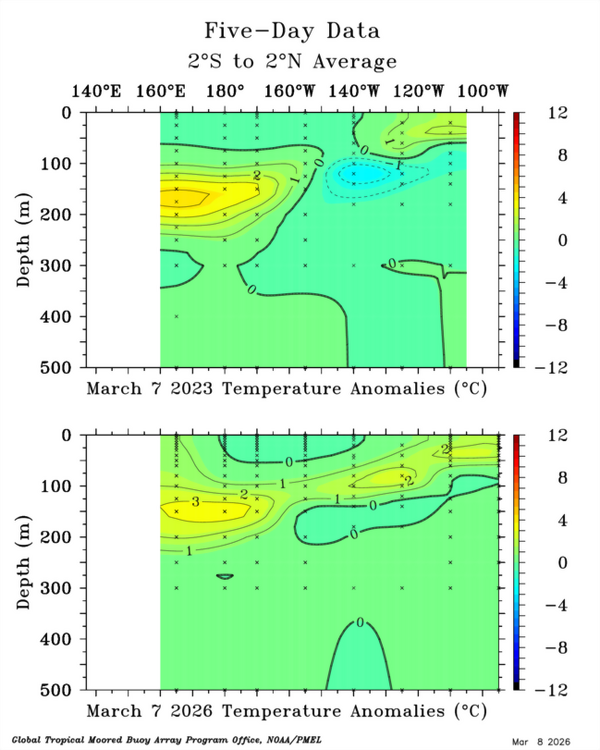
We have not been able to flush out the WPAC warmth which at some point has to be redistributed. The last couple El Nino events have not had intense WWB events and this potentially has the chance to uproot at least a good portion of that warmth. This certainly will be interesting to watch going forward. I know we have had many discussions on here about stuck patterns/ new norms but eventually they do break down, I do wonder what such an event would cause. Time to watch and learn. Here is 2015 and well 2023 virtually was non existent for a wind anomaly in both March and April. I do wonder with it being so far north what this could mean. We did not reset the Pacific pattern like we saw with the large push in 1997/98 take a look at subsurface and surface anomalies for an example. So maybe in order to tame/remove this heat engine that has been persistent we start to push the bounds of what we have known. To add the breadth and overall strength of such an event is important as placement.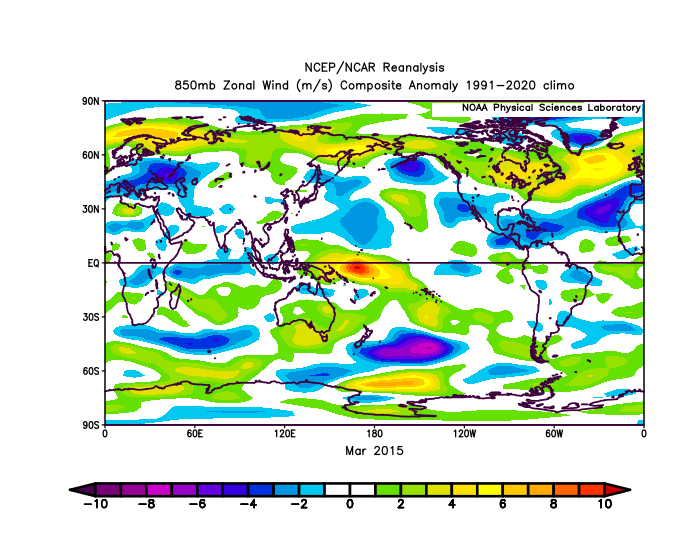
-
2026-2027 Super El Nino
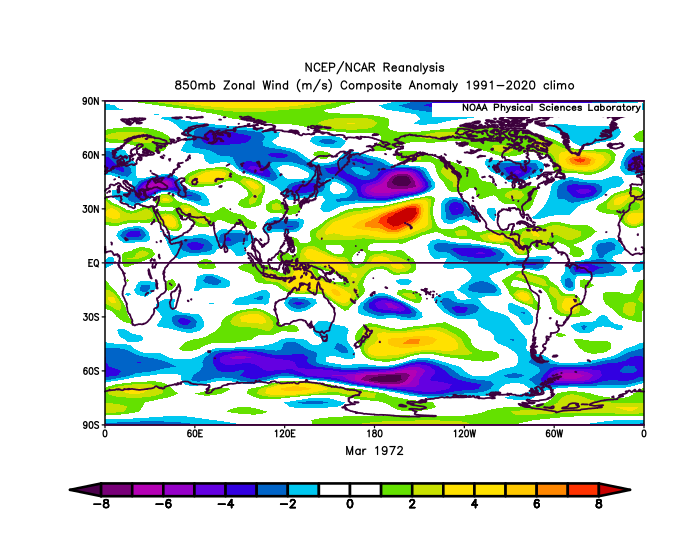
so_whats_happening replied to Stormchaserchuck1's topic in Weather Forecasting and Discussion
I see the potential but I just can't shake that this doesn't quite get to those levels. Now that things are starting to shine some light on the potential of at least an El Nino im happy to take my weak stance to a moderate level coming up here for the summer and fall with a chance to strong. Super is a stretch for now but also have to see how things progress past the spring barrier. I know I have shared this countless times in comparison and of course not all Nino's will form the same way but I can't help but notice that this setup is different in approach than the 23-24 season with westerly anomalies not as strong in the eastern Pac. I think this has role in maybe limiting the potential of how strong it can get and potentially placement as well but again plenty of time to watch things unfold. I only have what I have saved so forgive me when they dont show a similar time period. Also notice the lack of a full rotation like we saw in the 2023 example (upper image), maybe this is still to come?

-
Sorry to tag but felt it was needed for everyone to know in here. @Rjay @donsutherland1 @bkviking @MJO812 @RodneyS @Stormchaserchuck1 @Tom @wxallannj @Scotty Lightning @dmillz25 @hudsonvalley21
-
Oh no such a shame to hear may he rest in peace.
-
2026-2027 Super El Nino
so_whats_happening replied to Stormchaserchuck1's topic in Weather Forecasting and Discussion
If this were to actually hold we would see quite the KW form and would significantly raise the chances of at least a moderate to strong Nino.
-
2026-2027 Super El Nino
so_whats_happening replied to Stormchaserchuck1's topic in Weather Forecasting and Discussion
Here are just some comparisons to this year so far, use the info as you will.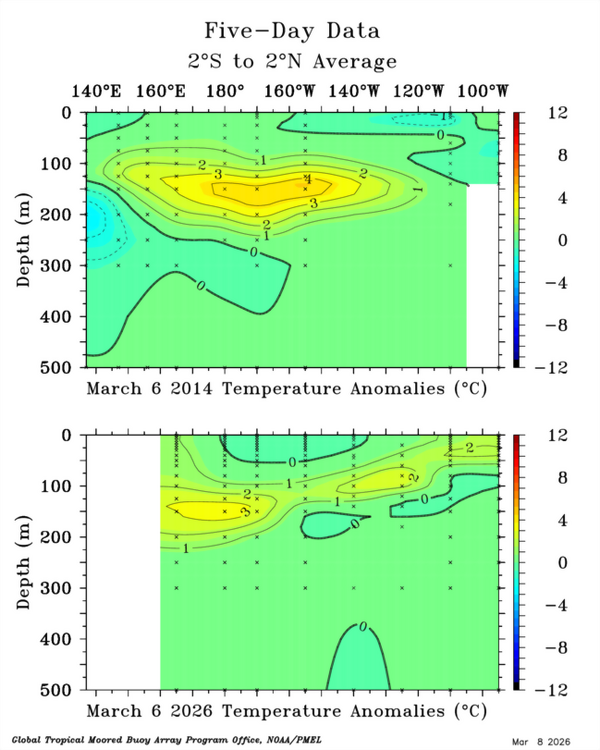
-
2025-2026 ENSO
so_whats_happening replied to 40/70 Benchmark's topic in Weather Forecasting and Discussion
Im not sure I understand what he is trying to say here in the bold. -
2026-2027 Super El Nino
so_whats_happening replied to Stormchaserchuck1's topic in Weather Forecasting and Discussion
We are starting to see the Indian ocean set up with respect to wind anomalies the El Nino like response. The kicker so far has been the lack of westerlies getting too far east and the still (weak overall) enhanced easterlies across Nino 1+2. 2023 featured a fairly broad area of westerly anomalies across 1+2 and eastern 3 around this time so it makes me think this may end up being more Central Pac oriented versus East Pac but plenty of time to discuss. I do wonder how we impact the hurricane season coming up with atmospherically we seem to be taking our time transitioning out of the Nina like state.
-
2026-2027 Super El Nino
so_whats_happening replied to Stormchaserchuck1's topic in Weather Forecasting and Discussion
For reference this was the hovmollers 850mb u wind anomaly look leading into the 23-24 Nino event. If we do indeed get the westerlies over that warm pool around the dateline we should start to push the ocean to Warm neutral territory. Ill wait to see if the AAM does want to switch things up going forward strength of the event is still in question but it should be safe to say we get to at least warm if not weak Nino status by summer. I would like to see some actual propagation of the anomalies and not have them just sit west of the dateline like we have seen the last 2 months.
-
DCA _ NYC _ BOS _ ORD _ ATL _ IAH _ DEN _ PHX _ SEA 4.2 3.9 2.9 3.8 3.4 3.8 4 2.7 .8
-
2025-2026 ENSO
so_whats_happening replied to 40/70 Benchmark's topic in Weather Forecasting and Discussion
There does seem to be some surface connection trying to show up in the longer range when this does occur so I would not be surprised to get a blocky colder pattern as we head to mid month. Ill enjoy the warmth ahead of it though!.thumb.gif.4c1f8572f825f53271d7787e2edf263e.gif)
-
2025-2026 ENSO
so_whats_happening replied to 40/70 Benchmark's topic in Weather Forecasting and Discussion
I guess it will finally 'split' coming up here, I feel a little too late anyway for any big fun but whatever Many have gotten solid snows this year. As far as a final warming it does not completely obliterate the SPV coming up here so technically it is still intact in some way. When you start to lose the idea of any cohesiveness of the SPV then it is considered done which does not look like it through at least mid March. Typically the final warming happens from the last week of March through 3rd week of April but as we know can happen before or after that timeframe. Sorry been on vacation starting to bring things back to normal for the work week coming up. Edit: Wanted to add this because this does show the overall structure does split besides one random layer. So this should hit the troposphere rather quick. https://www.stratobserve.com/fcst_ell_vert
-
2026-2027 Super El Nino
so_whats_happening replied to Stormchaserchuck1's topic in Weather Forecasting and Discussion
From the other thread since I did not realize this was created..thumb.gif.34347a07a6bd9a177fb60eefe8c7bd72.gif)
-
2026-2027 Super El Nino
so_whats_happening replied to Stormchaserchuck1's topic in Weather Forecasting and Discussion
I would love to see at depth how much warm water is there now (throughout the PDO region off Japan), I think Bluewave posted about it awhile back. Im not so certain of an El Nino atmospherically we are not making a change up even with oceanic trying to make moves. -
2025-2026 ENSO
so_whats_happening replied to 40/70 Benchmark's topic in Weather Forecasting and Discussion
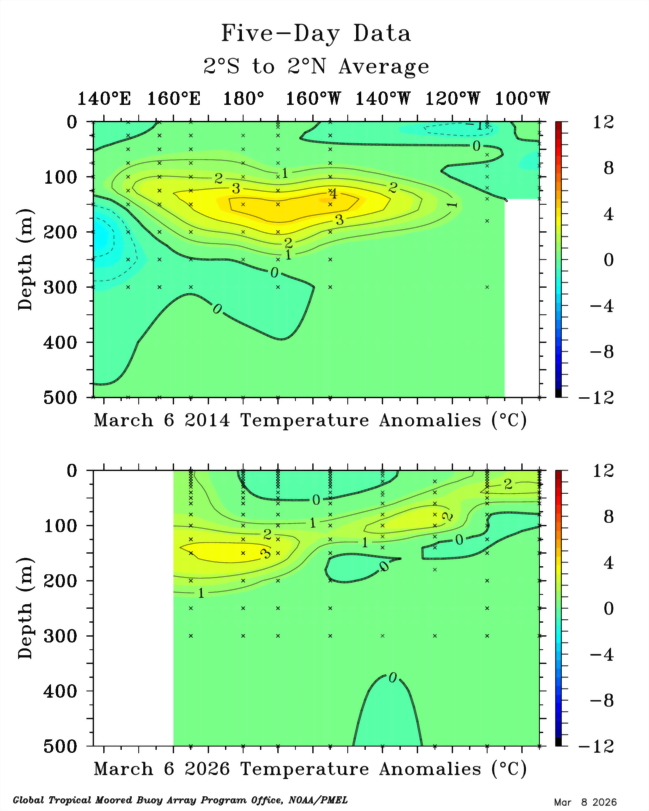
I may just say uncle if this storm Sunday does anywhere close to what some models are projecting... Anyways here is that last few weeks of TAO subsurface some interesting motions taking place. Rather than this reconfiguring the subsurface this just looks like a 'burp' of warmer waters for now as we head into spring and summer. Oceanic and atmospheric things are not aligned and look to be even further apart from each other over the next few weeks to months..thumb.gif.5ae8f321c9234ce543235522bacbfb57.gif)
-
2025-2026 ENSO
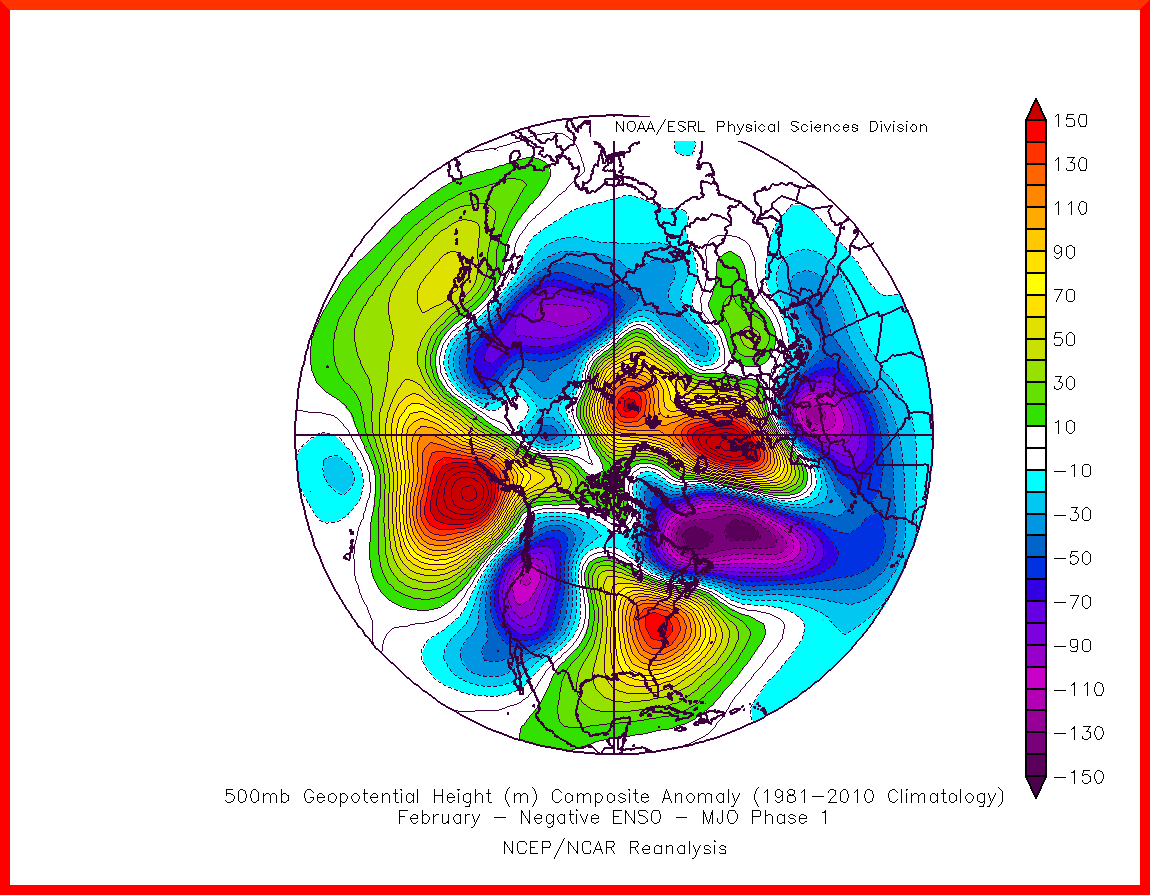
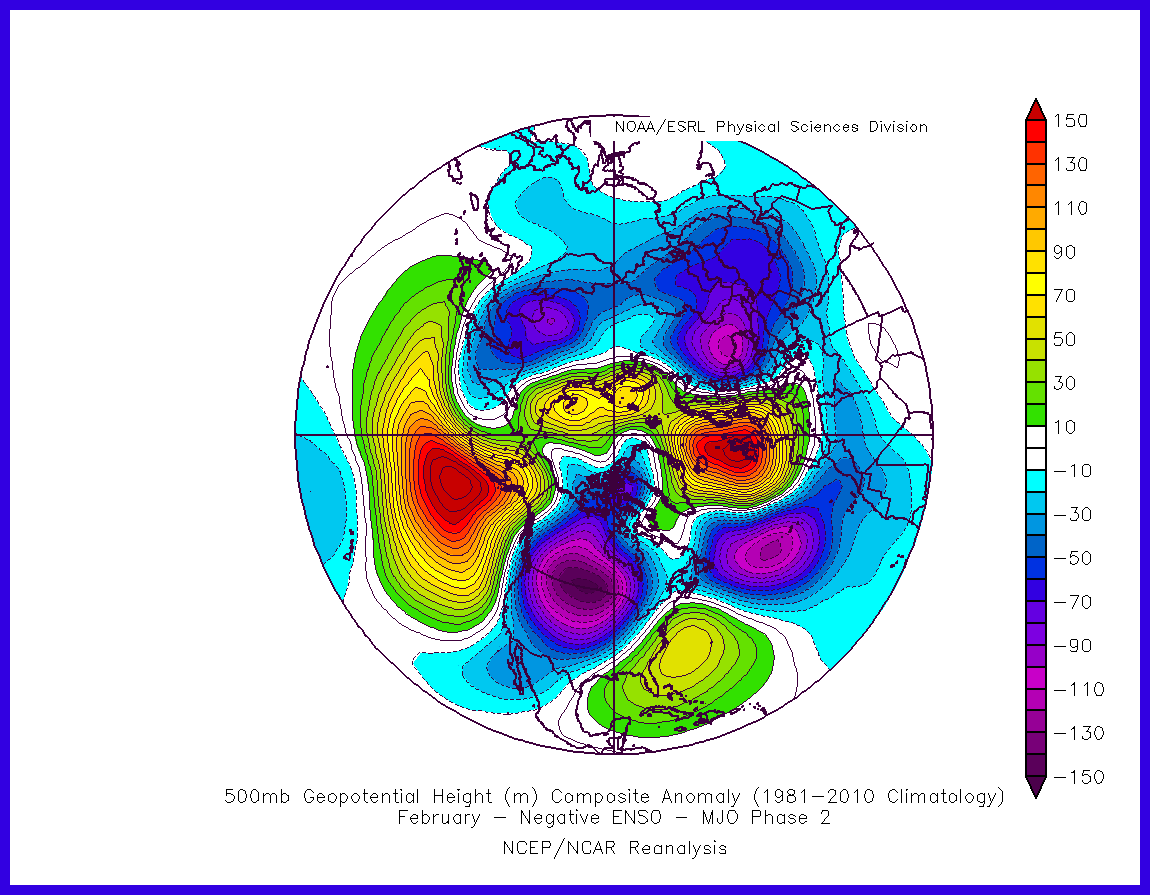
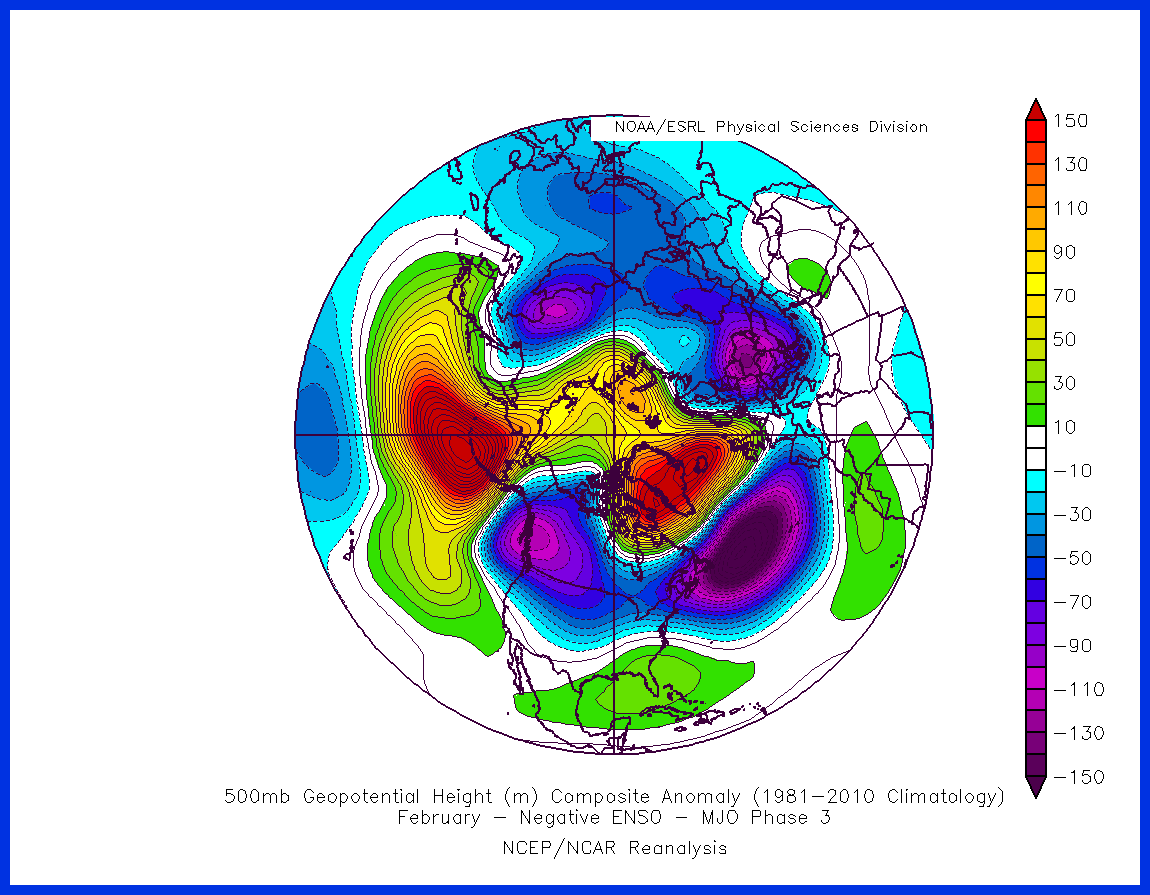
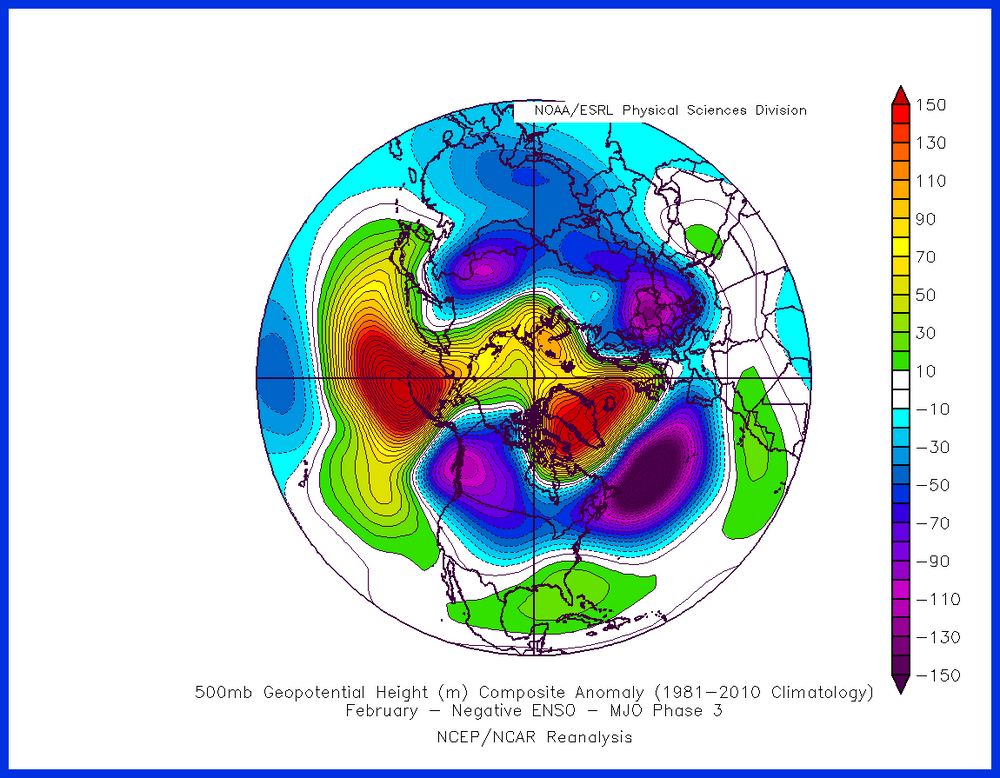
so_whats_happening replied to 40/70 Benchmark's topic in Weather Forecasting and Discussion
Unfortunately those 10 or so days were not all that fun for here. Eastern NC though I'm sure was just in love with this pattern lol. From the looks of the Nina phase 1 passage is taking place this weekend. Large cold dump with warming through much of the plains showing up. Going forward it does show cold building back up into Canada to be unleashed again at some point maybe the last week or so of February into early March as we move into Phase 2/3?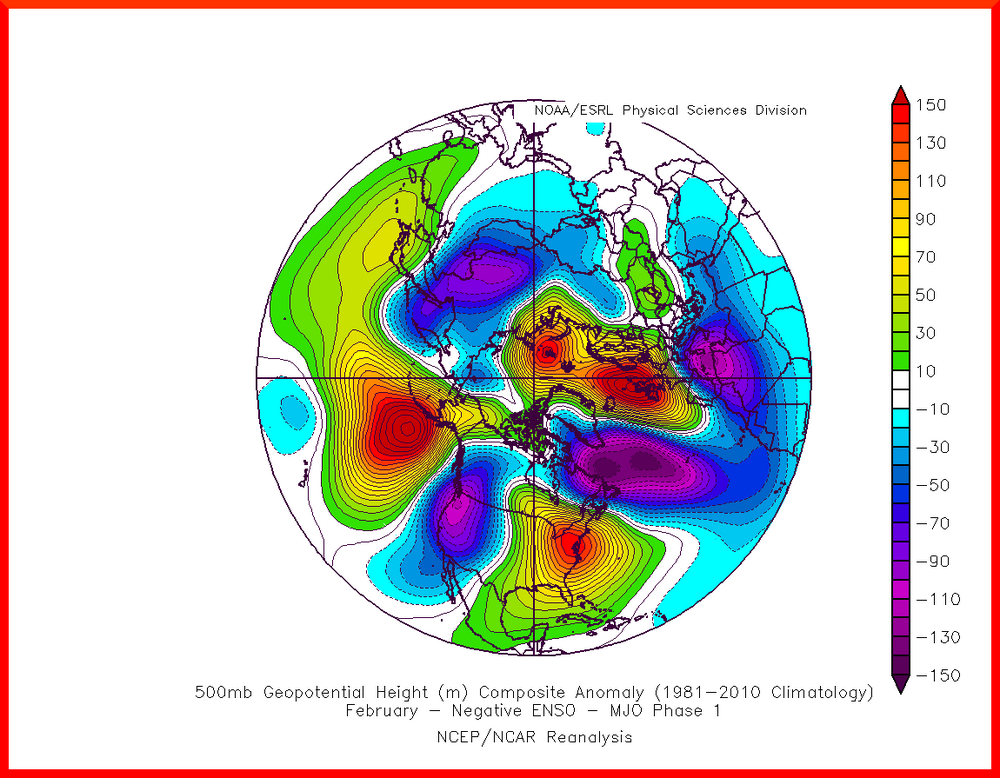

-
2025-2026 ENSO
so_whats_happening replied to 40/70 Benchmark's topic in Weather Forecasting and Discussion
By using that same logic the law of averages would assume we would have extensive cooler than average year(s) coming up too since we have been an endless year after year warm regime. -
2025-2026 ENSO
so_whats_happening replied to 40/70 Benchmark's topic in Weather Forecasting and Discussion
Honestly we haven't really needed much influence from the strat this year other than it maintaining at or below average in strength most of the season. i'd rather have the 500mb take the lead but it would have been nice to lock it in with an actual split. I will not be looking forward to a below average March and April if one were to occur this late in the season. -
2025-2026 ENSO
so_whats_happening replied to 40/70 Benchmark's topic in Weather Forecasting and Discussion
https://www.geo.fu-berlin.de/en/met/ag/strat/produkte/winterdiagnostics/ -
2025-2026 ENSO
so_whats_happening replied to 40/70 Benchmark's topic in Weather Forecasting and Discussion
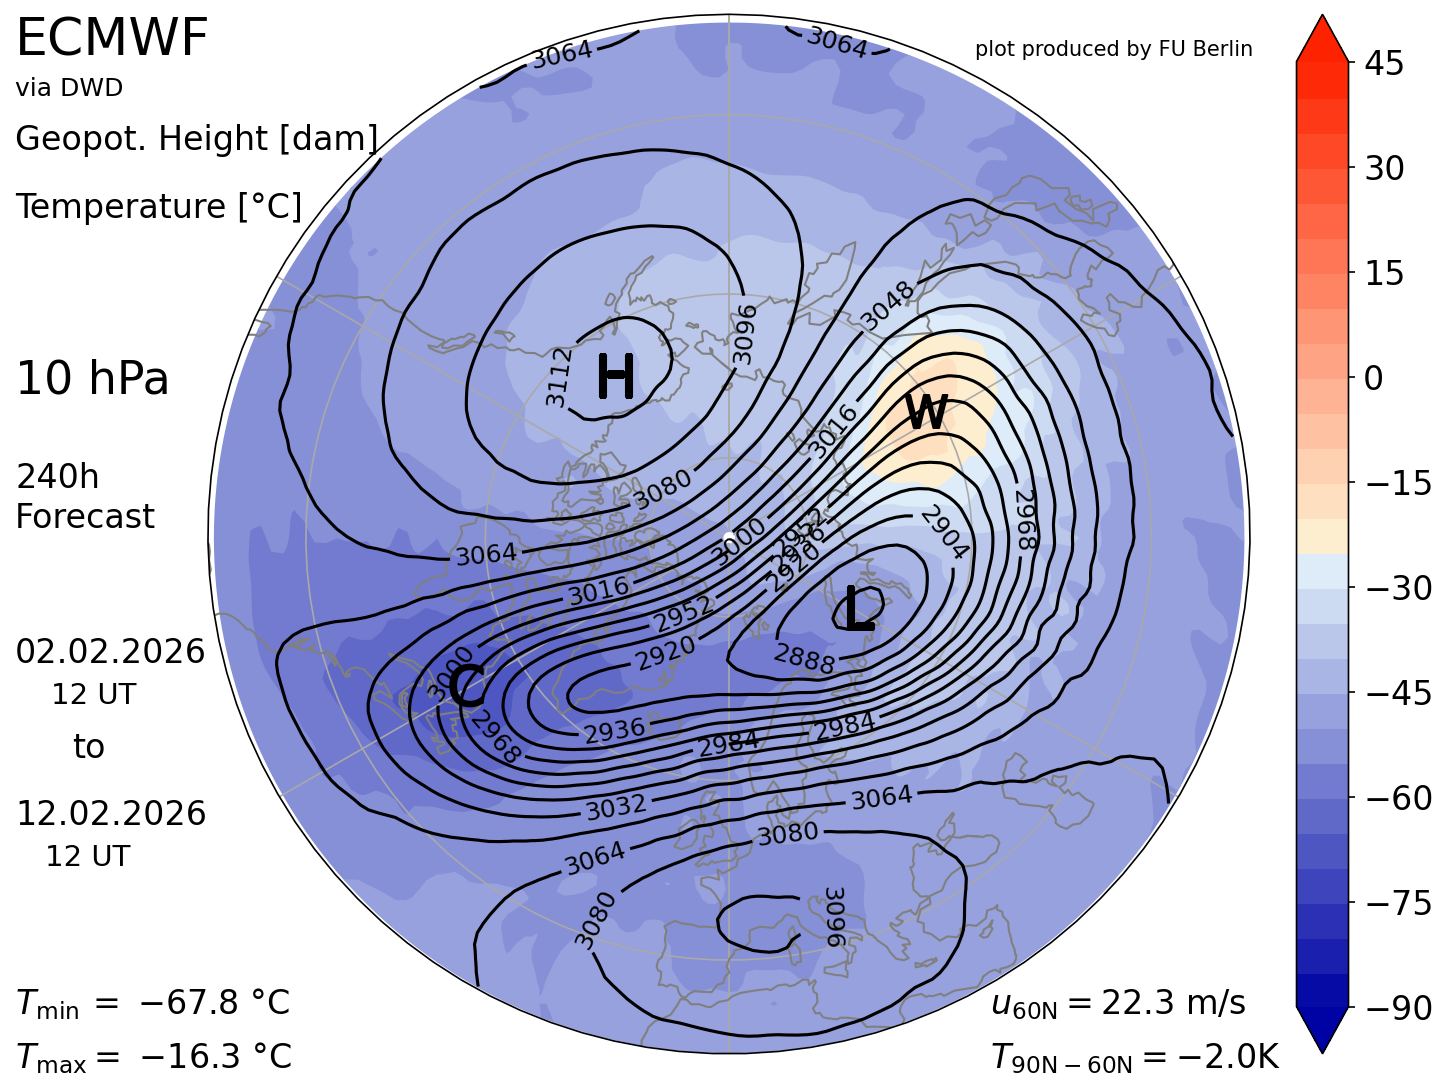
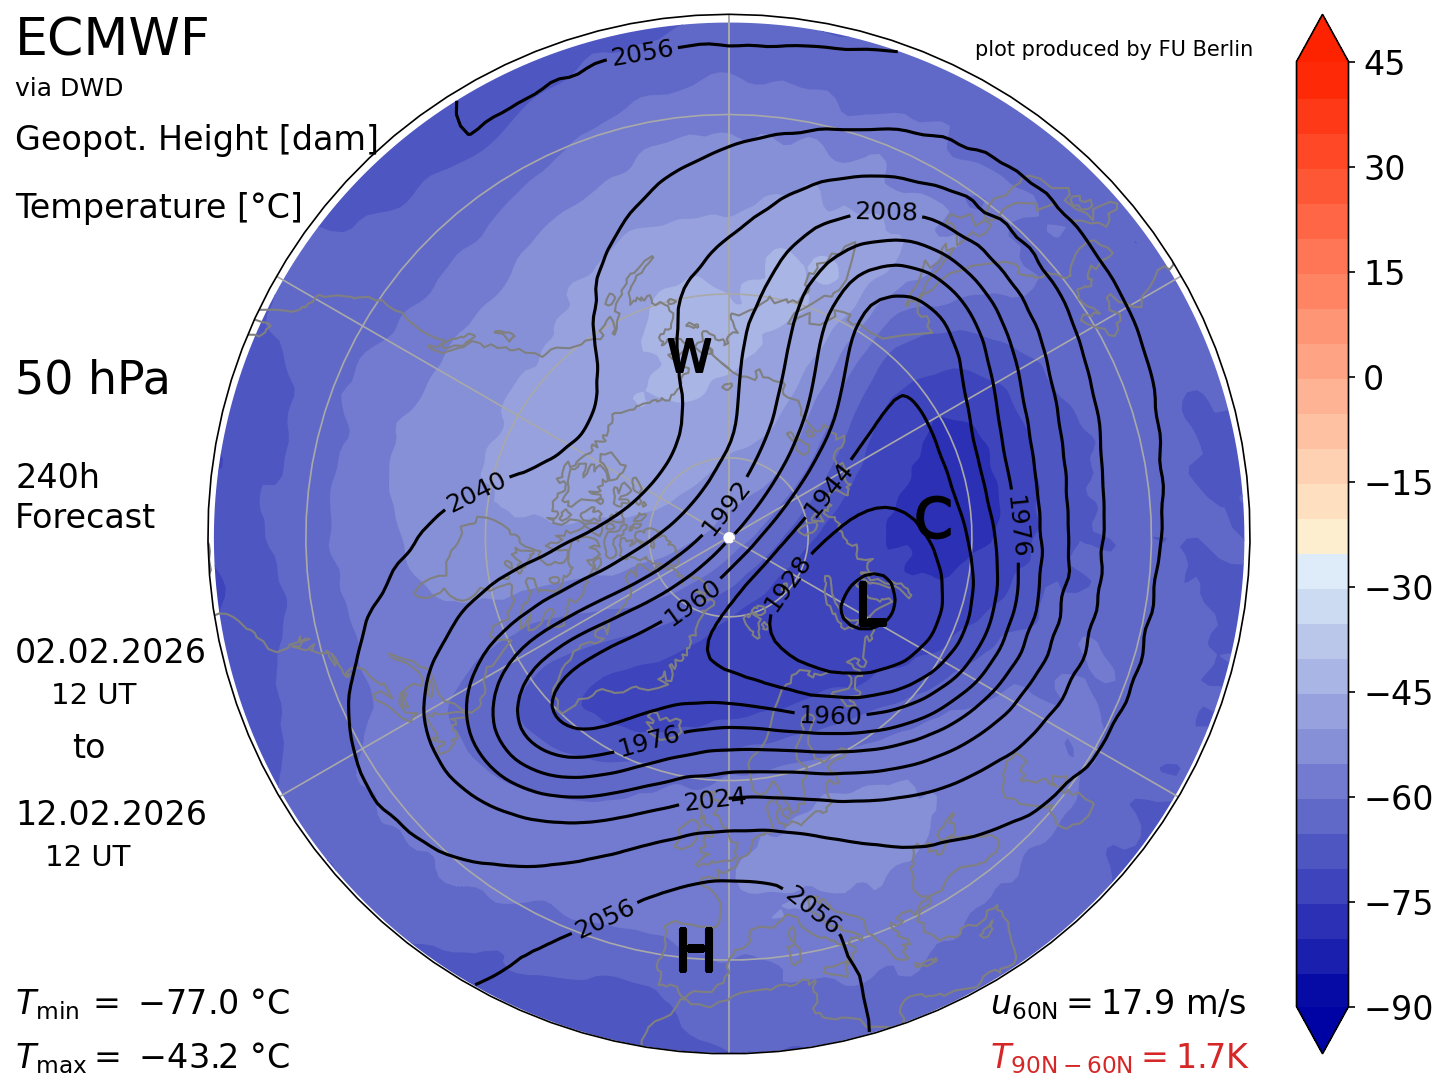
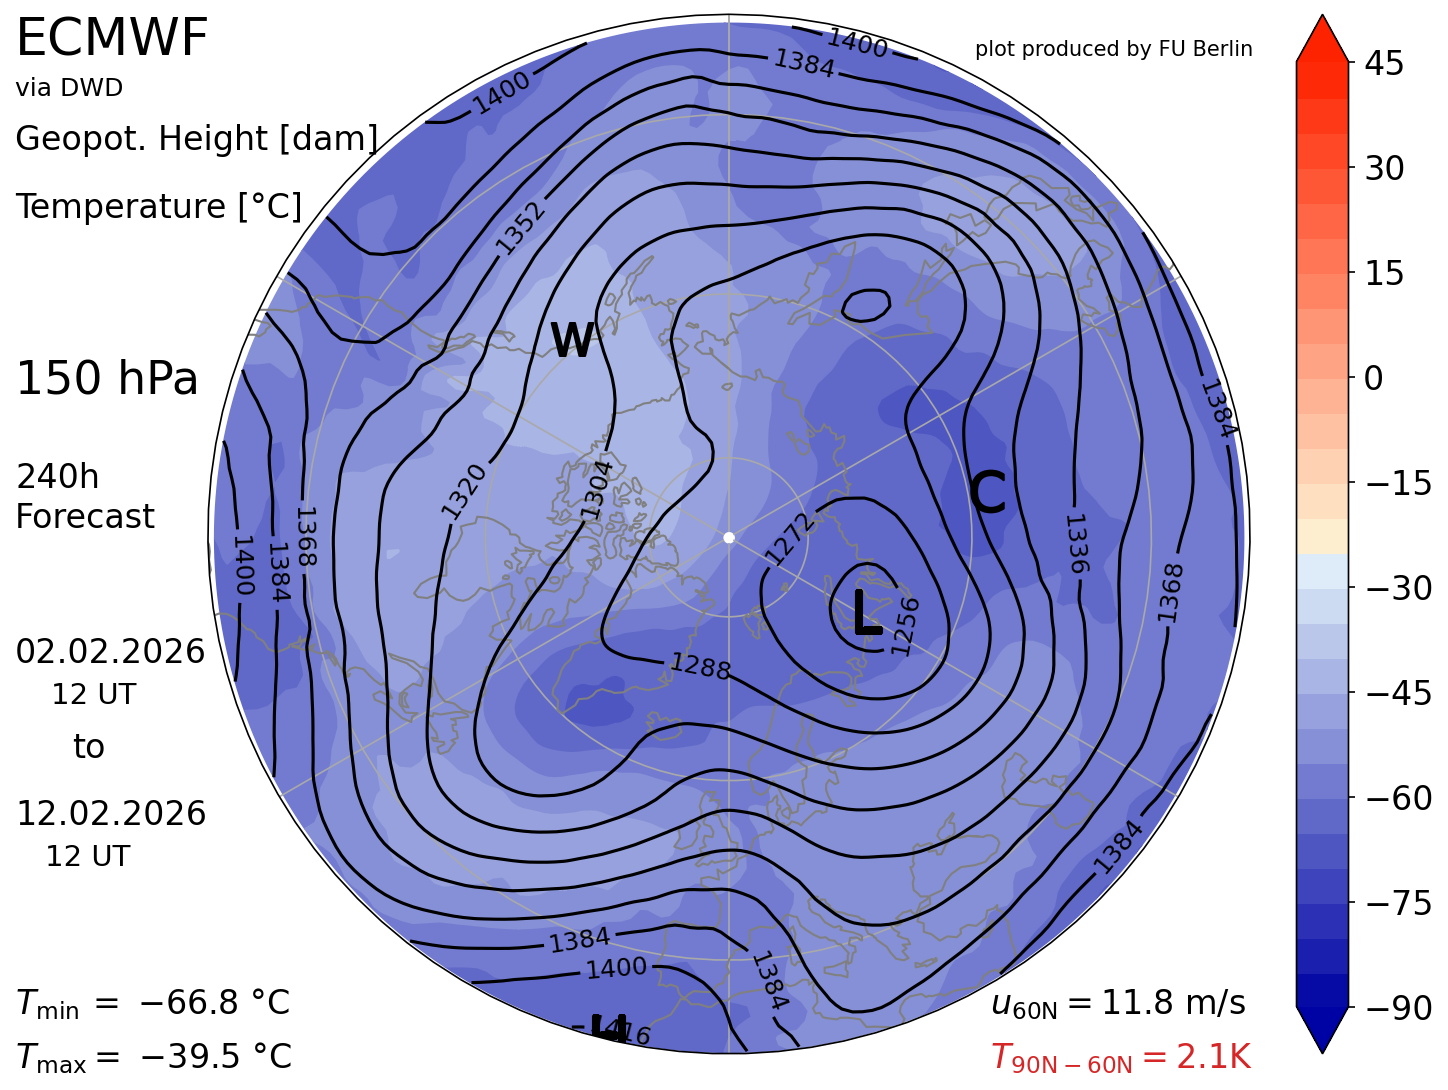
Vortex stretching is the term but Im still not seeing a split take hold even with the Euro to 240. It took roughly 30 days to translate to the surface in 2018 (split occurred around the first few days of February) leading to the snowfall events around presidents day and into March. Much different outlook this go around.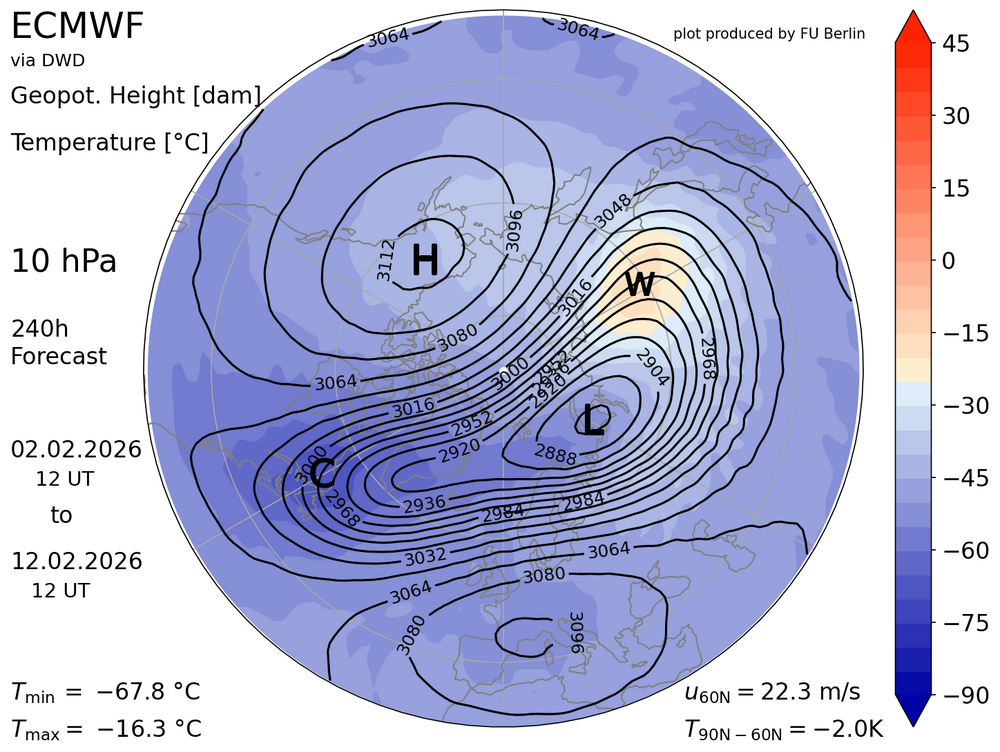


-
2025-2026 ENSO
so_whats_happening replied to 40/70 Benchmark's topic in Weather Forecasting and Discussion
All this to say I do want to go out with a bang for the season but my hopes are slowly fading like the winter season.
.gif.37e6df803db193ad13302b0b7edc824c.gif)


.gif.89b9480c8be4a0b413959f5f2ea61089.gif)
.gif.528a4027502253e606e625afff53603d.gif)
.gif.ce6bfd56829ddb84a45fcbb461fc8344.gif)