

so_whats_happening
-
Posts
1,347 -
Joined
-
Last visited
Content Type
Profiles
Blogs
Forums
American Weather
Media Demo
Store
Gallery
Posts posted by so_whats_happening
-
-
30 minutes ago, snowman19 said:
Here is what makes me confident that we see a period of strong, rapid strengthening of this El Nino come October. This +IOD event is quickly gaining strength, is exceeding the latest forecasts and is very likely to become an overperformer, possibly by a lot. In addition, there is very good atmospheric coupling. +IOD constructively interferes with Nino development: https://x.com/selwyyyyn/status/1702714891210195266?s=46&t=NChJQK9_PUjA1K7D2SMojw
Why are they comparing it to 2019? Because this was the last big +IOD pattern, wouldn't it be better to compare it to a stronger Nino pattern?
-
56 minutes ago, griteater said:
Yeah, that's really weird. I don't recall seeing that in the past. You can set your interval and range on the entry page...but not sure why the ranges are missing on the output
Yea the issue still remains even when you change the interval and range you still don't get a bar. Unfortunately they do not list what default settings they use in their info. I can guesstimate it but can't get it to quite look like theirs but it at least gives me a better idea knowing the interval and ranges when I change it up, so that helps.
-
1 hour ago, griteater said:
Good link here for SST re-analysis - psl.noaa.gov/cgi-bin/gcos_wgsp/printpage.pl
You can compare older years against its climate period. Image below is Oct-Dec 1955 compared against 1930-1960...hardcore -PDO & La Nina
So only issue I have with this is where are the anomaly ranges?
-
27 minutes ago, griteater said:
Good link here for SST re-analysis - psl.noaa.gov/cgi-bin/gcos_wgsp/printpage.pl
You can compare older years against its climate period. Image below is Oct-Dec 1955 compared against 1930-1960...hardcore -PDO & La Nina
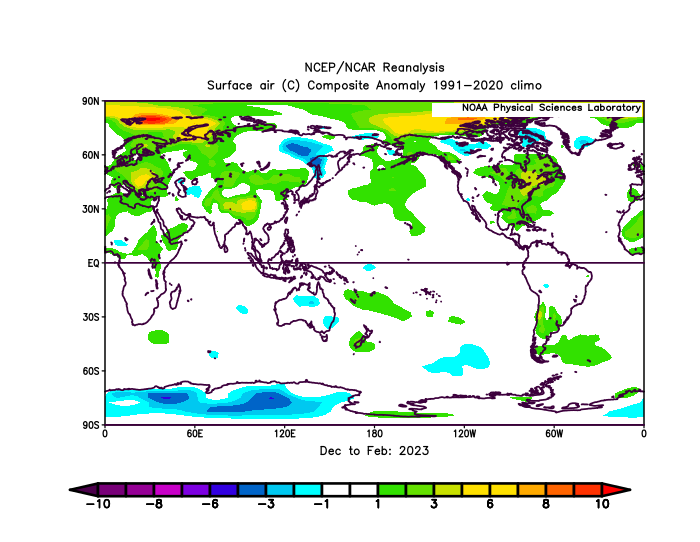
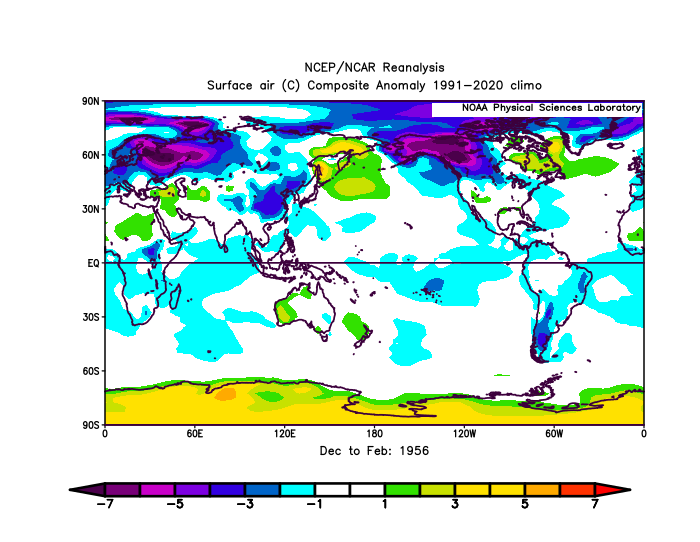
For DJF purposes this was the 1956 to their baseline climo as compared to 2023 compared to the default used. Tried to use a similar difference in comparison between the two.


-
17 minutes ago, griteater said:
Good link here for SST re-analysis - psl.noaa.gov/cgi-bin/gcos_wgsp/printpage.pl
You can compare older years against its climate period. Image below is Oct-Dec 1955 compared against 1930-1960...hardcore -PDO & La Nina
Wonderful! Thank you very much.
You can see how the pressure tendencies change with water temps.
-
 1
1
-
-
55 minutes ago, 40/70 Benchmark said:
Well, higher heights over the poles means a weaker PV.....but the catch is that what cold there is will be more readily available to the mid latitudes. However, given the depth of the trough in the west, the vast majority funneled out there.

Bolded: absolutely that should be a well known idea at this point no differentiation in opinion on that subject. Higher heights unfortunately all year round in conjunction warming oceans leaves with less severe cold outbreaks.
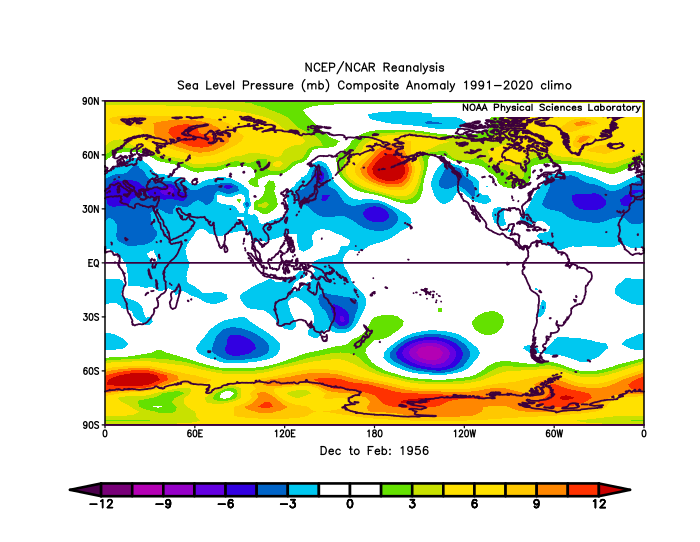
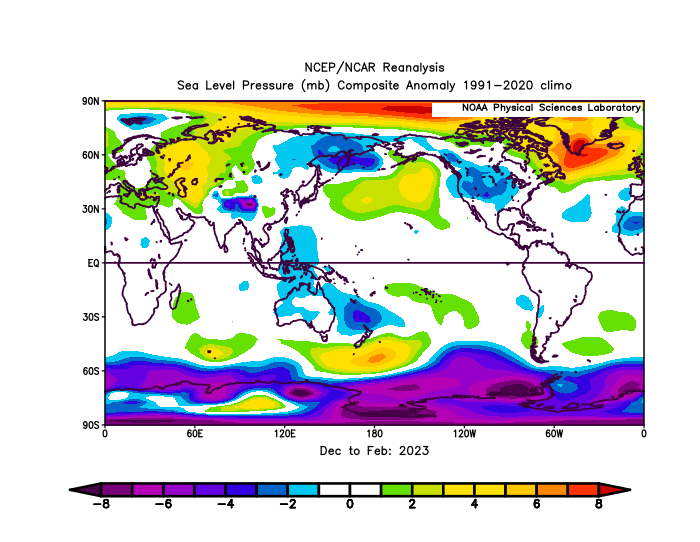
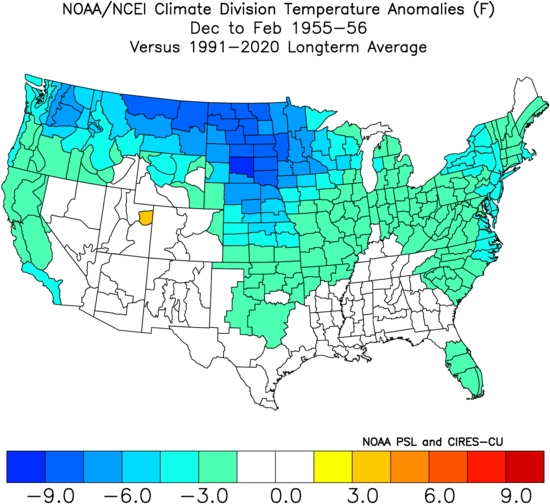
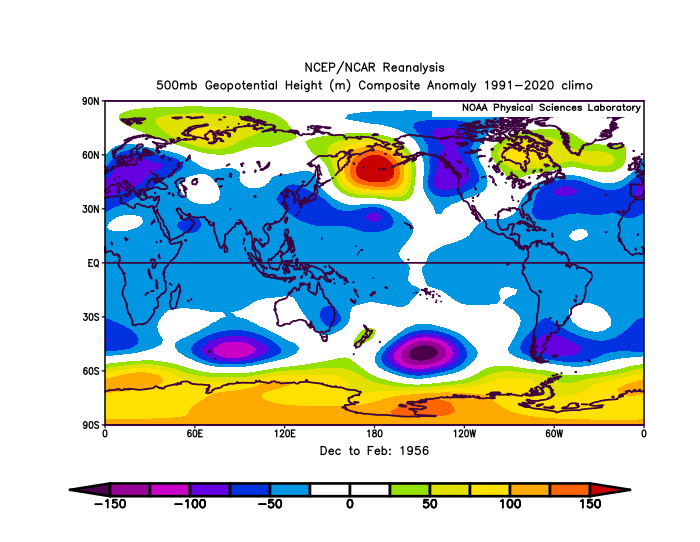
What dictates trough orientation is other things involved and most certainly the pacific pattern influenced it this past year in comparison to a year of similar status. You can see the difference in temp profiles across the US between the two years although scale is different, on the colder end as already discussed, but here nor there you get the idea. Here are the pressure anomalies in comparison you can see weaker pacific high pressure potential and more prominent troughing pattern across the north pacific from Sea of Okhotsk to much of the Bering sea driving it right down the west coast. Where as in 55/56 you had a much stronger high pressure region having cold spill into West Pacific/ Japan and another coming from the north Canada/Alaska region to the Pac NW.
-
1 minute ago, 40/70 Benchmark said:
To me, its clear 2023 had a slightly deeper RNA trough. Also, some of the snowfall is just simple variance due to the chaos of the atmosphere. We def. had some bad synoptic breaks last season independent of global warming.
I think we can both agree the west Pacific played a significant role in how the winter went down in both scenarios given a fairly similar stance in large scale patterns such as ENSO/PDO. The only thing I have ever found with higher heights over the poles is less cold to work with.
-
4 minutes ago, ORH_wxman said:
I think it's good to try and discuss the impacts....so I don't mind these discussions. I've seen a lot of over-attribution in the last 15 years to specific patterns that then change and we stop hearing about them for a while and we move onto the next attribution study. CC is related to all this in some form, but untangling it from natural variation is hard when it comes to specific pattern regimes....and this is doubly true when we are discussing 8 year chunks. That's a terribly small sample to make a lot of longer term conclusions from.
We know what the longer term trend is, but trying to "Adjust" our projections of temperature changes or pattern changes based on very short timescales has it's major drawbacks.
I know the longterm trend for ORH temperatures in DJFM is 0.4F per decade....but if we use only the trend since 2008, then it's at 2F (!!) per decade. So that's the end of the debate, right? We can assume it's going to be 2F per decade over the next 20 years or so? Nope, if we did the exact same exercise from 1985-2000, the trend was also 2F per decade....but then the next 15 years was actually a negative trend of -1.1F per decade. In the mean, the positive trends will outweigh the negative trends, but from an empirical standpoint, there is no evidence that they just continue unabated. I'm certainly open to some "tipping point" that has permanently given us a Philadelphia winter climate, but I would obviously treat such claims with extreme skepticism and they should be until evidence is way stronger.
Fair points all around
-
21 minutes ago, 40/70 Benchmark said:
I was about to analyze the polar domain, but you saved me the trouble. Again, not arguing identical patterns would be warmer now, nor that those would have some impact on the H5 pattern, but that was not the primary issue last year. Did it cost us a few to perhaps several inches in a season with a real dearth of well-timed polar airmasses in the source region of se Canada? Probably.
The polar domain having higher heights means less cold is able to stay up north and be produced versus 1955/56 so in that sense cold air would have spilled through much of the lower latitudes you can see the difference in the amount of cold air. Think this really could have played a major role as there was no issue with precip across the area and many times down this way we were right on the edge of getting snow just ended up too warm. So it is very possible we could have had similar results had the overall atmosphere and polar domain not been warmer.
Again wish I had an SST reanalysis for 55/56. +WPO versus -WPO winter also played a significant role long sustained jet versus a wavier jet.
There also seems to be some counter balance situation between northern hemisphere and southern hemisphere that is interesting to note, probably on a decadal scale of sorts.
-
3 minutes ago, ORH_wxman said:
Actually not a terrible match over North America, though the PNA trough is deeper in 2022-23 and the NAO block is in a much better spot in '55-56 for northeast snow (west based near Hudson Bay and Baffin).
55/56 gave us in the mid atlantic around 28" of snow that winter 22-23 gave us 0.9" both solidly negative PDO signals and both in a moderate La Nina pattern. I unfortunately don't have SST reanalysis for 55/56.
By far the biggest difference was the Pacific 55/56 could have a similar ish look had we not had a +WPO pattern this past year.
-
1 minute ago, 40/70 Benchmark said:
Well, you will definitely reach that threshold the lower in latitude and elevation a given locale is.
Going solely off the idea of 1955/56 being a moderate/strong La Nina and having a -PDO of near -3 to last year having a moderate La Nina and a -PDO of about -2.5
.png.e1f2a44c2f364f5d6fd9fd4f39c1c2a0.png)
-
20 hours ago, so_whats_happening said:
Yea coming from an area that is highly variable in general this is the snow graph from Millersville just SW of me from 1926 to what looks like 2021 (unfortunately 2022 and 2023 not on their but 15.0" and 0.9" respectively).
Average is about 27.4" according to the month to month break down, feel this has gone up a bit from about 24-25" but would have to double check. We are not immune to really bad winters around here but the frequency of not having snow or having alot of snow has definitely changed a bit seems to be a one or the other situation around here.
So going off this we had a deeply negative PDO in the 50's
1950/51: around -2 to -3 over the summer (Neutral ENSO) ~7" of snow
1951/52: was a bit more relaxed but still averaged around -1 and dipped to -2 in winter. (El Nino) ~27" of snow
1955/56: deeply negative again (-2 to -3) at the levels experienced in 1950/51 (moderate to strong La Nina) ~28" of snow
1956/57: again around -1 to -2 (Neutral ENSO) ~18" of snow
1958/59: neutral to +PDO (strong El Nino) ~8" of snow
1960's were full of snow except for 1967/68 that had ~18" which was a neutral year (cool PDO didn't average much below -1, with a spike in july august to around -1.5 area)
Early 60's had a -PDO regime that relaxed through much of the mid to late 60's and we had some high snowfall years. Early 70s came back with a -PDO period as well then relaxed.
So strong Nino and +PDO don't go well around here, neutral ENSO and -PDO do not go well around here, La Nina and -PDO are ehh around here. So with the enhancement of the warmer Atlantic it probably nudged us over to lower snow totals during a -PDO/ La Nina pattern there was already a ridge pattern in the east due to the -PNA but it is now enhanced due to warmer waters off the coast creating a stronger ridge profile not necessarily a deeper -PDO profile.
PDO data: https://oceanview.pfeg.noaa.gov/erddap/tabledap/cciea_OC_PDO.htmlTable?time,PDO
I only state this as being a Mid Atlantic resident.
-
1
-
-
1 minute ago, bluewave said:
A 7° warmer Gulf Stream is probably playing a role in tandem with more frequent and stronger MJO 4-6 activity with the record WPAC warm pool.
True, I mean the whole W Atlantic has just been insanely warm for years now. The Labrador current is non existent right now too. Wonder what it will take to flip the +AMO pattern?
-
7 minutes ago, Terpeast said:
Thanks. I was expecting 0.5, so tracking a bit behind
This is probably one of the larger differences we have seen in a warm phase. Definitely gives an idea of just how impactful this El Nino may end up.
-
Just now, bluewave said:
It used to be better especially further to the south of our area when there was more of a PV near the East Coast rather than a SE Ridge.
Ocean temps probably helping in conjunction with the more frequent 4-6 MJO, top it off with a -PDO period and boy is it going to look rough. Hope we can get tropics to still actively take out the warmth along the east coast through the end of October maybe it gives us a fighting chance at something different.
-
6 minutes ago, Terpeast said:
Was there a september update of MEI? Want to see how the JA value compares with 0.3 in JJ.
0.4 for July/ August
-
 1
1
-
-
43 minutes ago, bluewave said:
I am trying not to envision anything like last winter.
") My point is that every winter since the 15-16 super El Niño reset has had some element of the WPAC warm pool La Niña flavor. So no mater what the ENSO does, we have had a record breaking 8 warmer than normal winters in a row. While I have gotten used to that, it isn’t easy going nearly snowless like last winter. So we need just enough -AO -NAO blocking on the Atlantic side and enough +PNA or -EPO blocking on the Pacific side to have one or a few KU events. Just way too many elements in the mix these days to say with confidence what version of winter is going to show up ahead of time.
My point is that every winter since the 15-16 super El Niño reset has had some element of the WPAC warm pool La Niña flavor. So no mater what the ENSO does, we have had a record breaking 8 warmer than normal winters in a row. While I have gotten used to that, it isn’t easy going nearly snowless like last winter. So we need just enough -AO -NAO blocking on the Atlantic side and enough +PNA or -EPO blocking on the Pacific side to have one or a few KU events. Just way too many elements in the mix these days to say with confidence what version of winter is going to show up ahead of time.
There have been no winters with a moderate amount of snow at ISP on Long Island since the late 90s. Every winter since then has been all or nothing with the snowfall. Either at least one record breaking KU event and above normal snowfall or next to nothing and well below normal snowfall. The median snowfall winter which was the mainstay from the 60s to 90s has been nowhere to be found. So how you issue a snowfall forecast in the fall and know with confidence which type of season is going to show has been very tough to do. In the old days, you could go with a median snowfall forecast winter and have a reasonable chance of being correct.
Yea coming from an area that is highly variable in general this is the snow graph from Millersville just SW of me from 1926 to what looks like 2021 (unfortunately 2022 and 2023 not on their but 15.0" and 0.9" respectively).
Average is about 27.4" according to the month to month break down, feel this has gone up a bit from about 24-25" but would have to double check. We are not immune to really bad winters around here but the frequency of not having snow or having alot of snow has definitely changed a bit seems to be a one or the other situation around here.
-
1
-
-
41 minutes ago, ORH_wxman said:
Data retrieval has gotten significantly worse in the past 2 years. Pretty frustrating since it should be easier considering the raw concentration daily data is available on NSIDC. It's just nobody is putting into numeric form anymore.
It has been extremely hard to find data of recent for many things not just sea ice. I do not like it. The temps are holding rather steadily above average across the Arctic so it will definitely be a slow start this year. The Russian land temps are finally cooling down enough that it should help with starting the refreeze season soon but we may have seen our lowest for the year and just a very slow start as we head to October.
-
CPC site finally updated still holding on to quite a bit of subsurface warmth out in the way western Pacific, if that has not gone away it still does mean that another KW is on the table. When is clearly the question at hand but not anytime soon I suppose. Still nothing showing up with even a minor WWB to the of the month. Luckily the trades are not nearly as strong as last year but strong enough to put a lid on things for now.
Edit: I do not know why CPC gif always stop but it is what it is at this point. Here is the site if folks don't have it.
https://www.cpc.ncep.noaa.gov/products/analysis_monitoring/enso_update/wkxzteq.shtml

-
Just now, 40/70 Benchmark said:
Well, feel free to borrow some precip, but I want it back by mid December.
Lol well be careful with that because once it starts it may not shut off down here.
-
Just now, 40/70 Benchmark said:
You can have some of mine.
Lol im good when we have had rains it has been quite prolific and caused flash flooding. Just want a nice synoptic style rainfall to ease some of the worries around here.
-
13 minutes ago, GaWx said:
OHC per this graph dropping back some more to <+1.2:

There is an expansion of cool anomalies and a weakening of the thermocline. Looks to be moving back to August location for anomalies? One thing that does look locked in is the anomalies in the west 3.4/4 region those are not moving however the eastern areas... to be continued.
-
3 minutes ago, snowman19 said:
I agree with you. Look at the projected pattern the end of this month, this looks like a classic La Niña to some people?? With a juiced STJ screaming across the CONUS??? Here: https://x.com/empirewx/status/1701940678731645183?s=46&t=NChJQK9_PUjA1K7D2SMojw
It is not a screaming STJ lol it is there but not a crazy STJ let the seasonal pattern sink in. Things are not going to flip on a dime. I however do not like the troughing trying to sneak back into the west coast on models. Let's see how it shakes out.
-
2 hours ago, Terpeast said:
This makes me think that we may have more variability this winter than any set canonical pattern.
This may not be a bad thing, as the biggest snowstorms happen during pattern changes (-nao to +nao for example)
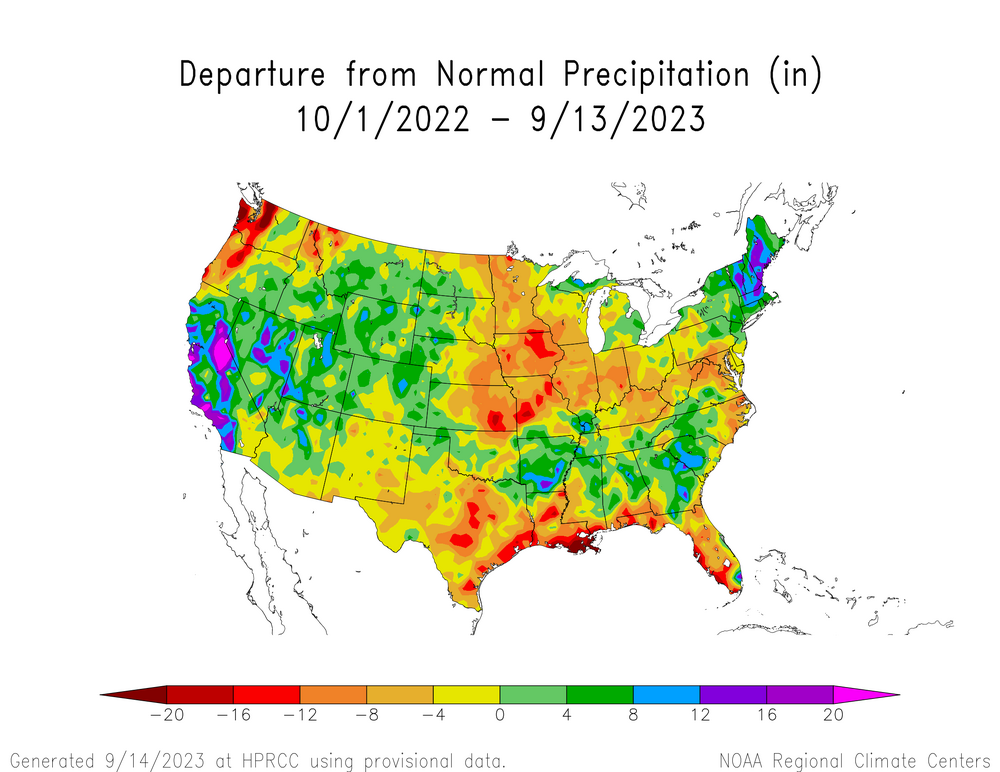
Worth noting that most of the MA is already at climo or above in rainfall just from that 4-6 day period of heavy rain and storms in the last week.
While it is nice to finally be catching up on some rainfall we still have a ways to go unfortunately. It has been quite the dry water year.
I hate to say it but something tropical will have to push us close to average. The period from April- June was insanely dry around here July was at or above average across most of the area and each month since has been close to but just below average.


El Nino 2023-2024
in Weather Forecasting and Discussion
Posted
I sure hope the warm anomalies can hold along the west coast from BC down to Cali. Also here is the latest TAO subsurface animation August 27th to Sept 17th.