All Activity
- Past hour
-
I have off today and I refuse to even go outside once. It's a perfect 65 in my room. Sent from my SM-G970U1 using Tapatalk
-
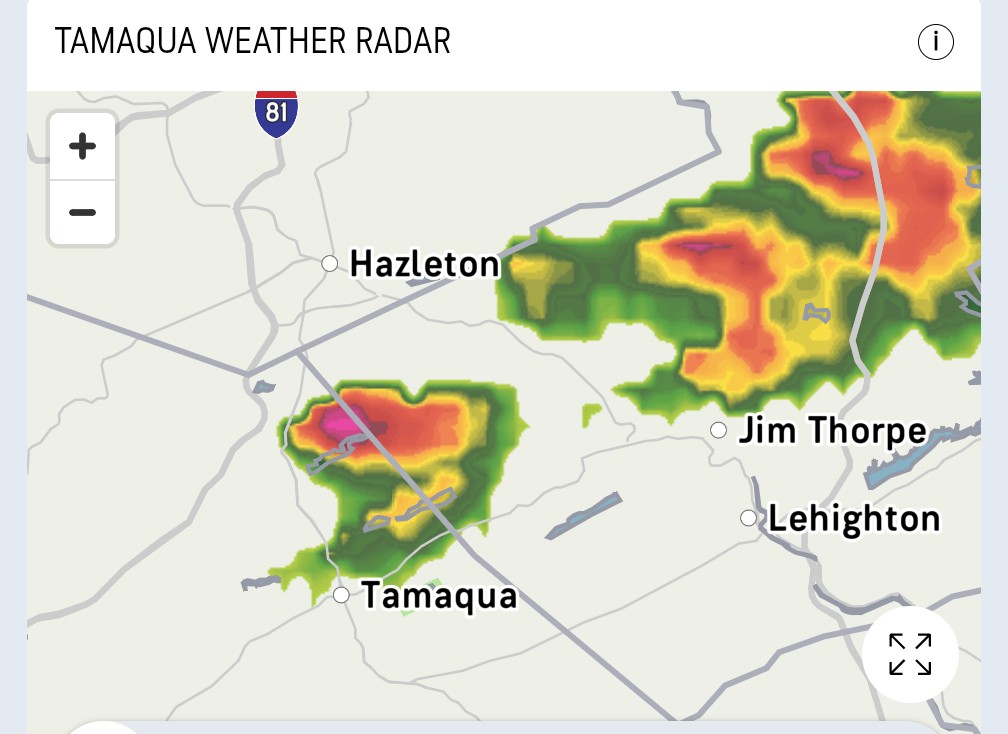
Typical. Storm moving east-southeast. Wouldn't have it any other way...

-

July 2025 Obs/Disco ... possible historic month for heat
Dan76 replied to Typhoon Tip's topic in New England
Could use it. -
 And I see 12z GFS now brings in the blazing heat during the 2nd week of the month, maybe the hottest weather of the summer. A long way to go for details on how hot it will get, but we have building support for significant heat as Don pointed out. We need to enjoy the comfortable 1st week of the month before it gets very hot again.
 -

July 2025 Obs/Disco ... possible historic month for heat
Spanks45 replied to Typhoon Tip's topic in New England
I recall last year's SW CT flood started on the models looking similar to that with the jackpot, hope it doesn't start shifting our way...we could use some rain, but not 4-8 inches of it -

July 2025 Discussion-OBS - seasonable summer variability
LibertyBell replied to wdrag's topic in New York City Metro
some very interesting things in these three graphs Chris!! in the top graph, 2010 and 2011 are tied at number 1 with the same exact temperature!! in the second graph, this July is number one but July 2010 is still very high at number 3, in between them is July 2019 (which outside of those two very hot days I don't remember any other heat). in the bottom graph, for mins this July is number 1, but July 2010 is no slouch, it's at number 2, even though it was a much drier summer!! -
 What would happen if they expanded the "base periods" to fifty or sixty year intervals? They would be less susceptible to short-period fluctuations as 1976-9, which were sharply cooler than normal.
 -
Thanks. I have always been suspicious of instant declarations that any date or period of time was the "hottest ever." Clickbait or alarmism.
-

July 2025 Discussion-OBS - seasonable summer variability
anthonymm replied to wdrag's topic in New York City Metro
It wouldn't surprise me if the average low for the city this july is about 76. Crazy -
July 2025 Discussion-OBS - seasonable summer variability
LibertyBell replied to wdrag's topic in New York City Metro
But the average high is up there too isn't it-- I think you posted a table showing it's the second hottest (going by high temperatures) right behind 2010? And that the July mean temperature at JFK is very close to 80.0? -

July 2025 Discussion-OBS - seasonable summer variability
bluewave replied to wdrag's topic in New York City Metro
The increasing dew points lead to the mimimums rising faster than the maximums at places like JFK. This has been the warmest July for the maximum average heat index and low temperature.The maximum average temperature at JFK has been lower this July than back in 2010 and 2011. But this July feels warmer due to the higher dew points than 2010.


-
yes my first year viewing the perseid meteor shower (I forget which year, either 1986 or 1987) it got down close to 50 at night with clear skies and felt like early fall, zero haze too.
-

July 2025 Discussion-OBS - seasonable summer variability
Sundog replied to wdrag's topic in New York City Metro
The urban jungle used to average lows in the upper 60s in July. Up until the 1981-2010 averages it did. Even in rural areas, if your dewpoints are high you're not cooling off either. Everyone's warming up at night. The farmland went from 65 to 68 and the city went from 68 to 71, or something like that. So yea rural still averages in the 60s but not as low into the 60s. -
July 2025 Discussion-OBS - seasonable summer variability
LibertyBell replied to wdrag's topic in New York City Metro
thanks Tony, out of those I think 1993, 1999, 1983, 2010 and 1991 all had at or above 30 90+ degree days, were there any others? -

July 2025 Obs/Disco ... possible historic month for heat
40/70 Benchmark replied to Typhoon Tip's topic in New England
Risky, but you dew you -

July 2025 Discussion-OBS - seasonable summer variability
LoboLeader1 replied to wdrag's topic in New York City Metro
95F/65 -

July 2025 Obs/Disco ... possible historic month for heat
ma blizzard replied to Typhoon Tip's topic in New England
extended GFS setting up to torch -

July 2025 Discussion-OBS - seasonable summer variability
wdrag replied to wdrag's topic in New York City Metro
Heavy showers organizing E PA. SPC HREF seems to have spot 7" MAX potential by Thu evening. Waiting completion of the HREF and then probably starting a thread for iso FF, detours, travel delays...sometime between 4-8P. -
July 2025 Discussion-OBS - seasonable summer variability
LibertyBell replied to wdrag's topic in New York City Metro
Yes it's really hard to do a top 5 you have to weigh them by some system (so you end up having to do math anyway haha). Basically I'm looking for years that have at least 30 90+ degree days (there's not that many of them), at least 5 95+ degree days and at least 1 100+ degree day. For JFK only 2010 makes that list. For NYC it's more than that but I'm not sure it's 5. I know for sure 2010, 1993, 1991 make this list for NYC (and maybe 1999 too?) but I don't know which others do. 1983 did not get to 100 in NYC (but 99 in September and 100 twice at JFK) I'd still put 1983 near the top for NYC because it held the 90 degree day record until 1991 and 1993. 1953 had four 100+ degree days at NYC but I don't think it had 30 90+ degree days (although it had two of our longest heatwaves ever. 1966 also had four 100+ degree days at NYC (and three in a row at JFK) but I'm not sure it had the 30 90+ degree days I'm looking for. 1955 holds the record for NYC with 16 95+ days but I'm not sure it hit 100 in 1955 at NYC. It's possible 1949 also belongs on this list with 5 99+ degree days at NYC (2 of which were 100+) and 8 100+ degree days at EWR but I don't know the number of 90+ degree days in that year. -
The only thing is that woulf make us a buyer--and we aren't exactly in a position to be that for this trade deadline. Now I could see a scenario where we package some of the prospects we get this year to buy something in the off-season.
-

July 2025 Discussion-OBS - seasonable summer variability
SACRUS replied to wdrag's topic in New York City Metro
Wide view starting to see semblance of some popup storms in EPA and the clouds -
July 2025 Discussion-OBS - seasonable summer variability
LibertyBell replied to wdrag's topic in New York City Metro
there's too many summers to pick from for me to do a top 5, so I'll just list my top 5 ideal summers. 1. 2010 2. 1993 3. 1999 4. 1983 5. 1966 -
It would be even better to have a real summer for once. The last four were disappointing.
-
July 2025 Discussion-OBS - seasonable summer variability
SACRUS replied to wdrag's topic in New York City Metro
Depends on the metric overall summer temps (avg) , number of 90 degree days, number of 95 degree days, number of 100 degree days or higher. -
July 2025 Discussion-OBS - seasonable summer variability
SACRUS replied to wdrag's topic in New York City Metro
NYC 95 degree or higher saeson leaders Year Rank Days >= 95 °F 1955 1 16 1988 2 14 2002 3 13 1993 3 13 1999 5 12 1953 5 12 1949 7 11 1944 7 11 1983 9 10 1980 9 10 1966 9 10 2005 12 9 1952 12 9 2010 14 8 1991 14 8