All Activity
- Past hour
-
Where did you see it? They're all around Worcester county now I guess.
-
This was all because I finally threw in the towel and reaped myself for the summer 2014 redux at the end of July. I’ll try pressing my luck and set up an auto-reap for this winter on November 1; that oughta lock us in an 09-10.
-
-
The 12Z GFS has this and makes it a H. The 12Z Euro has just a weak low. For the record: after 4 12Z JMA runs in a row with a TC from this, today’s 12Z JMA had no TC.
-
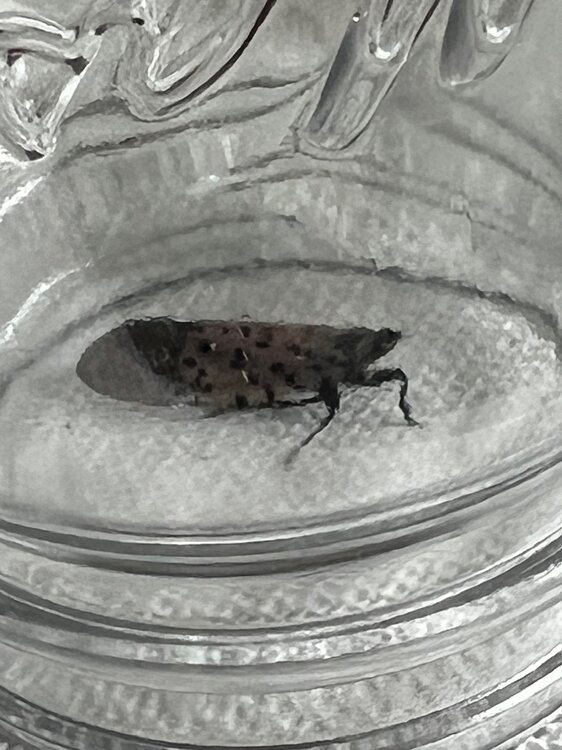
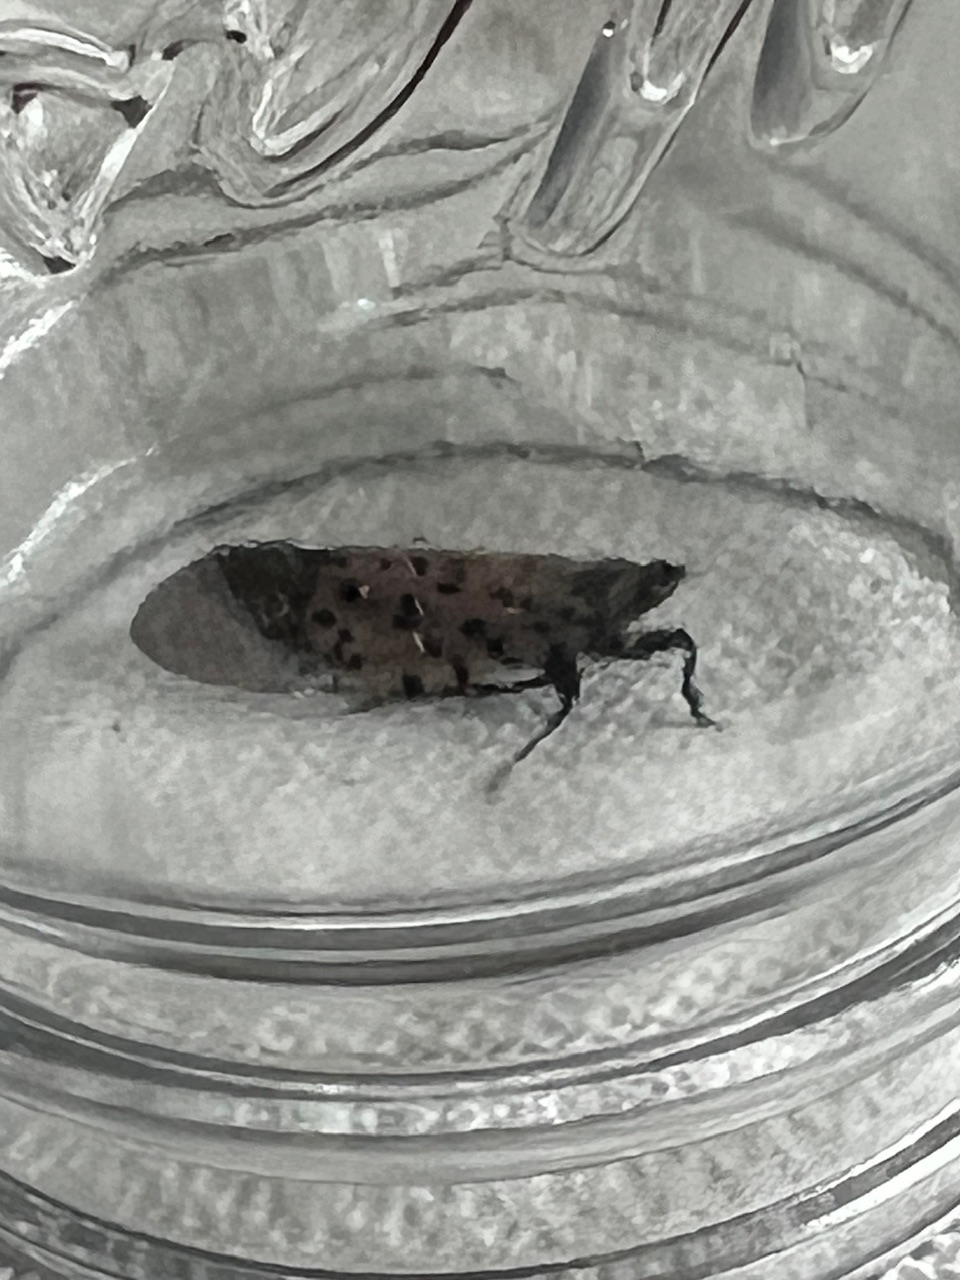
1st one I’ve ever seen locally.
-
Yeah I’m torn between viewing and trolling versus giving him the views and clicks. It’s a strange timeline that we live in.
-
 High temperatures will top out mainly in the upper 70s and lows will fall to lower 60s in New York City through tomorrow. Outside the City, lows in the 50s will be widespread. During the weekend, lows could fall into the 50s even in New York City. Highs will generally reach the middle and upper 70s. Dry conditions will persist into next week. A system could bring at least some rain during or after the middle of next week. The ENSO Region 1+2 anomaly was -0.1°C and the Region 3.4 anomaly was -0.4°C for the week centered around August 20. For the past six weeks, the ENSO Region 1+2 anomaly has averaged +0.45°C and the ENSO Region 3.4 anomaly has averaged -0.28°C. Neutral ENSO conditions will likely continue into early autumn. The SOI was +24.64 today. The preliminary Arctic Oscillation (AO) was +0.969 today. Based on sensitivity analysis applied to the latest guidance, there is an implied near 100% probability that New York City will have a cooler than normal August (1991-2020 normal). August will likely finish with a mean temperature near 73.6° (2.5° below normal). That would make August 2005 the coolest August since 2000. Supplemental Information: The projected mean would be 1.6° below the 1981-2010 normal monthly value.
 -

Mid to long range discussion- 2025
WinstonSalemArlington replied to wncsnow's topic in Southeastern States
Capital Weather Gang declares summer is over. Premature? https://www.washingtonpost.com/weather/2025/08/28/dc-early-fall-summer-over/ -

2025 Atlantic Hurricane Season
BarryStantonGBP replied to BarryStantonGBP's topic in Tropical Headquarters
Hi Lazza! Guess this means the wave off Africa probably might fizzle out and not develop no? -
My (lazza) Euro Weeklies update Tue’s (8/26/25) Euro Weeklies ACE Sep progs vs very active 20 yr climo:1-7: 4.5 (0.3)8-14: 11.3 (0.7)15-21: 20.4 (1.3)22-28: 22.4 (1.6)Today’s (8/28/25) EW ACE progs are less active weeks 2-4 vs the Tue run but still show the same pattern of a relatively quiet first half of Sept and a much more active 2nd half somewhat similar to Sept of 2024:1-7: 4.5 (0.3)8-14: 8 (0.5)15-21: 17 (1.1)22-28: 20 (1.4)
-
2025 Atlantic Hurricane Season
BarryStantonGBP replied to BarryStantonGBP's topic in Tropical Headquarters
Lazza @GaWx from storm2k posted this, quite useful: LarryWx S2K Supporter Posts: 6504 Joined: Sun Sep 07, 2003 2:04 pm Location: GA Re: 2025 Global Model Runs Discussion (Out thru day 16) #808 by LarryWx » Thu Aug 28, 2025 3:37 pm Tue’s (8/26/25) Euro Weeklies ACE Sep progs vs very active 20 yr climo: 1-7: 4.5 (0.3) 8-14: 11.3 (0.7) 15-21: 20.4 (1.3) 22-28: 22.4 (1.6) Today’s (8/28/25) EW ACE progs are less active weeks 2-4 vs the Tue run but still show the same pattern of a relatively quiet first half of Sept and a much more active 2nd half somewhat similar to Sept of 2024: 1-7: 4.5 (0.3) 8-14: 8 (0.5) 15-21: 17 (1.1) 22-28: 20 (1.4) -
2025 Atlantic Hurricane Season
BarryStantonGBP replied to BarryStantonGBP's topic in Tropical Headquarters
- Today
-
Predict the name of the next major hurricane
BarryStantonGBP replied to BarryStantonGBP's topic in Tropical Headquarters
voted btw -
I had around 40? in the 2015 blizzard, which was drifted 8' against my front door of house. It was almost impossible to measure properly beyond the 30" range but L.E. was around 3.6" iirc
-
Predict the name of the next major hurricane
BarryStantonGBP replied to BarryStantonGBP's topic in Tropical Headquarters
@GaWx made a poll -
Predict the name of the next major hurricane
BarryStantonGBP posted a topic in Tropical Headquarters
title lads -
2025 Atlantic Hurricane Season
BarryStantonGBP replied to BarryStantonGBP's topic in Tropical Headquarters
OI LAZ @GaWx You said this Does this mean we could see a shite Gabrielle then the others after that explode? The Euro Weeklies show significant ACE from the second half of sep onwards Possibly an ACE hogger or two -
nothing historic for hill /lower mountain towns, and of course populations didn't see much.
-
March 2023 here
-SnowfallAnalysisPublic1.thumb.png.bd4ece1d418b969951e709427e7ecd41.png)
-
strange content going on there. my fault for watching, ofc :/
-
6 seconds in and already rubbing the north pole https://x.com/i/status/1959377950404465146
-
We had a 100% chance of rain today and I didnt see a drop
-
Occasional Thoughts on Climate Change
donsutherland1 replied to donsutherland1's topic in Climate Change
If one ever needed additional demonstration that some of the loudest social media influencers who deny climate change lack critical reasoning skills, below is one example: Look closely at the Time story's date: August 18, 2025. Now look closely at the influencer's counterargument: "Banana production reached an all-time record high in 2023." Yes, he's arguing that because banana production hit a record some two years earlier, there could not possibly be a shortage today. In other words, the situation could not have changed. There is nothing to support the assumption at the heart of his flawed conclusion. Let's take a look at how flawed this reasoning actually is using a weather example. In spring 1985, New York City was in the midst of a drought emergency. Applying the same logic, the social media influencer would have declared, 'I cannot spot a drought. Can you? Precipitation reached an all-time record high in 1983." 1983 Rainfall: 80.56" 1985: Drought Emergency As noted previously, social media influencers are bad sources of weather or climate information. In fact, in many cases, they are bad sources of information (no attributive nouns required). In this particular example, one can see how a lack of critical reasoning capacity impairs the social media influencer's ability to reach a sound judgment regarding bananas. The social media influencer is blind to the reality that dramatic changes can occur over even short periods of time rendering past data irrelevant to a current situation. Indeed, I suspect that it is often that inability to reason critically coupled with cognitive biases (with or without motivated reasoning) that plays a crucial role in making it impossible for social media influencers and many others who deny climate change to reach sound conclusions based on the evidence. Hence, there is no level of sufficient evidence that can alter their positions. They will reject the evidence that diverges from their preferred position regardless of how overwhelming it is. On the other hand, they will eagerly embrace conspiracy theories e.g., claims of data manipulation, that support their positions. One saw an example of this in furious efforts among climate change denial circles to discredit Phoenix's 118° August monthly record high that was set earlier this month. Back to the Time article, it does not say that there is an immediate shortage. It is forward looking (which also makes 2023 data irrelevant to the future scenario covered in the article; critical reasoning empowers individuals to distinguish essential data from distractions, filtering out irrelevant details and concentrating on the information that directly shapes and influences the issue at hand). The article states: Affordable and nutritious, bananas have long been a supermarket staple for consumers around the globe. But that could soon change, as climate change is contributing to a global shortage of the world’s most consumed fruit... Two known diseases, Black Sigatoka and Tropical Race 4, are already present in key growing regions around the world, including Colombia and Peru, and experts expect that further spread of disease will have a large impact on supply over time.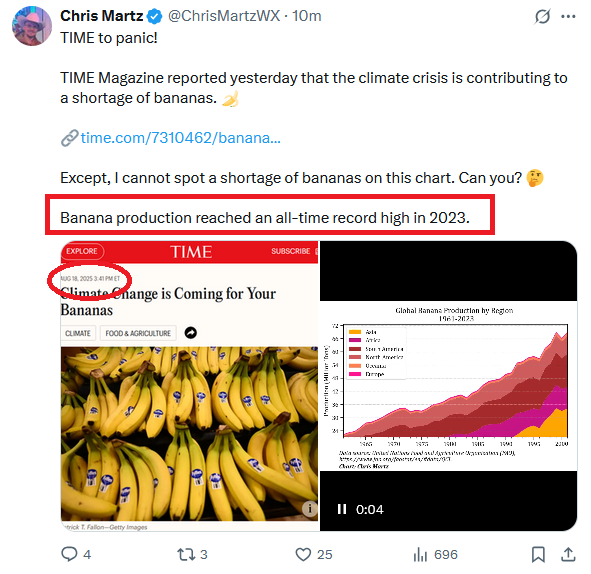
-
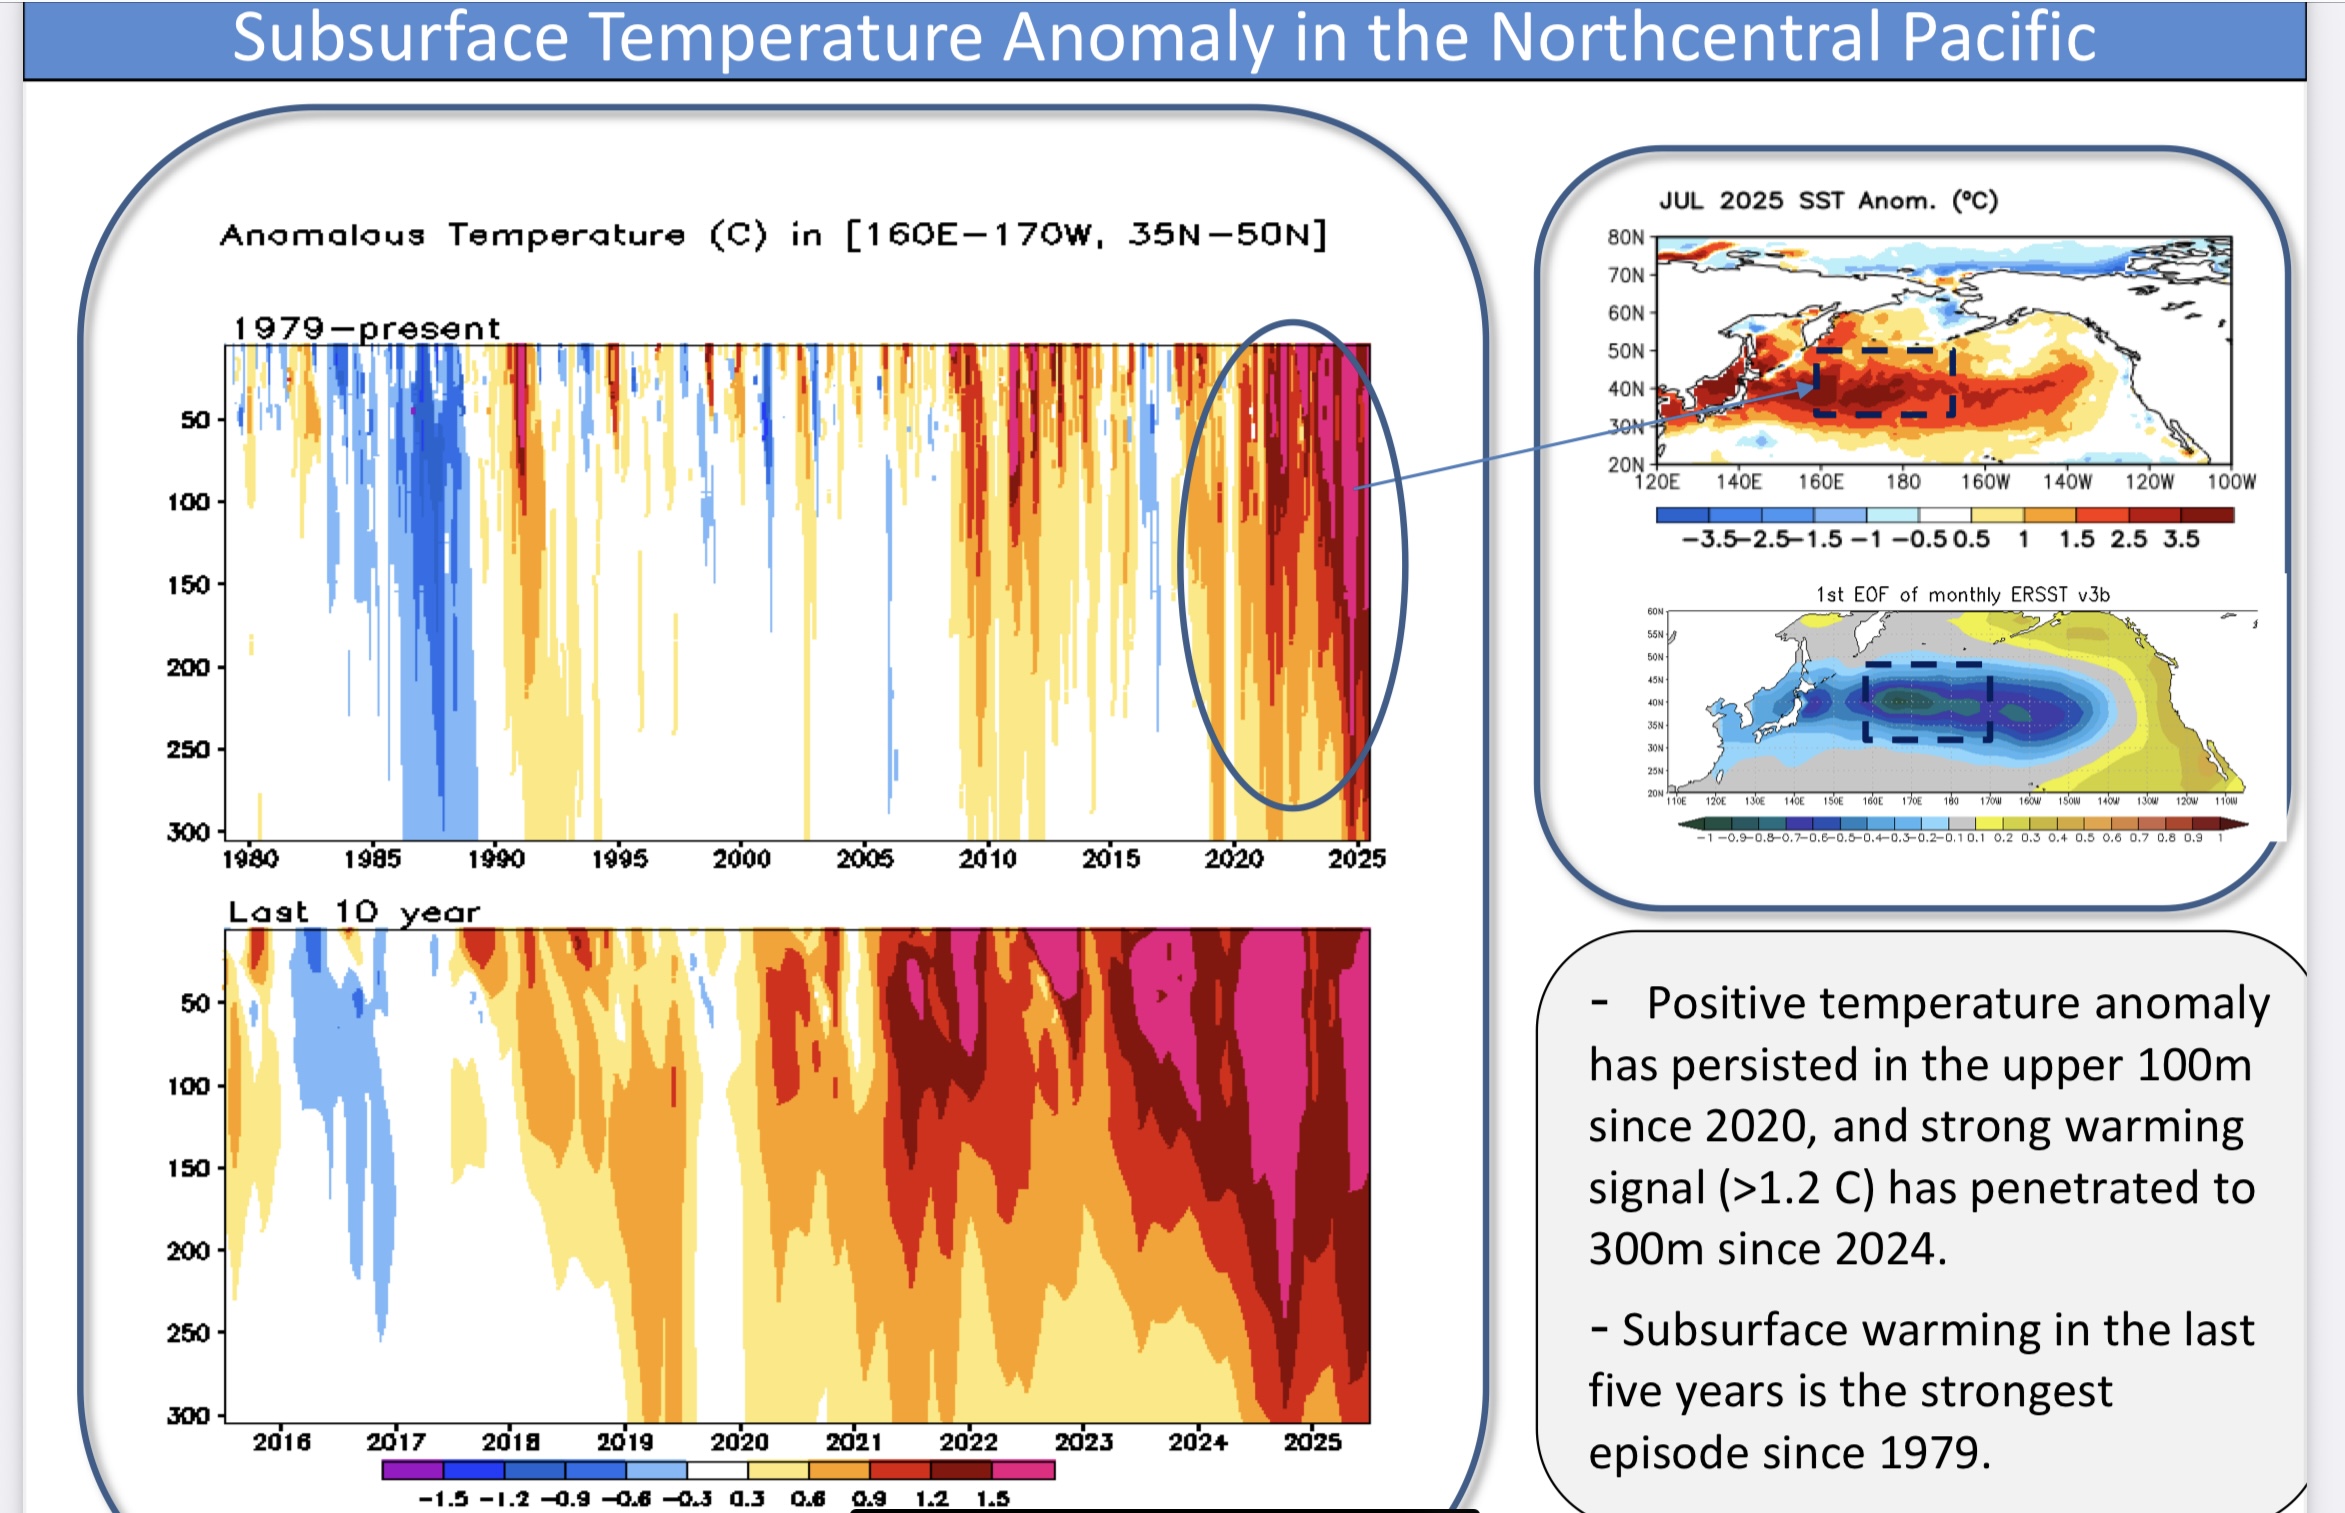
The subsurface accumulation of warmth is really off the charts. During the winter there was a trough east of Japan. But the SSTs weren’t able to cool much with so much heat below the surface. https://www.cpc.ncep.noaa.gov/products/GODAS/ocean_briefing_gif/global_ocean_monitoring_current.pdf

-

2025 Atlantic Hurricane Season
LongBeachSurfFreak replied to BarryStantonGBP's topic in Tropical Headquarters
Yeah it’s fuels both hurricanes and the temperature differences that power nor’easters. Without the Gulf Stream the weather in the northeast would be much more mundane.


-SnowfallAnalysisPublic1.png.7c4d089448c39fc2de0358244d486f5b.png)