All Activity
- Past hour
-
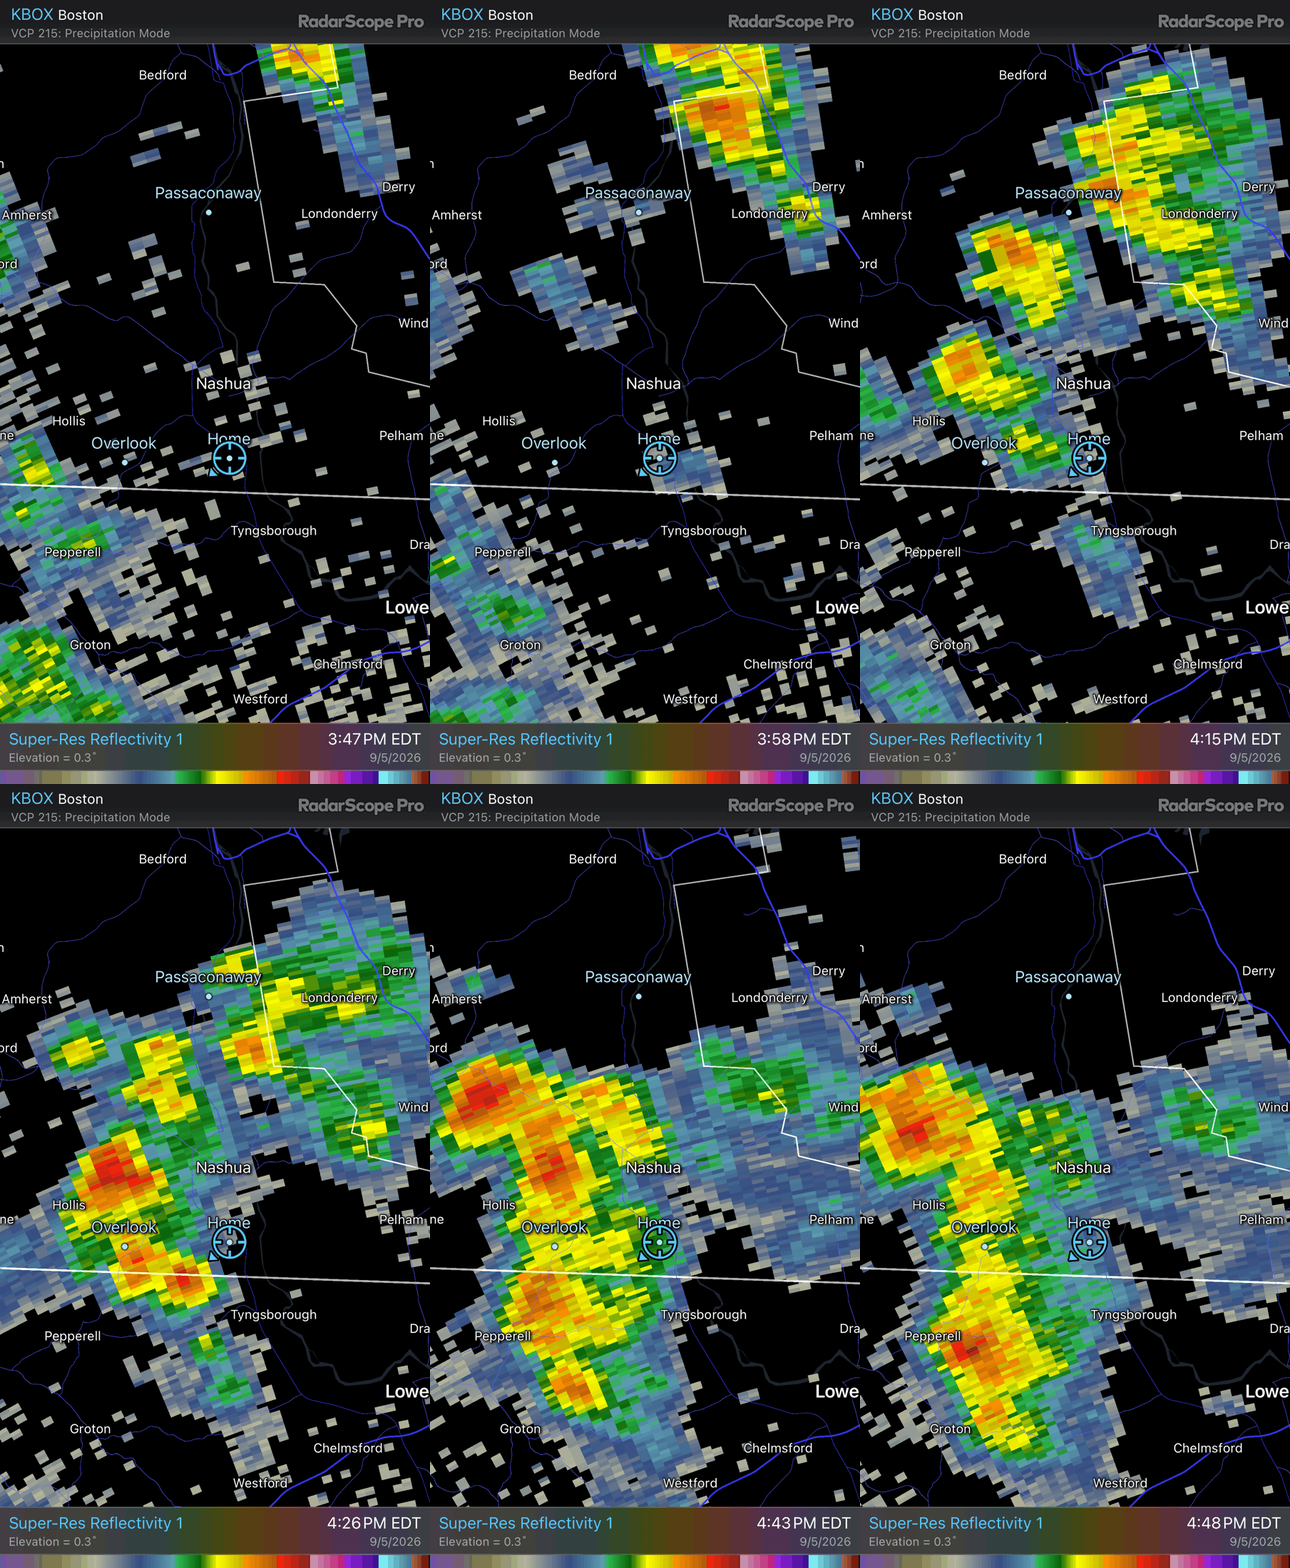
0.00”. Saw the outflow coming before the storms were even here and knew we were cooked
-
I swear I’m not actually judging lol. Did assume it was going out into the world since it had your FB in the bottom left. For us I guess it’s whatever. But I will say I can also look at 51 ens members and get a sense without this haha
-
No, the last column...2018 is a different eruption.
-
I just wanted a dashboard. I didn’t ask for this ai slop. I was just trying to get this something done quickly and it’s for this board only. Normal people wouldn’t have a clue to what this is
-
The AI graphics without fail just always look like AI graphics. Unlike some folks in this larger debate I don’t hold it against people for taking shortcuts when things aren’t their speciality - I sure as hell am not a graphic designer… but man it looks a special AI-sort of ugly lol.
-
No I just need a blizzard and a lot of weenie clown maps
-
you need a graphic designer this upcoming winter?

-

Septorcher 2026 Discussion - Endless Summer
Chrisrotary12 replied to Damage In Tolland's topic in New England
Stein. Stein. Everywhere a stein.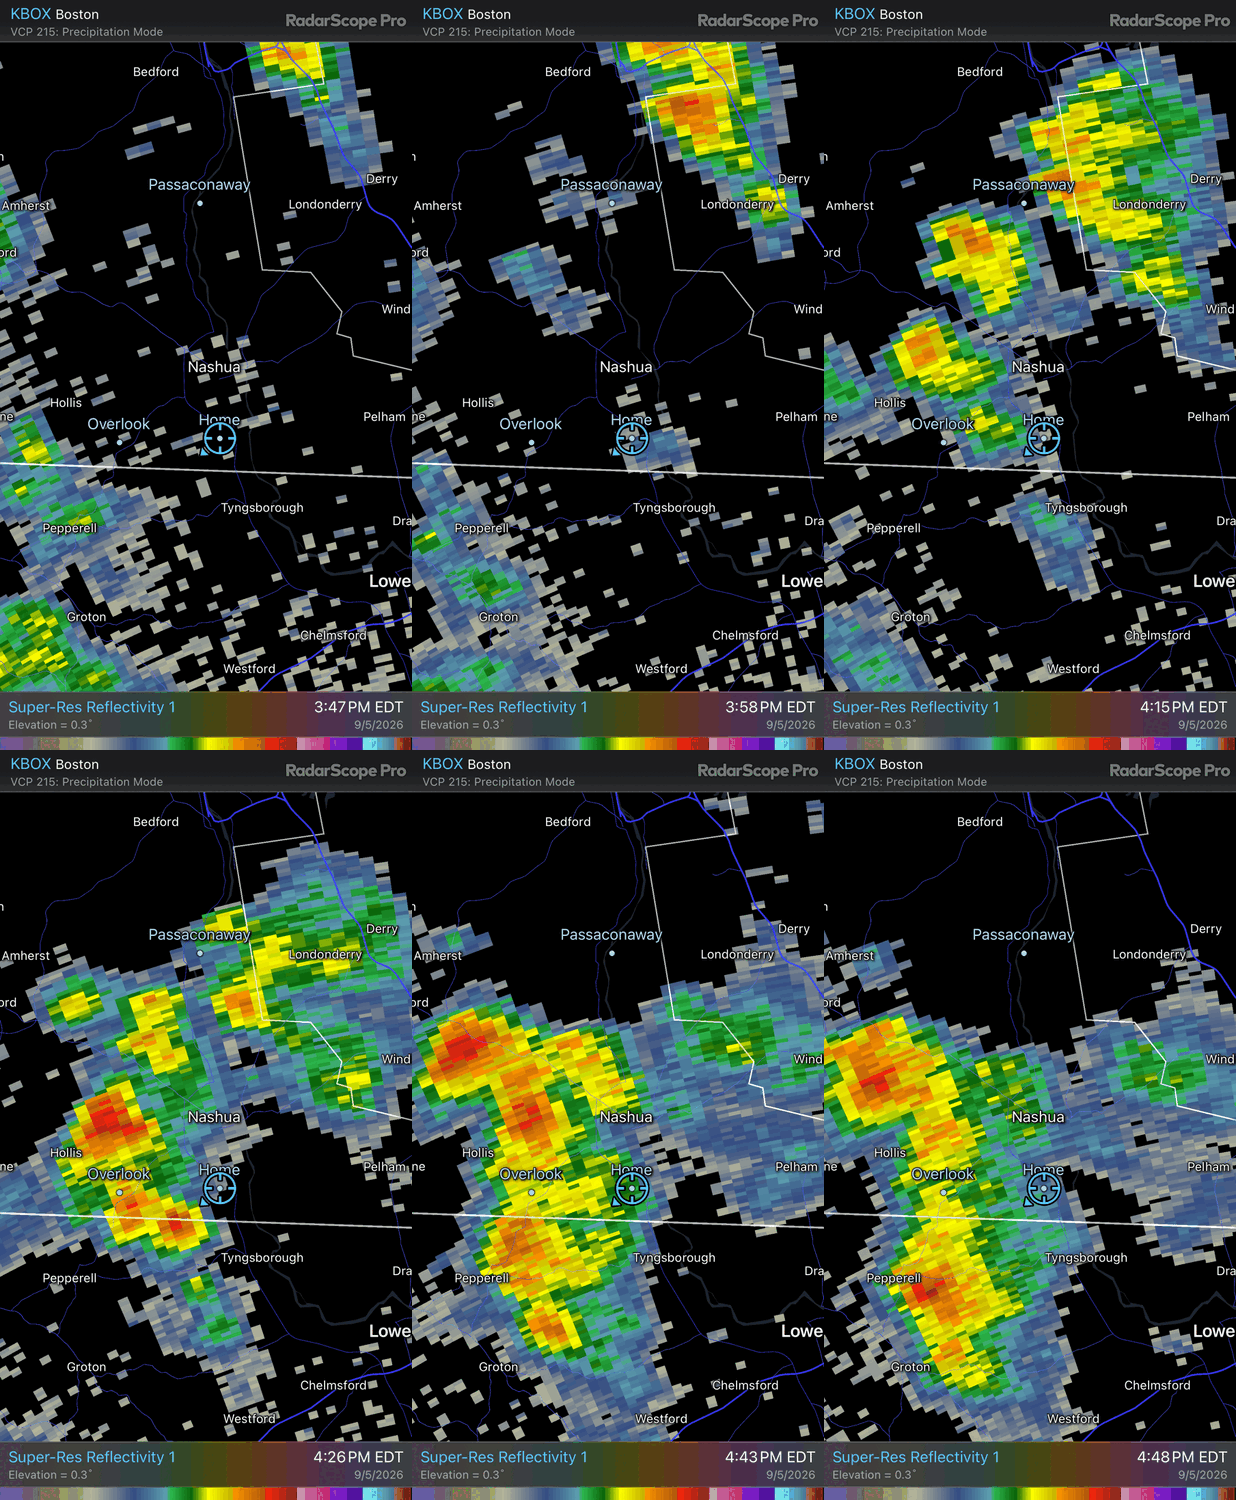
-
74F here with upper 50s for a dewpoint. It’s crazy the far southern part of the state still has 70F dewpoints. I don’t even know when the last 90F was here without looking. Sometime in July probably.
-
i made the chart more strict lol and taught it had to read the chart. That was my mistake last time. I just gave it the chart and assumed it could read it. thoughts? I dont ask for the branding. It just does it for me. Embarrasing.
-
this table says 2018? In any case, I saw a report that concluded Anak Krakatau's recent eruption plume went only 13% the height of Pinatubo, so likely talking about a substantially smaller impact if that figure is correct.
-
Doesn't appear as though it will have a major impact: To see how Anak Krakatau's potential output stacks up against historical climate-altering eruptions, see the table below: Volcano / Eruption Event Approximate \(SO_{2}\) Mass Released Global Climate Impact 1991 Mount Pinatubo ~20,000,000 tons Decreased global temperatures by 0.5 °C for 2 years 1883 Krakatau Eruption ~20,000,000 tons of Sulfur Decreased global temperatures by 1.2 °C 2022 Hunga Tonga-Hunga Ha'apai ~400,000 tons Minimal cooling (dominated by historic water vapor injection) 2018 Anak Krakatau Eruption ~173,000 tons Localized atmospheric/weather effects only Typical Anak Krakatau Daily Output ~190 tons/day No measurable climate impact
-
ive had one 20-24 since 2016 so i think i have a new climo
-
it was a good idea on paper. Let me give the numbers to AI manually lol. i must be using the cheap ass model
-
You've got a solid week of peace, so long as we stay out of the 90s.
-
Definitely, though I do recall the Euro seasonal painting a similar picture for 23-24. That feels like the only strong nino in recent memory where we somehow split down the middle and got a "mediocre" season versus either an all-out torchfest or a big snower.
-

Septorcher 2026 Discussion - Endless Summer
ineedsnow replied to Damage In Tolland's topic in New England
Pouring in Gardner -
How long does that buy us in terms of you not whining lol
-
Nicely done fact checking Ji’s AI, good catch. But I don’t think it changes the odds of a boom or bust, which is basically a coin flip at this point the boom/mid/bust split is 19/16/16
-
the AI envisions a winter where after an early season 2" snowfall we get a -2 inch event to bring the total back down. Same thing at the end of the season lmao

-
It definitely didn't do it right. Take a note of the color code, several 12"+ winters appear in the 0-10 row. Likewise several 5 inch winters intruded into both the 10-20" and 20"+ sections, and the lack of any 30"+ totals in the "delicious" column shows that it's obviously erroneous
-
Twice in a day!!!
-
Dang you cannot make this up...trace of rain. I really getting tired of this...sigh
-
So basically equal chances of boom, bust, or mid
-
20-24” is your average. You’re underselling your climo.