All Activity
- Past hour
-
Sure bud
-
Me? Are you joking? The context I provided about that chart is 100% correct. The claim that this is the “23rd lowest percentage of 90 degree days” is 100% made-up BS.
-

July 2025 Obs/Disco ... possible historic month for heat
Damage In Tolland replied to Typhoon Tip's topic in New England
The three ACATT amigos very very worried. Uh-oh -

2025-2026 ENSO
TheClimateChanger replied to 40/70 Benchmark's topic in Weather Forecasting and Discussion
No, it’s not a legitimate trend. It doesn’t account for changing distribution of stations as I stated above. There are many more high elevation sites today that seldom or never reach 90F, so, of course the percentage of days at all sites will go down. That’s not even talking about the non-climatic biases that would have favored the older era. Maybe there were more, but that’s not the way to do that analysis. -

July 2025 Obs/Disco ... possible historic month for heat
Torch Tiger replied to Typhoon Tip's topic in New England
Its like whatever that bozo Morgarbage says, take the opposite and you'll be nearly 100% correct. -
July 2025 Obs/Disco ... possible historic month for heat
Torch Tiger replied to Typhoon Tip's topic in New England
My o my.thumb.png.d36caaefd7cd4dfe0581ec522a1d4f90.png)
-
July 2025 Obs/Disco ... possible historic month for heat
Torch Tiger replied to Typhoon Tip's topic in New England
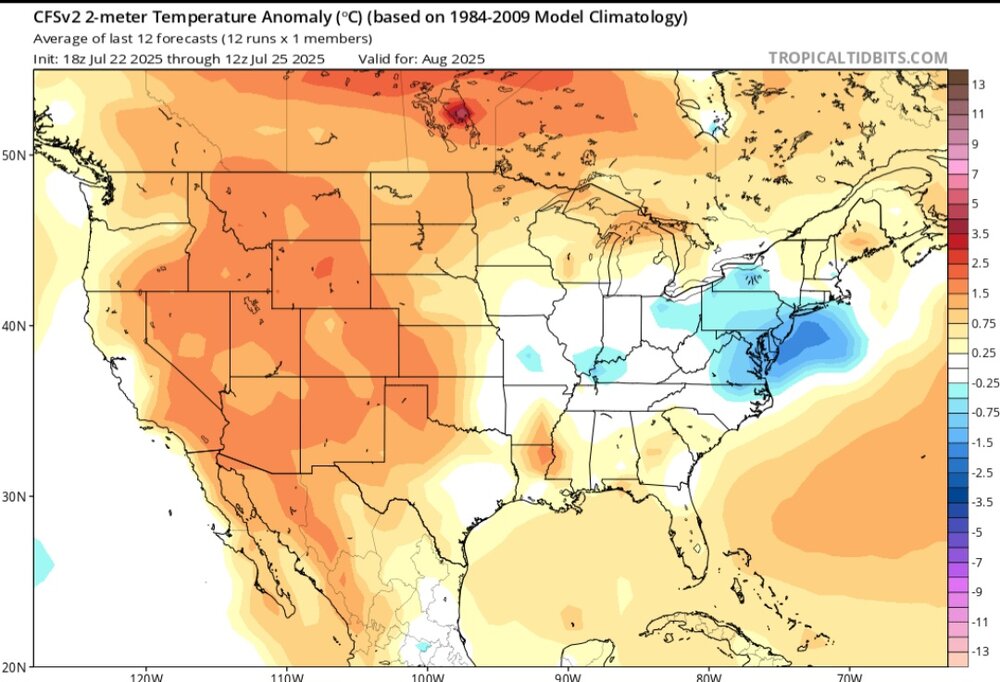
AN on that cfs...but cfs sucks -
July 2025 Obs/Disco ... possible historic month for heat
Torch Tiger replied to Typhoon Tip's topic in New England

-

July 2025 Obs/Disco ... possible historic month for heat
kdxken replied to Typhoon Tip's topic in New England
-
July 2025 Obs/Disco ... possible historic month for heat
kdxken replied to Typhoon Tip's topic in New England
Pic ? -
Ban this dude
-
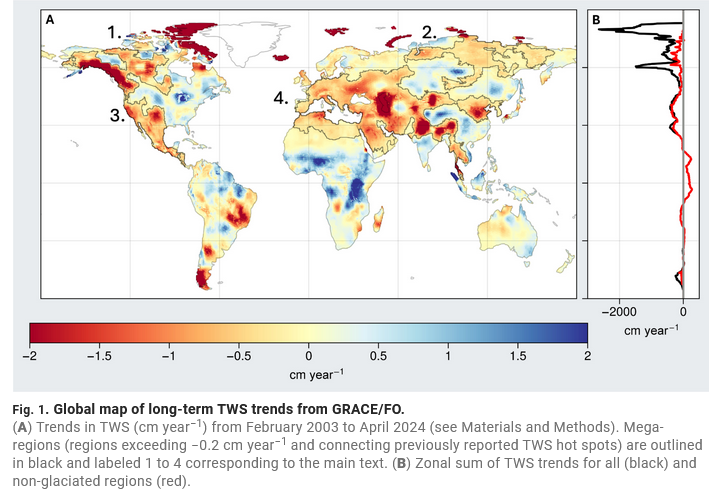
Abstract Changes in terrestrial water storage (TWS) are a critical indicator of freshwater availability. We use NASA GRACE/GRACE-FO data to show that the continents have undergone unprecedented TWS loss since 2002. Areas experiencing drying increased by twice the size of California annually, creating “mega-drying” regions across the Northern Hemisphere. While most of the world’s dry/wet areas continue to get drier/wetter, dry areas are now drying faster than wet areas are wetting. Changes in TWS are driven by high-latitude water losses, intense Central American/European droughts, and groundwater depletion, which accounts for 68% of TWS loss over non-glaciated continental regions. https://www.science.org/doi/10.1126/sciadv.adx0298
-
July 2025 Obs/Disco ... possible historic month for heat
Torch Tiger replied to Typhoon Tip's topic in New England
LR models are an inferno -

July 2025 Discussion-OBS - seasonable summer variability
winterwarlock replied to wdrag's topic in New York City Metro
That's a pretty solid 3 day heatwave next week -
Yeah, we were discussing this prospect a few weeks ago when this new paper was released. The authors have been interviewed about their findings since then. The shift to persistent 500mb ridging and SST warming across the mid-latitude Pacific may be an inherent response to a warming world which the research indicated occurred in previous warming eras for the earth. If we continue to see this block of warming and 500mb ridging continuing into the 2030s, then the new model simulation that was run could be onto something. Time will tell. https://insideclimatenews.org/news/18072025/southwestern-drought-likely-to-continue-through-2100/ But in this case, the phenomenon can last far longer than the usual 30-year cycle of the PDO. But if, as we hypothesize, this is a forced change in the sea surface temperatures in the North Pacific, this will be sustained into the future, and we need to start looking at this as a shift, instead of just the result of bad luck.” Todd was able analyze drought conditions during the mid-Holocene period 6,000 years ago, a period in Earth’s history when the Northern Pacific warmed and the Southwestern U.S. experienced hundreds of years of drought. That led to a warming of the North Pacific that was similar to the PDO that drives drought in the Southwest, but in this case, the drying lasted for centuries. “As soon as we saw that, you know, we started thinking about what’s happening today,” Todd said. Using an ensemble of historical and future climate models forecasting climate and precipitation patterns until 2100, they found the PDO-like negative phase continues through this century. But unlike the mid-Holocene period’s warming, which was brought on by vegetation change, today’s is driven by greenhouse gas emissions. Certain models revealed that the change in the ocean pattern was less about vegetation absorbing solar radiation, Todd said, and more about warming in general. In many ways, Richter said, what people are seeing on the ground is outpacing science.
-
Hillsborough Duke only recorded .32 but Blackwell mills which is close to me as well had around an inch
-
July 2025 Obs/Disco ... possible historic month for heat
kdxken replied to Typhoon Tip's topic in New England
And just like that summer comes to a screeching halt. -
July 2025 Obs/Disco ... possible historic month for heat
kdxken replied to Typhoon Tip's topic in New England
Looks like it'll be safe to go back into the pool -
"Corn sweat" is the term used to describe the moisture that corn plants release into the air through transpiration—kind of like the plants' version of sweating. A single acre of mature corn can release up to 4,000 gallons of water into the atmosphere per day during peak summer heat, dramatically increasing local humidity levels. That sticky, soupy air you feel in farm-heavy areas? You can thank all that hot, sweaty corn.
-
July 2025 Obs/Disco ... possible historic month for heat
kdxken replied to Typhoon Tip's topic in New England
62/60 that's more like it. -

E PA/NJ/DE Summer 2025 Obs/Discussion
Hurricane Agnes replied to Hurricane Agnes's topic in Philadelphia Region
I finally managed to get 0.02" overnight before midnight, which was not really enough but I guess it kept me from a total miss. Still have to pull out the hose. My Upper Darby sis said they got a deluge with near an 1". After a 73 low yesterday, my high did end up being 96, making it 11, 90+ days in July so far. With the 8, 90+ days in June (with one of them being a 100), that takes me to 19 for the season at post time. Currently partly sunny and 75 with dp 73. -

July 2025 Discussion-OBS - seasonable summer variability
bluewave replied to wdrag's topic in New York City Metro
This was the 5th 90° day of the season at Newark moving into 4th place on the all-time list. There were 4 NYC micronet stations which reached 100° also. So among the warmest stretches that our area has seen from late June into late July. Time Series Summary for NEWARK LIBERTY INTL AP, NJ - Jan through Dec Highest number of 100° days Click column heading to sort ascending, click again to sort descending. 1 1993 9 0 2 1949 8 0 3 2022 6 0 - 1953 6 0 4 2025 5 159 - 1988 5 0 - 1966 5 0 5 2011 4 0 - 2010 4 0 - 1955 4 0 - 1944 4 0 6 2012 3 0 - 2006 3 0 - 2005 3 0 - 2001 3 0 - 1999 3 0 - 1911 3 1 7 2024 2 0 - 2021 2 0 - 2013 2 0 - 2002 2 0 - 1997 2 0 - 1994 2 0 - 1991 2 0 - 1980 2 0 - 1977 2 0 - 1954 2 0 - 1948 2 0 - 1943 2 0 - 1936 2 0 - 1919 2 40 - 1901 2 4 - 1898 2 7 8 1995 1 0 - 1986 1 0 - 1982 1 0 - 1973 1 0 - 1963 1 0 - 1959 1 0 - 1957 1 0 - 1952 1 0 - 1937 1 0 - 1934 1 0 - 1933 1 0 - 1923 1 0 - 1918 1 38 - 1917 1 72 - 1913 1 6 - 1900 1 9 - 1881 1 18 13th St./16th / Alphabet City 99 78 85 108 78 80 41 0.09 14 1:50pm 6 2:35pm 21.3 160 Ave. / Howard Beach 95 75 83 110 75 85 54 0.08 28th St. / Chelsea 99 77 85 108 77 78 41 0.05 18 4:10pm 7 4:10pm 19.1 Astoria 100 78 86 109 78 74 40 0.00 16 3:45pm 7 3:45pm 19.5 Bensonhurst / Mapleton 97* 76* 82* 113* 76* 87* 49* 0.06 21.6 Bronx Mesonet 96 77 84 105 77 75 42 0.00 22 4:05pm 13 4:05pm 21.1 Brooklyn Mesonet 95 75 82 104 75 79 46 0.02 54 4:05pm 31 4:10pm 23.1 Brownsville 101 77 85 110 77 75 39 0.05 Corona 101 78 86 112 78 75 40 0.00 E 40th St. / Murray Hill 98 78 85 107 78 74 43 0.04 East River at Alphabet City Fresh Kills 99 75 82 110 75 96 43 0.44 48 4:00pm 27 4:00pm 20.8 Glendale / Maspeth 99 77 85 109 77 76 42 0.00 Gold Street / Navy Yard 98 76 84 107 76 80 43 0.04 26 3:55pm 14 3:55pm 22.8 Lefferts / South Ozone Park 94 76 84 107 76 77 49 0.00 Manhattan Mesonet 94 76 83 101 76 76 45 0.00 39 3:50pm 22 3:50pm 22.5 Newtown / Long Island City 97 78 85 106 78 75 43 0.00 22 3:50pm 10 3:50pm 20.9 Queens Mesonet 96 76 84 104 76 83 45 0.06 29 3:55pm 15 3:40pm 21.7 Queensbridge / Dutch Kills 99 78 86 110 78 74 41 0.01 19.0 Staten Island Mesonet 96 74 81 105 74 96 45 0.40 48 3:50pm 27 3:55pm 20.2 TLC Center 96 77 84 104 77 77 44 0.00 24 4:05pm 12 3:55pm 21.8 Tremont / Van Nest 102 78 87 112 78 73 37 0.00 22 4:10pm 10 -
US National Weather Service State College PA Favorites ·seordponSt0a8fg4ac03cu9cg29lfgt9001l4lu50gu1645t625m63uiu1g7 · Scattered showers and thunderstorms are expected to develop today in the warm and muggy airmass in place across Pennsylvania. Localized flash flooding is possible areawide, while isolated damaging winds are possible in storms across primarily the southwestern half of the commonwealth. | Saturday, July 26 @ 6am
-
.87 rain yesterday from 2 thunderstorms.
-
 Im unfamiliar with the details of the Ambient stations, there's no battery back up?

.png.f95584f367dcd710cfad1a2b2fb8371e.png)